


 Arguments


Recent Comments
Prev 660 661 662 663 664 665 666 667 668 669 670 671 672 673 674 675 Next
Comments 33351 to 33400:
-
denisaf at 16:00 PM on 15 October 2014Dinner with global warming contrarians, disaster for dessert
The stark reality is that irreversible rapid global warming and ocean acidification in under way. Measurements confirm that hypothesis. The increase in storms, droughts, ice extent and floods provide substantiating data. As does the changes in the marine eco system.
Ironically, even sound mitigation measures will only slow this dleterious process down slightly.
-
Magma at 11:11 AM on 15 October 2014Ocean Warming has been Greatly Underestimated
Fascinating paper and well worth a careful read. Actually the paper is dense enough that it requires a careful read. Personally I would have preferred that the AVISO sea surface height data was shown in the body of the main paper rather than being relegated to a supplementary appendix. There are enough inconsistencies with the multi-model mean that it would be better to put it in and let readers work their own way through the comparison and the authors' justifications.
The figure shown here as Figure 5 is Figure S5 in the appendix. There must be some subtle technical details I'm missing, but the comparison seems to be largely pointless, since both sets of modeled data in question pretty much have to have a high degree of correlation.
We find a very high correlation between modelled SSH (global mean removed) and steric height (global mean removed) derived from modelled salinity and temperature fields.
Apart from water transfered to the oceans from continental glaciers, ice sheets and groundwater, what else besides thermosteric and halosteric effects can affect sea level over large areas on a decadal time frame? Persistant wind patterns, maybe?Moderator Response:[Rob P] - As explained in the post, the multi-model mean is equivalent to an Earth without any natural variability, so of course there are inconsistencies. Yes, there is some circular reasoning here because the sea surface height (SSH) data only extend back to 1992, and it would be nice to see a comparison of two truly independent data sets over the entire period - but they don't exist. Perhaps tide gauge data in tandem with ocean models in the latter part of the 20th century could help here? Lots of issues to overcome there however.
In regard to decadal time frames, the Interdecadal Pacific Oscillation (IPO) has a significant effect on sea surface height. The negative phase (2000-to present-day) sees intensified trade winds which temporarily pile up water mass in the western tropical Pacific and diminish it in the eastern tropical Pacific (see the SkS Tuvalu sea level rise rebuttal) and cause greater-than-average precipitation over land, thus temporarily reducing the ocean volume (see SkS Sea level fell in 2010 rebuttal and SkS post A relentless rise in global sea level).
Maybe once/if a deep Argo network gets underway, we can come to grips with the nitty-gritty details and finally get around to closing that sea level budget.
-
Tom Curtis at 10:32 AM on 15 October 20142013 SkS Weekly News Roundup #27B
LuisC has seen fit to accuse me of "insinuating" that he is a liar. Given his statement @2 above, and his own insinuations when he asks, "I would be interested to know how he maintains that it's ''not relevant'', when indeed many people have been left with the impression that gas coming out of faucets is something new under the sun and that fracking is to blame" about Fox, he seems rather to precious to me. That is particularly the case given that he misrepresented Fox in the passage from which that quote came; and that (assuming, as it appears, that he has watched Fracknation) he knows that the two intances about which he "... would be interested to know why they are not relevant" are two instances where the water did not contain methane in significant quantities until after the commencement of fracking (according to the propery owners), and hence for which he therefore already knows why the preexisting methane contamination of other local wells is not relevant.
However, I made no insinuation regarding LuisC's honesty. I presented him with a conditional. Accepting the conditional, he must either accept the consequent, or deny the antecedent. His inability to understand that - in effect, his determination to affirm the consequent in no way justifies assuming that I am likewise challenged in basic logic.
What is worse, I even (twice) indicated that the conditional may not apply to Luis, and indicated a reason why it may not apply to him. He has interpreted this possible exemption as itself an insinuation of dishonesty. Apparently nothing will do for him except my stating categorically that he was ignorant and that therefore the conditional did not apply.
His proper response to the dichotomy I presented him was either to explicitly reject McAleer's standard (and therefore to withdraw his claim @2 which while moderated is still his stated position); or to plead ignorance thus escaping the dichotomy), or to acknowledge himself and McAleer a liar (by McAleer's standard). He appears to want to escape the dichotomy a fourth way, by maintaining the standard, and inconsistently, rejecting the implications of that standard for his and McAleer's honesty.
For myself, I simply reject the standard. Video documentaries are a compressed form of communication that of necessity require leaving out of vast amounts of relevant information. Which information is relevant and vital (and hence should not be left out) and which is relevant but merely adds complexity (because it does not effect the overall case, or because other relevant information rebuts it) is a judgement call. I have no opinion as to whether or not Fox successfully navigated those judgement calls without error, and still less as to whether any errors in judgement (if they exist) were deliberate (and hence represent actual dishonesty) for the simple reason that I have not seen his video.
I do have an opinion as to whether McAleer has successfully navigated those judgement calls, and as to whether any of his "errors of judgement" were deliberate. Moderation policy, however, forbids me from sharing it. (And yes, that is an insinuation.)
Moderator Response:[PS] Discussion on the relative merits of science presented in popular documentaries is welcome here - provided everyone sticks to the science. Pointers to reports/papers, particularly peer-reviewed papers, in support of claims is particularly welcome.
This discussion however is being derailed by insinuations of deliberate deception which I tried to nip in the bud. I would request all commentators wanting further discussion to take a deep breath, chuck off the baggage, and concentrate on science. In particular, please refrain from personal attacks. Failure to do so by any party will result in comments being deleted.
-
Glenn Tamblyn at 10:06 AM on 15 October 2014CO2 effect is saturated
Jonathon
I agree with KR that using analogies to understand something can be problematic. And your introduction of 'reflection' and 'diffraction' is inaccurate. Reflection only occurs when light interacts with a surface of a solid or a liquid. It does not apply to a gas. Similarly diffraction occcurs when light passes through a surface into a solid or liquid.
In the case of fog both of these things occur. Light is reflected off the surface of the drops of water and is also diffracted through the drops. Additionally there is also scattering of the light by the droplet. In all three cases the photon of light is not extinguished, its trajectory is simply changed.
None of these three phenomena are relevent to understanding what is happening wrt the GH gases. Reflection and diffraction don't apply and at the infre-red wavelengths involved here scattering is negligible.
So everything wrt GH gases is about absorption and emission. In absorption the GH molecule actually absorbs the photon. The energy of the photon is added to the energy of the molecule and the photon ceases to exist. In emission the molecule actually creates a photon which 'launches' away in a random direction, taking some of the molecules energy with it, leaving the molecule with less energy.
The form the energy takes within the molecule is important. A molecule can be thought of as a collection of atoms that are joined by elecrical bonds. The bonds allow the individual atoms to jiggle around relative to each other - the molecule isn't a rigid body. You could think of it as if each atom in the molecule is on springs connecting it to its partners. So there is energy involved in this vibration. And when a molecule absorbs a photon the photon's energy is added to this vibration and the atoms jiggle harder.
There is a second mechanism that applies to a few GH molecules, notably water. Molecules don't just vibrate internally, they also tumble and rotate. Some molecules are able to absorb energy from a photon and convert it into a change in the rotational motion of the entire molecule rather than internal vibration of the atoms.
Finally there is the movement of the molecule through space and the absorption of the energy and momentum from the photon contributes to changing that.
Because the energy the molecule absorbs is in the form of mechanical, energy of movement it is then easily able to be transferred to other molecules around it through collisions. Molecules in the air at sea level each undergo billions of collisions per second with other molecules, mainly th non-GH gases oxygen and nitrogen. So when a GH molecule has been energised by absorbing a photon, it will usually actually lose that energy through collisions. So the absorption ends up adding to the total pool of energy present amongst all the molecules in the air.
The main gases in the atmosphere, oxygen and nitrogen can't absorb or emit infrared photons so it might seem that the energy from the absorbed photon has been lost forever, never to be released. But thhis is not the case.
Because GH molecules can also be energised in collisions with other molecules. At any instant a certain percentage of the GH molecules in the air will be in a more energised state due to recent collisions with other molecules. Mostly they will be de-energised again by another collision - it is estimated that around 1 in 50 collisions between molecules cause changes in the internal vibrations of the atoms - but occasionally they will de-energise instead by emitting an IR photon.
So the molecule that absorbed the photon may not be the one that emits it later.
And the new, emitted photon goes of in a completely random direction, unrelated to the direction the original came from.....
... And after a short distance is likely absorbed by another GH molecule and the game starts all over again. It really is like a game of billiards in 3 dimensions and on a vast scale.
So, going back to your use of the fog analogy. It might have some merit if used carefully, strictly defined as an analogy for illustrative purposes only but it shouldn't be used to derive an understanding of the process.
And to be useful you need to introduce something missing from the simple fog analogy.
The fog is glowing!
Even when there is no headlight shining through it, the fog is glowing from its own internal energy.
If the idea of a gas glowing seems strange, look up at the sky. The Sun. A big ball of gas and plasma that is glowing very, very brightly. Well cooler gases glow as well, just not as brightly, and not in the visible spectrum, but in the infra-red.
Hope that helps some.
-
ranyl at 09:34 AM on 15 October 2014Ocean Warming has been Greatly Underestimated
Thanks Rob for a good summary.
Bigger CS less carbon budget.
Not that we have one!
Might help explain why last CO2 350ppm the world was 3-5C hotter a little more, and that is being optimistic as those estimates don't include the warmer Pacific warm pool recently reported for the early Pliocene.
-
Rob Honeycutt at 09:26 AM on 15 October 2014Dinner with global warming contrarians, disaster for dessert
I believe Betts is woefully naive in thinking this changes anything relative to Watts. My prediction is, this will end up like Muller. At some point Betts is going to have to tell Watts something scientifically accurate that he really doesn't want to hear and then Watts will turn the dagger on Betts.
Mark my words.
-
tstreet at 07:27 AM on 15 October 2014Dinner with global warming contrarians, disaster for dessert
Way too much meat served at this luncheon. Can't tell, though, the distribution between the two groups.
-
Rob Honeycutt at 04:22 AM on 15 October 2014Ocean Warming has been Greatly Underestimated
It can't be said enough times...
Uncertainty in not our friend!
-
jja at 03:48 AM on 15 October 2014Ocean Warming has been Greatly Underestimated
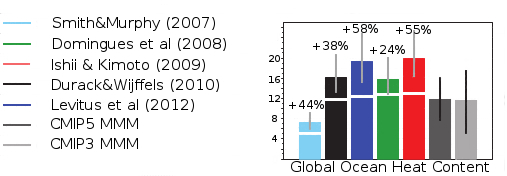 This
ThisThis needs to be more fully looked at. 1. The adjustments are above the CMIP MMM error bars.
2. The adjustments come from the southern hemisphere only, the northern hemisphere follows with the CMIP MMM.
3. The error found in the 0-700meter southern hemisphere increases the total global heat accumulation (as compared by Nuccitelli et. al 2012) by (roughly) 9-30%.
Implications for TOA heat flux
1. Total heat flux imbalance is now adjusted upwards from .7 to .9 watts per meter squared.
2. Since the entirety of this adjustment occurred in the southern hemisphere, (but not the northern) indicates that there is a fundamental flaw in the basic model of understanding.
3. The basic model of understanding appears to be severely underestimating northern hemisphere aerosol effects.
4. The basic model also appears to be extremely underestimating GHG radiative forcing effects, (measurement error in SH + aerosol adjustment error in NH)
5. This analysis pushes the AR5 results to the very edge of the 2-sigma error range for these two forcing mechanisms.
Iplications:
1. ECS is now likely between 3C and 5.5C with an increased "most likely" value of 4C for a 2X CO2.2. Future land-only temperatures will increase under given emissions pathways at a much higher rate than previously modeled as TOA energy imbalance increases 20% more rapidly.
3. Carbon cycle and permafrost degredation will occur more rapidly and more intensely than previously considered.
4. This does explain a bit why the modeled arctic sea ice projections were deviatiing so strongly from observations. The relatively aerosol-free arctic is experiencing a much higher downward longwave flux than has been modeled.
-
CO2 effect is saturated
Jonathan Doolin - I took a quick look at your video, and there are numerous conceptual issues present.
A 'blackbody' emits as per the dotted lines shown for various temperatures. Perfect blackbodies are not real, although some objects approach it for specific frequency bands. The ground, for example, has an emissivity of 98-99% in the IR range (98-99% of an ideal blackbody) - anything less than that in satellite observations indicates emission from something else in the atmosphere, rather than in an IR transparent window.
What you are looking at in any of the satellite or ground spectra is the result of many different molecules, many different gases and/or materials. CO2, H2O, O3, and other gases absorb and emit based on their molecular structure, acting as frequency dependent antennae. And the different levels in the spectra reflect what temperature the emitting object is, and (by the lapse rate) where it's located in the atmospheric column. You cannot treat this as the emission from a single object or material.
The small graph you looked at for an ozone peak appears to be from Harries 2001, and is a graph of changes in emission to space from 1970 to 1996 with increasing GHGs - it's a delta graph.
---
I would strongly suggest some introductory reading to orient yourself to the general principles involved, such as the Greenhouse Effect Basics on SkS. To be quite frank, the gaps in your understanding will otherwise will prevent any useful technical reasoning on the issues.
-
CO2 effect is saturated
Jonathan Doolin - Major issues: scattering is not absorption.
Scattering redirects incoming light in an anisotropic (angle-dependent) fashion. Fog scatters visibile light with neglible absorption, and when the headlights turn off the scattered light ceases as well. Think pachinko balls for this. There is a very small amount of momentum transfer involved, nothing on the level of thermal absorption.
Absorption raises the energy of the absorbing molecule, contributing to the thermal energy of the gas - if all other things are held equal an equivalent amount of past absorbed energy spread across the emission spectra will be thermally emitted by that gas volume at some later point (not, generally, at identical frequencies to incoming photons, or from the same molecules, but in the same spectra range), isotropically. This is a completely different phenomena.
So no, fog is not an "apt" analogy to absorption/emission in any way. If you start from that as your analogy you are already pointing in the wrong directions, even without the logical error of trying to reason analogically rather than in the system of interest. "If you think that the line of argument that led you to believe something about X might also apply to Y, don't talk about X. Apply the reasoning to Y and see if it works."
-
Jonathan Doolin at 01:06 AM on 15 October 2014CO2 effect is saturated
Tom Curtis @295
Thanks.
Here is a video to give some more detail.
LINK
I think pedagogically I'm going to tend toward the use of k = T*1.96/(cm•K) for my Wein's Law needs. Though lambda • T = .0029 meter Kelvin will come in handy sometimes, too.To Rob @299 and KR @300
I'm still looking into this issue. How is the analogy "apt" and how is it not?The headlights should not only illuminate the fog, but should actually bounce off the fog. When the light bounces off the fog, since light has momentum, it does change the kinetic energy of the molecules in the fog.
But when you turn the headlights off, the fog does not continue to glow in visible light. Rather, the light dissipates fairly quickly.
I guess I have two major questions in this area. (1) Why does the visible light reflect off the fog, when it does not reflect off a region of no fog? My hypothesis would be that H20 has a significant absorption/emission spectrum in the visible range, wheras Oxygen/Nitrogen/Argon do not.
(2) Why does the light immediately dissipate once the headlights are turned off? My hypothesis would be that the internal energy of the fog is not sufficient to activate those modes of motion.
In any case, to feel complete to me, a model must include reflection, and transparency, (and possibly refraction) as well as absorption and emission...
Checking my assumptions, I'm thinking that a gas cannot emit, absorb, or reflect light in any spectrum where it is completely transparent. But fog is not transparent in visible light, so by that assumption must be absorbing, emitting, and reflecting visible light. It's just not heating to the point where the visible light becomes a significant part of its blackbody spectrum.
-
Rob Honeycutt at 00:56 AM on 15 October 2014Increasing CO2 has little to no effect
Skinny_Pete... You seem to have failed on my other suggestions of reading the relevant material presented in the articles above, and the suggestion that you read the comments policy. I resubmit both of those suggestions to you.
The fact is, the radiative properties of CO2 are extremely well established physics. I can accept Tom's sense that the bottle experiment is not a well controlled one, but you can see the same effects at work with a thermal camera set up. Here.
-
JohnSeers at 00:50 AM on 15 October 2014Tung and Zhou circularly blame ~40% of global warming on regional warming
When I try to watch the video I get a message "This video is private". Any chance of fixing that?
-
CO2 effect is saturated
Glenn Tamblyn - Far more accurate than the references I was looking at.
"Saturation" is a horrible term, really, inappropriate for an exponential decrease with distance as there is no specification of an end-point. Far better to use e-fold distance or mean path length - some measure with actual values.
So absorption path lengths for GHGs can be quite short at sea level depending on wavelength. The biggest issues with the "CO2 is saturated" claims are that:
- Path length increases with decreasing atmospheric pressure
- The energy radiated to space depends on the lapse rate and altitude of emission, and
- Increasing GHGs increase that altitude, decreasing IR to space, creating an imbalance until the climate and atmosphere warm enough to redress it.
-
John Hartz at 23:49 PM on 14 October 20142013 SkS Weekly News Roundup #27B
[Moderation Comment]
Luis C: Please note that posting comments here at SkS is a privilege, not a right. This privilege can and will be rescinded if the posting individual continues to treat adherence to the Comments Policy as optional, rather than the mandatory condition of participating in this online forum.
-
JARWillis at 23:37 PM on 14 October 2014Dinner with global warming contrarians, disaster for dessert
This sort of discussion, while perfectly reasonable, lends weight to the popular misconception that sufficient doubt remains about climate science to allow us to safely delay significant action.
The message to the public is simple common sense - we cannot afford to take the risk that these indefatigable doubters are wrong and the overwhelming body of expert opinion turns out, when it is too late, to have been right.
There will always be debate about details of the science, but the press, including the Daily Mail, must accept that there is absolutely no doubt about the need for action. You hit the brake before you hit the wall - even if you are not yet sure what you have seen is a wall - and especially when you have a car full of children
-
DSL at 23:22 PM on 14 October 2014Increasing CO2 has little to no effect
Isn't there a "But I built this box/bottle/aquarium experiment, and it proves that . . ." myth somewhere in the list?
-
CBDunkerson at 22:00 PM on 14 October 20142013 SkS Weekly News Roundup #27B
LuisC wrote: "To the extent that fracking faciliates more extraction and the driving down of gas prices, it is of course facilating humanity's ''addiction'' to fossil fuels, and in this sense is dangerous."
In a roundabout way, this may actually turn out to be a good thing. Fracking is responsible for the fossil fuel boom in the US... which is now starting to drive down global oil prices. However, those lower prices are a problem for many countries (e.g. Russia) which can only extract oil at relatively high cost. Indeed, the fracking boom in the US itself is only possible due to high oil prices. The 'gold rush' mentality in the US may actually lead to fracking making itself temporarily uneconomical. Depending on how big the bubble and how damaging its collapse will be, the forthcoming 'fracking bust' could put the breaks on further deployment of the technology long enough for renewable alternatives to grow into the dominant energy source.
Had fracking been rolled out slowly with careful regulation and long term planning, it could have been profitable for decades. Instead, there has been a 'drill baby drill' mentality with everyone in the industry rushing to capitalize in the quickest and dirtiest ways possible. That foolishness will come back to bite them. The question then is whether the industry will be able to quickly restructure itself to a somewhat 'sustainable' (for a few decades anyway) model before renewables can move into the gap.
As to the rest, I notice you are no longer saying that fracking does not cause earthquakes. Conceding the point in the face of overwhelming evidence, or just avoiding an argument you can't win?
-
Tom Curtis at 21:40 PM on 14 October 2014Increasing CO2 has little to no effect
Skinny_Pete @159 & 162:
1) With regard to your experiment, nearly all incoming solar radiation is in the visible wavelengths. CO2 does not trap energy in visible wavelengths, and moreover, the ground is a good absorber in the IR wavelengths at which CO2 is a good absorber. Therefore increasing the CO2 in a small box will not increase the temperature of the box in sunlight appreciably due to traping more incoming. Further, due to the small size of the box, the normal motion of atmospheric particles within the box will keep the entirety of the box at essentially the temperarature of the ground on which it is located (or the floor of the box). Therefore any excess energy trapped by CO2 in the box from outgoing IR radiation will be replaced by an equal amount of outgoing IR energy radiated by the CO2. Therefore, and contrary to Rob Honeycutt, the temperature will not be appreciably different in either case. (I have seen several videos of this experiment done, with some showing a slightly higher temperature for the box containing CO2, and some showing the reverse. Both differences are down to errors in the conducting of the experiment.)
2) I am dubious about the experiment shown in the video linked by Rob Honeycutt. The two bottles with stoppers and thermometers installed are essentially air tight. Therefore, plausibly, the CO2 released in the bottle will raise the pressure in the bottle, thereby increasing temperatures. I do not see how this contaminating effect is controlled for, so I consider the results to be dubious at best.
3) Having said that, if the CO2 could be generated seperately and then poured into the bottle before sealing, and then the bottle left to sit till it was at room temperature before turning on the light, you would then have a far better experimental design than typically seen. Specifically, because the light shines in from the side and all sides are transparent, visible light for the most part will shine straight through the bottle without warming, so that IR radiation absorbed by the CO2 would in fact be additional warming. The amount of additional IR radiation absorbed is likely to be small, however, so I am not convinced that the additional warming would be appreciable relative to experimental error.
4) I have given considerable thought as to how to perform the experiment you are interested in correctly. It would be difficult, however, and require maintaining a vacumn in parts of the experiment for the duration of the experiment, so I don't expect to see it done correctly on Youtube any time soon.
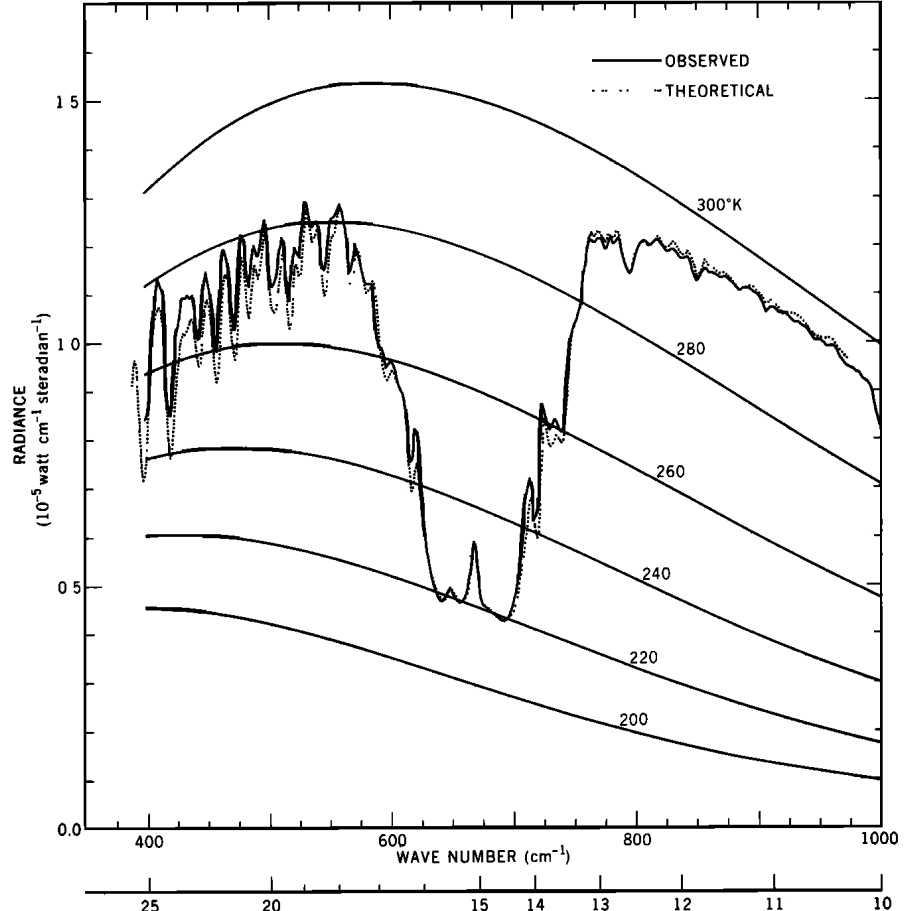
5) Such experiments are, however, entirely beside the point. Simple radiation models have shown the ability to predict upward and downward radiation in the Earth's atmosphere with stunning accuracy. Here, for example, is a comparison between predicted and observed upward IR radiation at a site in Texas from 1970:
And here is a comparison of measured and predicted total Outgoing Longwave Radiation for 134,862 observations over a wide range of atmospheric conditions (both as to temperature and latitude) reported in 2008:
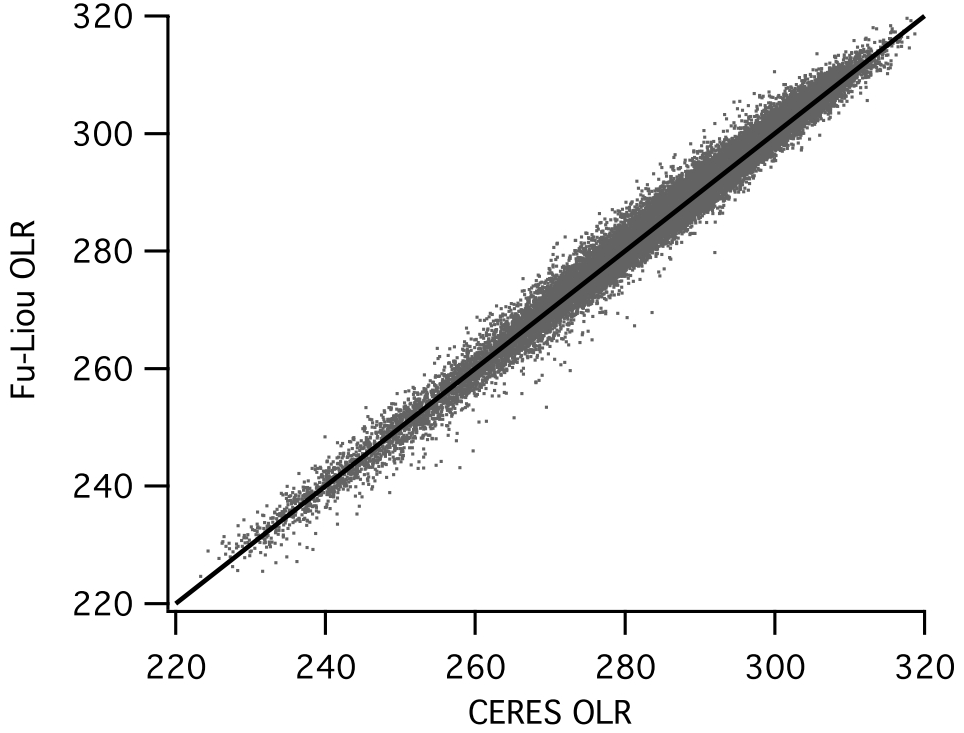
These are models of radiation only. They involve no problems with chaos theory, and no problems with performance. It is the output of models like these that predict the greenhouse effect, and that the greenhouse effect is not saturated. The greenhouse effect has been observationally proved to exist, as much as such a term is ever appropriate in science.
-
Tom Curtis at 20:58 PM on 14 October 20142013 SkS Weekly News Roundup #27B
LuisC @12, I also apologize for mispelling your name.
I note that you have misquoted me in your reply. Specifically, I stated:
"Given the standard McAleer and (apparently) Louis use for accusations of dishonesty, the failure to mention that case by either demonstrates them both to be liars. Perhaps Louis was merely ignorant."
(Emphasis added.)
You chose to delete from the quote those sections I have bolded above, including the first clause of the sentence which clearly makes the sentence conditional. I at no point indicate that I accepted the standard of McAleer, or your apparent standard. I merely point out that those that do, including McAleer, if they are are consistent must conclude that McAleer is a liar.
In your case, it is open for you to reject McAleer's standard. You can conclude that a person can reasonably leave out information considered germain by others without thereby being a liar. But if you will not reject McAleer's standard, you (not I) brand yourself a liar for you have clearly left out germain information.
I will note that your new guise as "devil's advocate" is inconsisent with your initial sally @2 above.
Moderator Response:[JH] The first of Luis C's comments that you are responding to has been deleted for violating two elements of the the SkS Comments Policy, i.e., no moderation complaints and no sloganeering/trolling.
-
Skinny_Pete at 20:58 PM on 14 October 2014Increasing CO2 has little to no effect
Thanks for the brush off. I disagree with the You Tube video. I have tried this experiment numerous times in sunlight and the temperature has always stayed the same in both greenhouses. Clearly many other factors are needed to make the temperature go up, e.g. smoke, dust, pollen, pollutants, water vapour etc.
Moderator Response:[JH] Please keep it civil.
Please note that posting comments here at SkS is a privilege, not a right. This privilege can and will be rescinded if the posting individual continues to treat adherence to the Comments Policy as optional, rather than the mandatory condition of participating in this online forum.
-
michael sweet at 20:04 PM on 14 October 20142013 SkS Weekly News Roundup #27B
LuisC,
Sorry about msispelling your name, I often make spelling errors.
It is not the purpose at SkS to discuss all thngs that anyone thinks might be related to tangently to Global Warming. For example, there is no nuclear dedicated thread. I suggest you take your complaints to a forum that is dedicated to your questions.
I get the impression that you are a concern troll. You say that you are concered and then outline all the vague accusations made against Fox, without references to support your claims. Please begin to support your claims with data beyond an industry propaganda piece.
In the future I will adhere to DNFTT.
Moderator Response:[JH] Luis C's comment that you are responding to has been deleted for violating two elements of the the SkS Comments Policy, i.e., no moderation complaints and no sloganeering/trolling.
-
Tom Curtis at 13:59 PM on 14 October 20142013 SkS Weekly News Roundup #27B
michael sweet @10, there is some truth in claims that Gasland overstates the case against fracking. For instance, of three people apparently mentioned as having methane contaminated water as a result of fracking in Weld County, Colorado, two, including Mike Markham (featured in the scene showing water from the tap being lit by a ligher), were found to have methane of biogenic origin. However, the third case the well of Aimee Ellsworth was found to contain"... a mixture of biogenic and thermogenic methane that was in part attributable to oil and
gas development...". Given the standard McAleer and (apparently) Louis use for accusations of dishonesty, the failure to mention that case by either demonstrates them both to be liars. Perhaps Louis was merely ignorant.Including the example of Sherry Vargsson (22 minutes in) featured in the video I posted above, that gives two clear examples of groundwater contamination with methane as a result of fracking operations. Further, it is quite possible that the two biogenic cases had no or limited methane in their gas prior to fracking operations. Presumably they at least claimed that to Fox (certainly Fox claims so, another apparently "not relevant" Louis neglects to mention).
Speaking of missing important details, in Fracknation McAleer says to Fox, "You have said yourself, people have lit their water long before fracking started." (2:41) To that, Fox replied, "Yes, but it is not relevant."
LuisC presents this case by stating:
"At least some of the residents in the town straight up agreed that gas was coming out of faucets well before the company had any operations in the area. This was not mentioned in Gasland, which left the viewer with the impression that the flammable gas was being released because of fracking. When asked about this very issue by McAleer in a seminar, Fox replied that ''it's true, but it's no relevant''. I would be interested to know how he maintains that it's ''not relevant'', when indeed many people have been left with the impression that gas coming out of faucets is something new under the sun and that fracking is to blame."
Check the wording. Fox was not asked about "this very issue". The example Fox mentions and agrees to comes from New York, not Colorado. McAleer had mentioned a 1976 report for Colorado but Fox does not indicate he has read it. Nor are we told why Fox thinks reports of earlier instances are not relevant. Although clearly from the video he has more to say, he is cut of once McAleer has his sound bite, and McAleer continues with his rhetorical voice over.
One thing I have noticed in watching excerpts of McAleer's video is a blanket refusal to question industry claims. Worse, when reporting on a successful campaign to prevent fracking in the Delaware basin, he reports it as a case of remote bureacrats "depriving farmers of their livelihood". Now I'll grant the decision deprived some farmer of a potential revenue stream, but McAleer is claiming that the decision will prevent the farmers from making a living - that in fact farming on their farms will not earn them a livelihood.
The bias is overwhelming. But then, what did we expect?
-
Glenn Tamblyn at 13:26 PM on 14 October 2014CO2 effect is saturated
Bob
Interesting reference. Unfortunately the graphs cover different parts of the spectrum.
Fig 1 is for CO2, smack bang in the center of its absorption curve. And it shows just how big a factor line-broadening is.
Also it answers the important question of absorption path length, at least near the peak. The upper graph in Fig 1 is essentially sea level pressure. Right at the peak at 667.5 cm-1 there is only about 3% transmission - 97% absorption - after 1 meters. After even 10 meters that would be 0.0310 or 0.000000000000059049%
Even just at 667.0cm-1 there is about 83% transmission - 17% absorption - after 1 meters. So about 15.5% transmitted after 10 meters and it takes around 170 meters to match the absorption at the peak.
Fig 2 actually cuts off the peak absorption region for CO2 on the far right just as it has dropped to maximum absorption.
Fig 3 is centered near the peak of the Ozone absorption, with only a modest role for CO2 there.
Referring to the opening equation - 7.1 - the Spectral Intensity S of CO2 is one of the key factors here. The other factor, the function f() covers line broadening etc and is where a lot of the complexities are.
This is a graph of the value of S for CO2 over much of its key absorption band, taken from the HITRAN database using the website spectralcalc.com

Notice the vertical scale is logarithmic. There is a roughly 6 orders of magnitude difference between the height of the peaks at the center and the peaks at the edges. Those are the wings.
-
Bob Loblaw at 11:23 AM on 14 October 2014CO2 effect is saturated
KR:
I did find a set of lecture notes at this link. Figure 7.3 seems to suggest that even at the peak absorption bands you see a few percent of IR reaching 13km altitude from the surface, but that graph is at higher wave numbers (lower wavelengths) than the most active IR absoprtion bands. Figure 7.2 is a much lower resolution, but does show the greatly-increased absorption by CO2 as you move out into the longer wavelengths.
-
Bob Loblaw at 11:08 AM on 14 October 2014CO2 effect is saturated
KR:
You prompted me to dig out my copy of Pierrehumbert's Principles of Planetary Climate, but unfortunately his graphs of CO2 absorption coefficients are in units of m2/kg and there is no easy conversion to simple units of length. Too much math for an evening at home at the end of a long weekend.
...but, to read the reference you linked to, what I find there is a series of calculations ultimately based on density, which appear to estimate how much of the volume of air is occupied by CO2. This is used to calculate the "mean free path length of quantum/waves in the atmosphere before colliding with a molecule of carbon dioxide".
What I do not see there is any discussion of how often a "collision" [and I use that term loosely] actually leads to absorption. Nor do I see any indication that the calculation takes wavelength into acount, which is a huge factor in absorption. (CO2 only absorbs at selected wavelengths.)
I suspect, but have not done the math to confirm, that if you repeated the calculation for nitrogen (much more prevalent in the atmosphere) that you'd get an even shorter "mean free path length" for N2 - but we know that N2 does not absorb IR strongly. He does seem to think that "molecules of water vapor and solid particles" in the atmosphere are much more important, basically because photons will run into them first.
In other words, I think the 33m that he comes up with has absolutely nothing to do with how far a typical IR photon travels in the atmosphere before being absorbed by CO2. We do know that photons outside the CO2 absorption wavelengths will go a lot further than ones at the appropriate CO2 wavelengths, and his calculations do not identify that.
Oddly, even though he calculates a "mean free path length" much shorter than I would expect for the distance before IR absorption, he also uses this to conclude that CO2 is not a greenhouse gas. This conclusion appears to be due to the speed with which an IR photon can escape the atmosphere.
Overall, I think his math is just a bunch of technobabble that amounts to an argument that trace gases can't be radiatively active. It's an odd flavour of CO2 is just a trace gas.
Rob:
Not just a Professor, but a "Scientific Research Director". Unfortunately, if I try a Google search for "Biology Cabinet Division Mexico" - his stated location. I only seem to find links to other copies of his paper at the usual denial web sites. He's a legend in his own mind.
-
michael sweet at 11:02 AM on 14 October 20142013 SkS Weekly News Roundup #27B
Louis,
From your post I understand that you have seen an industry reply to a documentary that was nominated for an Oscar as best documentary. You claim "scientific studies" have shown something but you provide only a citation to the industry propaganda. Perhaps you can support your claims with some data besides industry propaganda?
You have been provided undisputable evidence about earthquakes. There is widespread data concerning pollution of drinking water by fracking. Your tale of cancer is different from the one on Wikkipedia, perhaps you need to cite your source so we can see if it holds water.
It seems to me that Fox has better to do than to reply to this propaganda. No-one at SkS has felt it interesting to write an article about it. It seems off topic for this site to me.
-
jja at 08:02 AM on 14 October 2014Dinner with global warming contrarians, disaster for dessert
Recent research has suggested that the lower climate sensitivity estimates preferred by Curry, Lewis, and other contrarians are likely incorrect because they fail to account for different efficiencies of different climate influences, and underestimate the amount of global warming in the oceans.
Can we have a frank discussion about this paper? I have run a few comparisons using Nuccitelli et. al. 2013 data set and have found that this reanalysis of southern hemisphere ocean heat radically changes things. On the high end, it shows a 30% increase in Top of Atmosphere energy imbalance. http://oi59.tinypic.com/2ykax6a.jpg (green line is bets fit slope of Nuccitelli curve with projections going forward).
This reanalysis shows that the current TOA is closer to .9 Wm^-2. It also indicates that, while the northern hemisphere values appear to be correct, this likely indicates that NH Aerosols are significantly understated as well, possibly by a factor of 2.
If the energy accumulation raties continue along the best-fit curve then we are going to be experiencing catastrophic heat accumulation rates in only a few decades.
http://oi62.tinypic.com/289fyuw.jpg
This not only makes lower ECS and TCR values unlikely (impossible) but also shifts the most likely value up by 20% or more (3.6C vs 3) and the Fat tail is even fatter with a potential ECS of 8C.
Am I reading this wrong?Moderator Response:[PS] Fixed link
-
Rob Honeycutt at 08:00 AM on 14 October 2014CO2 effect is saturated
Bob... Thanks. That makes sense to me. I figured that Jonathan had essentially tripped himself up with his insistance on using the fog metaphor. He makes that error very early in the video and essentially continues off in that direction for the rest of the 20+ minutes.
KR... Yup. He's a CO2 as a GHG denier, and a college professor as well.
-
LuisC at 07:50 AM on 14 October 20142013 SkS Weekly News Roundup #27B
Hi Michael Sweet and Tom Curtis,
thank you for your responses. There are a few issues to sort out here:
My source for doubting the claims made in ''Gasland'' is the documentary ''Fracknation'', by Phelim McAleer. While we may rightfully doubt whether someone who has in the past been funded by the energy industry will present us with all the relevant facts, there were enough counter-claims made in the documentary to make me think that Gasland fell severely below the mark in terms of presenting all the relevant facts as well. For example:
- the people in the town focused upon in Gasland seem to mainly be in favour of the gas company's operations when asked by McAleer (they were also furious at their town being reduced to something of a caricature in the media, and many were against the construction of a water pipeline to bring clean water to the town, given that they themselves thought it was already clean). At least some of the residents in the town straight up agreed that gas was coming out of faucets well before the company had any operations in the area. This was not mentioned in Gasland, which left the viewer with the impression that the flammable gas was being released because of fracking. When asked about this very issue by McAleer in a seminar, Fox replied that ''it's true, but it's no relevant''. I would be interested to know how he maintains that it's ''not relevant'', when indeed many people have been left with the impression that gas coming out of faucets is something new under the sun and that fracking is to blame.
- the couple, mentioned in both documentaries, who filed a lawsuit against the gas company rejected the EPA's own results for water contamination when the results showed that there was no significant contamination from fracking. The EPA released footage of the couple being presented with the results; they replied by flying off the handle, denouncing the EPA as peddlers of ''bullshit'' and hurling accusations of ''what happened to you guys?'', and (in the case of the wife) essentially threatening McAleer with physical violence. I'm not accusing the couple of deliberate lying, but there seems to be, at the very least, a problem of circular reasoning here: the couple will only accept results that conform to their opinion. I mention their emotional response only to emphasize that science doesn't work by emotion or circular reasoning, but through the testing of assumptions. In the case of contamination of water in the town, the assumptions were clearly unfounded, which undercuts a key claim relies upon by Fox.
- many farmers are in favour of fracking, due to the revenue it brings, which in turn allows them to stay in business. It also makes sense to me that farmers, whose entire livelihoods and in many cases heritage is based upon using the land (and indeed, maintaining the health of the land) would never grant permission to a company to drill under their land if there was a serious threat of contamination of ground water. This suggests to me that fracking is not significantly more dangerous than other methods of extracting natural gas when it comes to water contamination, even if, like those other methods, it still carries risks.
- Fox claimed in Gasland that a region (or city) of the US had experienced greatly elevated levels of cancer from fracking. This turned out to be flatly incorrect and contradicted by a scientific study which found no evidence of this.
Now, it's possible that Phelim McAleer, for his part, had extrapolated too much from his focus upon the particular claims made in Gasland and had sidelined cases in other localities where fracking has been shown to be a danger, but this doesn't mean that the particular claims made in Gasland about the aforementioned localities and people have been scientifically verified. This is why I asked if Fox has issued a rebuttal against his critics, since Fox was basing his claims about fracking largely upon the cases he looked at in his documentary. As for the claim that this would be ''a waste of time'': isn't this very website about rebutting the claims of climate change deniers? Would you say that this website is a waste of time? Personally, I find it to be an invaluable source of information, which, if nothing else, provides me with the scientific community's view on the matter (just as ''TalkOrigins'' provides me with the scientific community's view on evolution against creationist claims).
Furthermore, many people who are genuinely interested in getting to the truth of the matter would want Fox to tackle the claims made in Fracknation. Even if ''new data'', as you say, has ''proven him correct'', this might apply to cases other than those he looked at. If fracking poses a danger in Oklahoma, for example, this doesn't mean that it poses a danger in the places Fox focused on. Thus, a blanket condemnation of fracking seems inappropriate based upon the cases Fox focused on. Finally, if certain claims are incorrect and are disseminated by those who care about the environment, this only ends up assisting those who don't care about the environment, for the latter can then latch on to these cases to ''prove'' that ''environmentalists don't care about the truth''. We must always, without reservation, seek to uphold the highest standards of truth when making our claims. Anything less becomes a disservice to our side and a gift to the other side.
There's another, more general, point to be made. Fracking, being a method of extracting natural gas, might be dangerous but in a more round-about way than cancer, earthquakes and contamination. To the extent that fracking faciliates more extraction and the driving down of gas prices, it is of course facilating humanity's ''addiction'' to fossil fuels, and in this sense is dangerous. But this is different to the separate question of whether fracking is inherently more dangerous than other methods of natural gas extraction due to the risks it poses in terms of cancer and earthquakes. Even if it didn't do these things, it would still present a long-term threat to the environment through its system-wide impact on energy use. This is an issue that tends to be overlooked by focusing either too much on its particular dangers, or of trying to deny them. Not that these dangers should be overlooked, of course. I'm just wary of the possibility that these dangers might inadvertently serve as a distraction from a larger systemic issue. But anyway, I'm just putting my thoughts out here. -
CO2 effect is saturated
Ach, horrible reference in my last message - turns out the author is a denier of CO2 as a GHG, my apologies. He doesn't seem to understand what happens when there is a change in effective radiating altitude. Still, the path length discussion is reasonable.
-
CO2 effect is saturated
Bob Loblaw - Sorry if I wasn't specific enough, that's absorption at major GHG frequencies. There are plenty of atmospheric windows and lower sidebars of partial transmission, but for strongly absorbing frequencies CO2 has a mean sea level path length of ~33 meters or so.
IR gas analyzers, on the other hand, are generally less than a meter in any dimension :)
-
Bob Loblaw at 06:41 AM on 14 October 2014CO2 effect is saturated
KR @298:
Where do you get the "absorption of IR is effectively saturated near the ground at sea-level pressures, with the average absorption path length being quite short (in the order of meters)" statement from? Even at wavelengths were CO2 absorbs, my impression is that it can travel significant distances. IR spectromoetry is a common method of measuring atmospheric CO2 concentrations, and commerical sensors can handle up to 3000ppm, IIRC, suggesting that at 300-400ppm we're far short of "saturation".
-
Bob Loblaw at 06:30 AM on 14 October 2014CO2 effect is saturated
Oh, what a complex subject radiation transfer is...
First, I have not watched Jonathan's video. At 30 minutes long, a video is a very slow way of gaining an understanding. I'd rather read.
There is a similarity between atmospheric transfer of IR radiation and headlights in fog, but there are also significant differences.
First of all, photons travel in fairly straight lines. (We'll ignore refraction for now.) Photons passing through a medium (e.g. the atmosphere) can basically do three things:
- it can be transmitted - pass directly through, unaffected, continuing in the same direction,
- be absorbed, at which point the photon no longer exists and the energy is transformed into something else,
- be scattered, at which point we still have a photon of the same wavelength, but it is travelling in a different direction.
IR doesn't get scattered in the atmosphere - the wavelengths and molecular and particle sizes don't match up. It either is transmitted or absorbed. The ratio is expressed by Beer's Law, which is logarithmic. Over a given distance, if 10% is absorbed and 90% transmitted, then the next equal distance will absorb another 10% - but of the 90% that was transmitted - i.e., 0.1*0.9 = 9% of the original, not 10% of the original.
The transmitted amount after 2 units is 0.9*0.9 or 81%. Over N units of atmosphere, the transmitted amount passing through is 0.9^N - so after 10 units of "10% per unit" we get 35% transmission, not 0% (10*10%). At 50 units, we're now at 0.5% transmission.
Is the transmission "saturated" at 50 units? Some might say yes, because if we increase the absorption per unit to 15% (thus, transmission per unit = 85%, or 0.85), then at 50 units we see 0.03% transmission (0.85^50), but so what? We only had 0.5% before anyway... is there really any difference between 0.5% and 0.03%? If we look at what is going on at 10 units, however, 0.85^10 = 0.20 or 20%. At 10 units, we've dropped from 34% transmission to 20%. The concept of "saturation" is now dependent on where we are. What seemed "saturated" at 50 units doesn't quite look that way at 10 units.
In the case of transmission of IR from the surface to the top of the atmosphere, even if (at some wavelength where CO2 absorbs) there is next to no radiation reaching the top of atmosphere directly, adding CO2 can still affect how much reaches a lower altitude directly - i.e., the average distance travelled before absorption will decrease. Although almost nothing reaches 100km directly, the amount reaching 10 km may now only reach 9km, or 8km, or 7km...
Once absorbed, energy will be re-radiated as IR again, but the re-radiation happens in all directions. Half of that will be moving down, not up, and to get it out to space, it will have to be re-radiated several times. The more CO2, the more times it will be absorbed and re-radiated, and the more times that happens the less efficient it is and the warmer the surface must be. This is the basic greenhouse effect.
Now, back to lights in fog. Most of the light passing through fog will be either transmitted or scattered - not much is absorbed. The amount transmitted directly still follows Beer's Law, though. A lot of the scattered light still travels forward, but we'll be seeing it from other angles - not directly. We can "see" the lights as long as the amount of light transmitted directly is still greater than the amout we see that is being scattered by the fog. Once too much of the direct light is scattered, the headlights get "lost in the fog".
When we can't see the lights at 100m, we might say "the fog is saturated", but at 50m we can still see the lights. (Tom makes this point above.) If the fog gets heavier, the person at 100m can't tell the difference, but the person at 50m does - until she can't see the lights. Another person at 25m still does, though, and when the fog gets heavier and you can't see the lights at 25m, you still can at 12m, etc., etc. etc. Each observer is looking at exactly the same lights and atmosphere, so if only some of the observers are saying "it's saturated" and other aren't, then the concept of "saturation" is not actually a universal property of either the lights or the fog - it is something that tells us more about the observer's position than anything else. This is not a useful concept for radiation transfer.
Now, to compare IR to lights in fog, the big difference is absorption vs. scattering. But just as absorbed IR is re-radiated both up and down, the lights are scattered both forward and backwards. The observer standing 50m from the car will see the lights fade into the fog as it gets heavier, and the driver of the car will get more of the light shining back in their face as the fog gets heavier. What the driver sees in back-scatter is similar to IR "back-radiation". Even though the observer at 100m says "the fog is saturated", the driver can tell the fog is getting heavier. Just as the case with increasing atmospheric CO2: although the observer at the top of the atmosphere might be thinking "it's saturated", the surface can tell that the IR effect is increasing.
In another simliarity, although the viewer of the car can't see headlights at 100m, they do see light (let's do the thought experiment on a dark road at night). Brighter headlights won't help the viewer see the headlights, but the fog-light will increase. Just the same, as the earth's surface temperature increases, you still won't see direct IR loss to space, but the total IR transfer upwards can increase.
-
howardlee at 06:29 AM on 14 October 2014The long hot tail of global warming - new thinking on the Eocene greenhouse climate
Fairoakien - it all about the timescales.
The shortest limb of the shortest orbital wobble is about 10,000 years. Human-caused GW is just a couple of centuries - just 2-3% of that. Also, we are on a cooling part of the orbital cycle, not warming.
Orbital cycles modifying climate is not at all new, what is new is the precision of dating which allows detailed sedimentary records across the globe to be compared with greater precision than ever before. The new thinking in the articles I revewed is that even in the Eocene the orbital cycles are not special, which refocuses attention on other, non-orbital causes to turn a cooling climate into a warming climate.
Globally every year volcanoes (including undersea volcanoes) only emit about as much CO2 as a single state like Ohio or Michigan does. The combined volcanic output of CO2 averages at around 260 million tonnes per year compared to about 35 billion tonnes of human-produced CO2 annually. Even the major volcanic eruption of Mount Pinatubo in 1991 only produced about 50 million tonnes of CO2. Human CO2 emissions are equivalent to an extra 11,200 Kīlauea volcanoes or about 360 more mid-ocean ridges!
Large Igneous Provinces are in a league of their own,- see this post, but there hasn't been one for 16 million years.
The "GW" about 1100 years ago is a bit of a myth from old data. Newer, more precise measurements show that since the industrial era we have reversed 6,000 years of that natural orbital cooling in just a century. Contrary to the myth, the planet is hotter now than the Medieval Warm Period (AD 800-1300AD) or the Roman Warm Period (500BC to 400AD), or any time in the last 6,000 years. Even 6,000 years ago, during the “Mid Holocene Warm Period,” when a warmer climate was caused by the same orbital/insolation change that ended the last ice age, global temperatures were about the same as the 2000s.
-
CO2 effect is saturated
Rob Honeycutt - As I noted in a long ago comment here, you have to be very careful about reasoning from an analogy back towards a complex system that the analogy is trying to explain. In general the mapping from the complex system is only part of that system to one of the analogy relationships (forward mapping), and taking the analogy as 100% identity capable of outlining issues with the complex system (backward mapping) is an error. That's an incorrect use of analogy.
Far better to examine issues in the actual problem domain, as with the Myhre et al 1998 reference above - line by line radiative codes backed by detailed spectral data, later confirmed by satellite observations. Those are not amenable to nor contradicted by simple analogical reasoning and back of the envelope calculations.
-
howardlee at 05:23 AM on 14 October 2014The long hot tail of global warming - new thinking on the Eocene greenhouse climate
MA Rodger - the accelleration of the Indian Plate seems to have been due to the interaction with the Reunion-Deccan mantle plume which pushed the Indian plate faster for a while. The Indian lithosphere is indeed fairly thin probably due to it's encounter with the plume. The traps are the result of enormous flood basalt eruptions, in common with other traps like the Siberian Traps, which are also associated with abrupt climate change.
So the speed of motion is not due to the thin crust, but both are due to the interaction of the Indian Plate with the Reunion-Deccan Mantle Plume.
-
Fairoakien at 04:57 AM on 14 October 2014The long hot tail of global warming - new thinking on the Eocene greenhouse climate
How come when the GW skeptics indicated that GW could be caused by natural cause e.g. global tilt or wobble and by volcanic release of CO2 it was ridiculed. But now these are used as new science supporting GW.
I still would like to know what caused the GW of 1100 years ago. During that period the earth was about as hot as it was in 2000. The startof the most recent leveling off of global warmimh. See NOAA chart on earth and sea heat
-
cosmicomics at 04:45 AM on 14 October 2014How did the UK grid respond to losing a few nuclear reactors?
In comment 28 I wrote:
“The Danish Energy Agency recently found that onshore wind was the cheapest way for Denmark to generate additional electricity.”
A new EU report has reached a similar conclusion:
“Onshore wind is cheaper than coal, gas or nuclear energy when the costs of ‘external’ factors like air quality, human toxicity and climate change are taken into account, according to an EU analysis.
The report says that for every megawatt hour (MW/h) of electricity generated, onshore wind costs roughly €105 (£83) per MW/h, compared to gas and coal which can cost up to around €164 and €233 per MW/h, respectively.
Nuclear power, offshore wind and solar energy are all comparably inexpensive generators, at roughly €125 per MW/h.” -
Rob Honeycutt at 01:36 AM on 14 October 2014CO2 effect is saturated
I don't know if Tom or KR has watched Jonathan's video, but I think there's a bit of an issue in how he's approaching the questions he's bringing up. But I don't know enough of the detailed science to address it.
At one point, while reading through the SkS material above, he comes to a point where the author starts applying a metaphor for how radiative absorption operates. But then Jonathan skips that metaphor and applies his own metaphor, one where he likens visible light to IR and CO2 to fog. In other words, he's trying to think of radiative absorption as similar to car headlights in the fog.
-
MA Rodger at 01:27 AM on 14 October 2014The long hot tail of global warming - new thinking on the Eocene greenhouse climate
Concerning the speed of the Indian plate, it is known to have travelled far faster that the other fragments of Gondwanaland and also to be thinner than the other fragments of Gondwanaland. My understanding is that the speed being the result of the thin crust is widely accepted and that the Traps are the result of that thinning process. From what I can gather, the inferred thinning process being due to the mantle plume that broke Gondwanaland apart remains hypothesis.
-
CO2 effect is saturated
Jonathan Doolin - I think I see some of the issues here; the image you are referring to is, well, a bit misleading in presentation.
A more detailed graph shows not just the results of atmospheric absorption on incoming and outgoing radiation, in a more clear fashion shows what would be expected for an Earth without an atmosphere (at the same temperatures):

Here you can more clearly see the absorption ranges for water vapor and CO2 that result in the more detailed spectra Tom Curtis linked. And see clearly the range of IR reduced by the greenhouse effect.
Quite frankly, the rather cartoon representation in the graph you linked gives the (incorrect) impression that the colored band is the sum radiation, wholly unaffected by GHG absorption, when in reality that band region is a complex spectra of what's left after passing through an atmosphere containing those GHGs. I consider your graph less than useful as a result.
As noted here and elsewhere, absorption of IR is effectively saturated near the ground at sea-level pressures, with the average absorption path length being quite short (in the order of meters). The more telling altitude is, however, that of effective radiation (roughly where half the radiated IR escapes to space without reabsorption). And that altitude rises as GHG concentrations increase, to cooler altitudes (by the lapse rate) that will radiate less energy. IR escapes across the thermal blackbody spectral range - but at levels determined by the temperature of where it radiates.
If you want to play with the math, I would suggest both looking into the freely available copies of MODTRAN as well as reading Myhre et al 1998, where they used line-by-line radiation codes for multiple locations (you cannot get correct global results by looking at a single locations, such as the Barrow atmospheric column) to compute the effective direct forcing change for 2x CO2, which results in the simplified formula:
ΔF = 5.35*ln(C/C0)
-
howardlee at 23:56 PM on 13 October 2014The long hot tail of global warming - new thinking on the Eocene greenhouse climate
Hi Pluvial,
If I understand you correctly, you are suggesting that climate drives tectonics via glacially-controlled isostatic ‘pumping’ of the crust and mantle. It’s an intriguing idea, but as you yourself say, this is an unusual perspective, and not mainstream science. I’d have to research that idea more, but here are my immediate thoughts:
I’m not an expert on mantle dynamics, but I can visualize your concept and I can imagine it having perhaps some effect around regions experiencing strong and repeated isostatic loading as demonstrated in Scandinavia. Repeated depression/elevation of the lithosphere might conceivably contribute to delamination – but I’m no expert there. I’m not sure how important that effect can be, though, as we had active tectonics in ice-cap-free greenhouse eras like the Mesozoic and the Eocene.
Tectonics is driven by the convecting mantle and the sinking of cold, dense plate slabs in subduction zones, with slow upwelling of mantle displaced by that sinking material. The energy driving tectonics is radioactive decay and the cooling of the planet, transferring heat energy from the core and mantle, very slowly, through the crust and atmosphere to space. The energy is immense, but only a tiny portion of that energy ‘leaks’ from the geosphere to the climate system. So the direct thermal energy transfer from the geosphere to the climate is small, much smaller than the energy powering tectonics within the mantle and core.
But tectonics does not drive climate by a direct thermal process. The main long-term effect of tectonics on climate is through the delicate balance between silicate weathering removing CO2 (via mountain building and erosion) and volcanic production adding CO2 (principally subduction over millions of years).
You refer to climate change associated with India’s motion northwards. I think you are referring to the Deccan Traps eruptions at the end of the Cretaceous. Those eruptions were a class of eruption called “Large Igneous Provinces” (it is a bit misleading to call them volcanic because they are so much bigger than any volcano the Earth has seen in the last 16 million years). They did indeed trigger abrupt climate change which triggered a strong extinction event just before the impact that wiped out the dinosaurs. The North Atlantic Igneous province associated with the Eocene hothouse is also a LIP.
You suggest that glacially-controlled isostatic pumping pushed continents away from Antarctica. For me the timing doesn’t match and the plate motions don’t fit. The separation of Africa from Antarctica began in the Jurassic, when there was negligible ice cover on Antarctica. Australia/Tasmania and South America finally broke with Australia at the Eocene Oligocene transition again at a time when Antarctica was essentially free of ice. While the motions of Australia and Africa are northward, the motion of South America is westward. Also, during the Messinian Salinity Crisis, where there’s evidence of strong isostatic motion due to salt accumulation, continents did not move away from the locus of isostatic load (the Mediterranean), they continued to converge.
Your last point linking dams to seismicity is a well-researched topic. Basically all the crust is under stress all the time. When that stress exceeds the strength of the rock it breaks, causing tremors or earthquakes (leaving aside ductile failure for now). Increasing water pressure in groundwater can counteract the pressure keeping 2 sides of a fault locked, making it easier for the fault to move and cause a tremor. It’s the same physics that is associated with fracking. Isostatic unloading has indeed induced seismicity, as you suggest, for example in Scandinavia.
You raise an interesting idea, though, and the interaction of isostatic loading and plate tectonics makes sense, though I’m not sure it can be a driver so much as a localized modifier.
-
DSL at 23:01 PM on 13 October 2014CO2 effect is saturated
Evans & Puckrin 2006 might be helpful, Jonathan.
-
CBDunkerson at 21:43 PM on 13 October 20142013 SkS Weekly News Roundup #27B
The thing which always gets me about the fracking industry's desperate attempts to claim the technology doesn't cause earthquakes (or since that has now clearly been proven false, that it doesn't cause 'major' earthquakes) is that the 'earthquake causing' may be the only 'good' thing about fracking.
Yes, fracking causes thousands of small quakes. To me it seems very likely that those small quakes in turn contribute to shaking loose larger fault lines and triggering bigger quakes. However, that's all a good thing. Sooner or later faults will slip. Fracking causes them to do so sooner... which means less energy is built up and the quakes are smaller and with fewer aftershocks than they would have been eventually. We should be studying fracking as a potential future means of 'earthquake management'.
-
michael sweet at 19:57 PM on 13 October 2014CO2 effect is saturated
Tom,
Does it make a difference when the spectrum was measured over Barrow? I cannot do the calculation, but it strikes me that in the winter there would be a different amout of radiation lost to space than during the summer. In the tropics the radiation would be more constant, but might not give as clear a spectrum.
-
Tom Curtis at 16:44 PM on 13 October 20142013 SkS Weekly News Roundup #27B
scaddenp @6, given a moderately recent discussion on Yamal, I am easilly convinced that the methane is biogenic. As you note, however, that does not mean the increased groundwater contamination is not a result of fracking. Indeed, given timing and the effect of fracking on earth quakes it seems very plausible that fracking has caused faulting which connects the biogenic methane to the ground water.
-
Tom Curtis at 16:34 PM on 13 October 2014CO2 effect is saturated
Jonathan Doolin @294:
1) The formula you used is for wavelength. That is, for a graph with a constant scale per unit wavelength, it shows the point with the highest value by wavelength. For 320 K, I work out that wavelength to be 9 micrometers, which is equivalent to a wavenumber of 1100 cm-1. For a graph with a constant scale for units of frequency, however, you should use νmax = 5.879 x 10¹⁰ x T, or 18.8*10^12 Hertz. Converted into wavenumbers, that is 627 cm-1.
The reason for the difference is that one unit wavenumber corresponds to more units of wavelength at 627 cm-1 than at 1100 cm-1. Therefore the area shown under the graph at 627 cm-1 must be divided among more units wavelength. To retain the same area, it must show a correspondingly lower intensity per unit.
The graph you originally linked to does actually show a long tail over the 15 micrometer peak absorption band for CO2, so that the upper curve may not be a mistake per se. The red band, however, is deliberately drawn to exclude that peak even though it lies in the emission band and is fundamentally important. Further, by using a wavelength scale, the CO2 band is placed on the wings where it is hard to judge its impact. That impact will in fact be the same no matter whether you use a frequency or wavelength scale, and as can be seen on the frequency scale (wave number) is very important.
In any event, I do not believe Wein's law to be an approximation, but of necessity it takes different forms for frequency and wavelength.
2) I have not repeated your calculation for the Barrow figure, but it sounds like it is in the correct ball park.
Looking at the downward from space figure, you can see that in the absence of CO2 (and ignoring water vapour and clouds), the radiation to space around 666 cm-1 would follow the black body curve for 268 K, that is over the absorption band for CO2 it would have the same intensity as the downward radiation at the surface (or actually very slightly more). Therefore, the presence of CO2 at that location has a warming effect of, using your calculation, around 45 W/m^2. In fact, water vapour would create some of that warming because it does overlap, but at a lower and warme altitude. Consequently its effect in the absence of CO2 would be less than that of CO2. Therefore the warming effect of CO2 at that location at that time was probably closer to 20 W/m^2, and is impossible to calculate without a full fledged radiation model.
It is often noted that water vapour has a greater greenhouse effect than CO2. That, however, is because it has a lesser effect across a far wider band of frequencies. In the frequency in which CO2 is active, CO2 has the stronger effect. (Of course, water vapour only has any effect because the atmosphere is warm enough to evaporate, and without the warming contribution of CO2 that would not be the case, or almost entirely not the case. Therefore CO2 drives temperatures more than water vapour, even though it has the weaker greenhouse effect.)
-
Jonathan Doolin at 13:52 PM on 13 October 2014CO2 effect is saturated
Hello. I found the graphs from Barrow Alaska very helpful.
The graphs from Barrow make it seem that Carbon Dioxide operates like a blackbody in wavelengths near 15 micrometers (667/cm) and is transparent in (most) other wavelengths.
Looking up, in the 600/cm - 760/cm range, there is roughly 100 milliWatt's per (square meter • steradian • cm^-1). Looking down, there's only 50. There is a much higher photon count in that range looking up than there is looking down.I did a little calculation using these numbers; based on the units of the vertical and horizontal parts of the Barrow Alaska graph... I could draw a little rectangle 100 high and 150/cm wide.
This rectangle would have an area of 15,000 milliWatt per (square meter • steradian). I would multiply by the area of the entire sky in steradians, which is about 6.25. which comes out to about 93.75 Watts per square meter.
----The graph that I referenced was not directly from joannova, but was from comment #58 at http://joannenova.com.au/2010/02/4-carbon-dioxide-is-already-absorbing-almost-all-it-can/
which in turn comes from http://theresilientearth.com/?q=content/why-i-am-global-warming-skeptic
Except for the color, this seems identical to the graph here.
http://noconsensus.wordpress.com/2010/04/19/radiative-physics-yes-co2-does-create-warming/What has been changed is that the infrared spectrum of Earth has been added.
Wein's Law says that lambda_peak * Temperature = .0029 meter • Kelvin
But what temperature should you use? 290 Kelvin yields a peak wavelength around 10 micrometers. When I did this earlier today, I thought the resilientEarth graph was too far to the left... (Using a temperature near 325 Kelvin, perhaps--like the Sahara.) However, the Sahara graph has a peak elsewhere, I think... Is Wein's Law an approximation that doesn't work at these temperatures?
======
I worked a good portion of the morning making another video, but unfortunately the screen-capture program crashed. These weren't the only things I addressed but seemed worth mentioning.
Prev 660 661 662 663 664 665 666 667 668 669 670 671 672 673 674 675 Next


