


 Arguments


Recent Comments
Prev 661 662 663 664 665 666 667 668 669 670 671 672 673 674 675 676 Next
Comments 33401 to 33450:
-
scaddenp at 13:26 PM on 13 October 20142013 SkS Weekly News Roundup #27B
Tom, I havent followed this closely but I am pretty sure studies showed the gas was biogenic and not from fracking. This doesnt of course rule out the possibility that engineering associated with fracking hasnt created disturbanced biogenic sources. It does show more caution is needed in determining causes.
-
Tom Curtis at 12:39 PM on 13 October 20142013 SkS Weekly News Roundup #27B
Of particular interest is the bit at the end in which the lady notes that prior to fracking in the region, methane concentrations in the water were very low. To be very clear, it is possible for methane to enter groundwater naturally, and end up in water systems as a result. That has happened before prior to fracking. However, the argument that because it has happened before without fracking, the more recent occurences which are more frequent near fracking sites and where groundwater contamination prior to fracking was low cannot be due to fracking is a straight forward fallacy.
Re earthquakes:


According to the USGS:
"USGS statistically analyzed the recent earthquake rate changes and found that they do not seem to be due to typical, random fluctuations in natural seismicity rates. Significant changes in both the background rate of events and earthquake triggers needed to have occurred in order to explain the increases in seismicity, which is not typically observed when modeling natural earthquakes.
The analysis suggests that a likely contributing factor to the increase in earthquakes is triggering by wastewater injected into deep geologic formations. This phenomenon is known as injection-induced seismicity, which has been documented for nearly half a century, with new cases identified recently in Arkansas, Ohio, Texas and Colorado. A recent publication by the USGS suggests that a magnitude 5.0 foreshock to the 2011 Prague, Okla., earthquake was human-induced by fluid injection; that earthquake may have then triggered the mainshock and its aftershocks. OGS studies also indicate that some of the earthquakes in Oklahoma are due to fluid injection. The OGS and USGS continue to study the Prague earthquake sequence in relation to nearby injection activities."
It should be noted that fluid injection can only cause earthquakes where there are stress points along fault lines. The quakes relieve that stress. Therefore the very high rate of earthquakes is probably due to facking, but after an unknown number of years the rate will probably fall again, possibly to below the pre-fracking level. That does not make the recent upsurge in earthquakes a good thing, but the growth in earthquake numbers is not simply pojectable into the future, even with continued fracking.
-
Tom Curtis at 11:57 AM on 13 October 2014Volcanoes emit more CO2 than humans
LuisC @262, cooler water absorbs more CO2 than warmer water. That is why soft drinks give of CO2 as they warm. The volcanic cooling due to aerosols sufficiently cools the surface ocean that the oceans absorb more CO2 than the volcanoes emit. Consequently the statement you quote is typically true. (Coincidence of a strong El Nino with a volcano can cancel this effect.)
While the statement is true and does emphasize the small amount of total volcanic emissions, not to much should be read into it. In particular, as the ocean warms with the passing of the volcanic aerosols, the excess CO2 emited by the volcano will be outgassed by the warming oceans (or at least, 55% of it will, as with human emissions). Therefore the volcanic cooling has no long term effect. The volcanic emissions, particularly those of a single volcano remain small in annual terms relative to anthropogenic emissions.
-
michael sweet at 10:23 AM on 13 October 20142013 SkS Weekly News Roundup #27B
Linus,
Googling "Oklahoma Earthquakes" yields this:
"4 earthquakes today35 earthquakes in the past 7 days131 earthquakes in the past month1,125 earthquakes in the past year"
They didn't have earthquakes before fracking. Many of the chemicals they use are known carcinogens (they keep the formulas secret partially for that reason) and there have been many recent news articles one of many (Business News of Dallas) about contaminated water. Perhaps you should google your key words and see what you find. Where did you hear these false claims? Why did you believe them?
I doubt Josh Fox has responded to his critics, it is a waste of time. The new data releases have proved him correct. Much of this data was hidden before his documentary.
-
CBDunkerson at 09:45 AM on 13 October 20142014 SkS Weekly News Roundup #41B
Mike: It isn't so much that people are 'ruling out' effective CCS as that it doesn't exist. Similarly, no one is 'ruling out' cold fusion, cheap fission power, or any other hypothetical future development. However, until these things are actually developed and utilized there isn't any point factoring them in to analyses. There are billions of things that might happen. Most of them won't.
-
Joel_Huberman at 09:42 AM on 13 October 20142014 SkS Weekly News Roundup #41B
Speaking of typoes, "epergy" in the first headline should be corrected to "energy".
-
LuisC at 08:15 AM on 13 October 20142013 SkS Weekly News Roundup #27B
Haven't Josh Fox's particular claims about fracking (eg. that it ''causes cancer'' and ''earthquakes'', and that it ''contaminates water''), as expouded in his documentary ''Gasland'', been severely criticized and called into question by the testimony of the very community he was focusing on, as well as the EPA and the scientific community itself? Has he responded to the points raised by his critics? I would be very interested in reading his response.
Moderator Response:[PS] Much better. :-)
-
wili at 06:31 AM on 13 October 20142014 SkS Weekly News Roundup #41B
The CC headline: "The $9.7 tillion problem: Cyclones and climate change" should read 'trillion.'
Recall that coal does other ecological damage than just CO2 emissions. In any case, CCS remains elusive. We've been hearing about its promise for about 20 years, yet there are only one or two plants in the world doing it seriously so far, iirc.
Burning coal must be seen as equivalent to atmospheric testing of nuclear weapons--something to be avoided for all concerned.Moderator Response:[JH] Typo corrected. Thank you.
-
LuisC at 05:29 AM on 13 October 20142013 SkS Weekly News Roundup #27B
Isn't Josh Fox a demonstrated liar?
Moderator Response:[PS] Please read and conform to the comments policy. (eg No accusations of deception.)
-
LuisC at 05:25 AM on 13 October 2014Volcanoes emit more CO2 than humans
This sentence doesn't seem to make any sense:
''In fact, the rate of change of CO2 levels actually drops slightly after a volcanic eruption, possibly due to the cooling effect of aerosols.''
Shouldn't that read ''...the rate of temperature increase actually drops slightly after a volcanic eruption, possibly due to the cooling effect of aerosols.''? -
scaddenp at 04:42 AM on 13 October 20142014 SkS Weekly News Roundup #41B
Jimb. The no. one issue for CO2 reduction is eliminating coal power stations. We have enough coal to seriously damage climate - much more so than oil. I dont think there is any CCS promoter that thinks CCS is "the answer". The issues with it are large, but there is also a lot of work going into solving them. There is absolutely no doubt that CCS makes energy generation more expensive. So do carbon taxes and similar schemes. If the problems can be solved, then there may well be situations where coal + CCS is a more economic solution then any other alternative. With appropriate costing of CO2, you can let the market make that decision.
-
DSL at 04:39 AM on 13 October 20142014 SkS Weekly News Roundup #41B
GIS L-OTI for September is out: .77C. The warmest September on record and the 7th warmest month in the record. 2014 is now just a smidgen below 2010 and 2005 for warmest year. August/September MEI = .500.
-
jimb at 02:56 AM on 13 October 20142014 SkS Weekly News Roundup #41B
CCS is still an idea in search of money.Even if CCS is deployed widely, it cannot capture CO2 from fossil fuel dependant things such as cars, trucks, trains, airplanes ships, home heating systems etc. How long are you willing to wait for the role of CCS to be less 'uncertain'?
-
What's the role of the deep ocean in global warming? Climate contrarians get this wrong
#1 StBarnabas:
Good point!
I used this water density calculator to create the graph below showing how one kilogram of sea water expands with temperature. Note that the expansion per °C of warming doubles from 0°C to 5°C and nearly doubles again from 5°C to 15°C.
I wonder if the nearly constant sea level rise the last two decades despite increased melting of land ice can partly be explained by this difference in thermal expansion. If some of the ocean heat uptake during the last 20 years has shifted from the shallow and warm parts to the deeper and colder parts this would reduce the total thermal expansion even if the total heat flux into the oceans remained the same. (not all Joules of OHC is equal!) This reduced thermal expansion may have offset the increased sea level rise from melting ice sheets, but that situation won’t last. Either changes in the ocean circulation will lead to more upper ocean warming again, or increased melting of land ice will overwhelm the reduced thermal expansion and accelerate the sea level rise.
-
Mike3267 at 00:41 AM on 13 October 20142014 SkS Weekly News Roundup #41B
It is not necessarly the case that we "need to phase out fossil fuels," as stated in the opening sentence of the first story above. The need is to phase out GHG emissions, especially CO2. What role CCS will play is this is uncertain, but climate activists should be warry of alienating people needlessly.
-
Christopher Gyles at 07:02 AM on 12 October 2014What's the role of the deep ocean in global warming? Climate contrarians get this wrong
Okay, the "deep" ocean and the "abyssal" ocean are the same thing--but is the "deeep" ocean even deeeper than that? :)
Rob Painting @ 4
Looking forward to the three-tiered rebuttal.
-
cosmicomics at 06:59 AM on 12 October 2014How did the UK grid respond to losing a few nuclear reactors?
michael sweet
The new Swedish government was formed on 2 October. It's a minority government consisting of Socialdemokraterna (S) and Miljöpartiet (MP), the environmentalist party. The decision concerning nuclear power isn't directly to close the plants, but to make demands that will affect the profitability of some of the oldest plants, thereby causing them to close down.
(I stedet for konkret at gå efter lukning af bestemte reaktorer kommer energiaftalens øgede sikkerhedskrav og forhøjede kerneaffaldsafgift fra 2,2 til 3,8 øre pr. kilowatttime ifølge Miljøpartiet til at betyde, at de fire ældste reaktorer lukker.)A spokesman for MP said that a parliamentary majority wouldn't be hard to find.
(Det bliver ikke svært at finde flertal for det i Riksdagen, fortæller Miljøpartiets talerør, Åsa Romson.)The aim is to increase last year's renewable production of 18 TWh to 30 in 2020.
(S og MP er blevet enige om, at mindst 30 terawatttimer (TWh) el i 2020 skal komme fra vedvarende kilder. Sidste år var det 18 TWh, og det nuværende mål er 25 Twh.)
(Danish quotes from Knockout..., cited above.)In the French case the difference is that what before was intention has now become law.
-
michael sweet at 03:28 AM on 12 October 2014How did the UK grid respond to losing a few nuclear reactors?
Cosmicomics,
Thanks for the references. It appears France announced that they are pulling back on nuclear last June. I am surprised no one mentioned it before on this thread. They have undoubtedly considered their neighbors successes and failures with renewables and the nuclear build they are currently doing in Finland.
It looks like Sweden might be more of a political move The Greens wanted nuclear out as part of an agreement to join the government. Perhaps that could be reversed in the future if nuclear pans out.
-
Dikran Marsupial at 23:04 PM on 11 October 20142014 SkS Weekly Digest #36
Dr McKitrick wrote "instead I was aiming to measure how far back the hiatus apparently started."
his method clearly doesn't do that. Here is a plot of the RSS data, along with trend lines showing the trend over the whole period, and the trend over the last 26 years, which McKitrick claims to be "trendless" according to his test:
There doesn't seem any evidence whatsoever of any change in the rate of warming starting in 1988 (a decade later perhaps), and the trend since 1988 is almost exactly the same as the long term trend.
The problem is that Dr McKitrick simply doesn't understand that a failure to reject the null hypothesis does not mean that the null hypothesis is probably true, and never has done.
All Dr McKitrick needed to do to see this problem was to plot the data with the trendlines, and it is pretty hard to understand why he obviously failed to perform that basic sanity check before publishing a journal papers (although perhaps it explains the choice of journal).
-
cosmicomics at 21:56 PM on 11 October 2014How did the UK grid respond to losing a few nuclear reactors?
Re. Sweden:
Headline:
Knockout til svensk atomkraft: Nye reaktorer droppes, og gamle må lukke
(Swedish nuclear energy knockout: New reactors dropped, old ones to shut down)Headline:
Sverige overhaler Danmark på vindkraft i 2014
Sverige har færre, men større vindmøller og regner med at have mere kapacitet end Danmark, når året er omme.
(Swedish wind power to pass Denmark's in 2014
Sweden has fewer, but larger turbines, and expects to have more capacity than Denmark when the year is over)I haven't tried to find articles in English. The bit about Sweden passing Denmark would interest Danish readers, but probably not most others. Articles about the reductions in English could probably be found with appropriate search terms.
Re. France:
I heard the news on Danish radio yesterday, but here are some corroborating links: 1, 2, 3.
I hope the links work (first time I've tried to do it this way) and that you find the information useful.
-
KeefeandAmanda at 20:02 PM on 11 October 2014What's the role of the deep ocean in global warming? Climate contrarians get this wrong
I have some questions about the numbers that Greg Laden gave. He wrote [with my modifications for ascii text]:
"One of the key numbers is the energy imbalance where the ocean absorbs extra AGW produced heat. Energy imbalance is measured in terms of Watts per m^2. The present study yields a value of 0.72. A previous study reported 0.54. Other estimates have varied in this range. Llovel et al point out, however, that these differences may be due to differences in the ocean depth considered in each study and the time periods covered."
Before I ask these questions, I would like to quote what one named "BBD" said in the comments toward the end of the comments section at October 8, 2014 at 6:58 PM
for the article "A lot more heat is found in the ocean" posted Wed Oct 8 20154 at the site HotWhopper:
http://blog.hotwhopper.com/2014/10/a-lot-more-heat-is-found-in-ocean.html
Here is the quote from BBD's comment [with my modifications for ascii text]:
"...Nobody has claimed all of the extra heat has gone there although some of it obviously has. I hope you take the point, sloppy language here is encouraging sloppy thinking.
From Llovel14:
Therefore, we estimate the heat uptake by the upper 2,000m of the global ocean to be 0.72 +- 0.1 W m^2. Our estimate is slightly larger than the recently reported estimate of 0.54 +- 0.1 W m^2 for the upper 1,500 m layer computed over 2005-2010 and the estimate of 0.56 W m^2 for the 0-1,800 m layer over 2004-2011
The planetary energy imbalance is ~0.6 - 0.7W/m^2, so the OHU estimate in L14 would seem to account for all of it."
The first paragraph above seems to be a direct quote from the Llovel paper itself. The context of this comment above by BBD seems to be on Trenberth's "missing heat" that those who reject mainstream climate science say is still missing. But BBD seems to say that via the given numbers, seemingly directly from the Llovel paper itself, this paper more than closes the gap and so therefore there is no more "missing heat" problem.
My questions are mainly to those who have access to the paper itself:
Are Laden and BBD using the term "energy balance" differently or applied to different things? BBD says, "The planetary energy imbalance is ~0.6 - 0.7W/m^2" while Laden says, "Energy imbalance is measured in terms of Watts per m^2. The present study yields a value of 0.72." But the Llovel paper according to the above quote from the paper uses the term "heat uptake" for the 0.72 +- 0.1 W m^2 measure.
Also, BBD seems to say that since 0.72 is greater than the range ~0.6-0.7, Trenberth's "missing heat" is more than covered by the 0.72 +- 0.1 W m^2 heat uptake (as the paper puts it). Is BBD saying this and if so, is BBD right - does the Llovel paper do this and say this in this quote above from that paper?
Please, would someone with the requisite knowledge and access to the paper answer these questions and clear all this up? (And please feel free to include mathematically oriented information.)
Moderator Response:[PS] Fixed links
-
Andy Skuce at 19:04 PM on 11 October 2014What's the role of the deep ocean in global warming? Climate contrarians get this wrong
Smith@2
From the Llovel paper:
"Nevertheless, the ocean layers above 700 m and 2,000 m represent only 20% and 50%, respectively, of the total ocean volume."
-
Rob Painting at 14:58 PM on 11 October 2014What's the role of the deep ocean in global warming? Climate contrarians get this wrong
victorag - The uncertainty range in the Llovel paper is many times larger than their estimate, but from a physically-based perspective one has to wonder why, if the abyssal cooling trend is correct, geothermal warming in the abyssal ocean appears to stopped stone-cold dead. We would expect geothermal activity to be still be going on down in the very deepest parts of the ocean, as it's a component of the thermohaline circulation.
As for continued global warming (aka the pause):
And the remaining 1% which is warming the atmosphere:


The RSS satellite data appears to be the odd one out. We'll need more data to say for sure, but it looks like the atmosphere is still warming too, albeit at a slower rate than the previous two decades. SkS has a three-tiered rebuttal to this myth in the works.
That the climate models are remarkably close to the observed temperature trend over the recent decade, taking into consideration all relevant factors, is an explicit demonstration that we can get this temporary surface temperature slowdown even when the Earth's climate sensitivity is around 3°C per doubling of CO2.
As for climate policy, one needs to consider the ecological and agricultural impacts of warming and ocean acidification if one expects to be taken seriously.
-
victorag@verizon.net at 14:10 PM on 11 October 2014What's the role of the deep ocean in global warming? Climate contrarians get this wrong
I’ve recently completed a pretty serious blog post dealing with climate change, with reference especially to the new NASA report on the lack of deep sea warming discussed by Laden, which as I see it, could make a huge difference to the debate. And no, I’m not a “denier,” but a card carrying lifelong Democrat, liberal to the gills. I’d appreciate feedback from anyone reading here in the form of comments, positive or negative. http://amoleintheground.blogspot.com/2014/10/common-sense-on-climate-change.html
-
Tom Curtis at 09:09 AM on 11 October 2014CO2 effect is saturated
Further, and minor points:
1) Absorption is best specified by molar units. The reason is that the atmosphere becomes less dense as you rise, so that the number of moles in a vertical column that is a meter squared at the base decreases, (ie, absorption per meter decreases with altitude).
2) IR can only absorb or emit CO2 at very specific frequencies, based on the natural resonant frequency of the molecular bonds. That frequency of absorption is blurred by the motion of the particles. A CO2 molecule moving in the same direction of the light will see the light as being redshifted (longer wavelength) and will consequently be able to absorb light of a slightly shorter wavelength than would normally be the case. Likewise in reverse. The doppler effect broadens the effective bandwidth of IR light that can be absorbed.
Pressure broadening (and collisional) broadening also broadane the effective bandwidth, but the physics involved is above my pay scale.
3) You would probably find it instructive to play around with the Modtran model. (Instructions and source code) Modtran is a moderate resolution model of atmospheric transmission. The version in the public domain dates from the late 1980s to early 1990s, and is slightly inaccurate for exact calculation. It is, however, very informative about basic effects.
Science of Doom developed his own model along similar lines, describing the process and maths involved in his blog as he did so. Also very informative. There are two relevant series of blog posts.
-
Tom Curtis at 08:50 AM on 11 October 2014CO2 effect is saturated
Johnathan Doolin @289, to begin with, the graph you rely on from Jo Nova incorrectly shows the distribution of IR radiation from the Earth. To get a better idea of the distribution, here are three satellite observed spectra of outgoing IR radation:

Units of wavenumber may be unfamiliar to you. They are a measurement of frequency in terms of number of waves per cm. For ease of conversion, here is another satellite observed spectrum showing both wave numbers and wavelengths, this time from over Barrow in Alaska, and also showing a simultaneous downward spectrum at the Earth's surface:
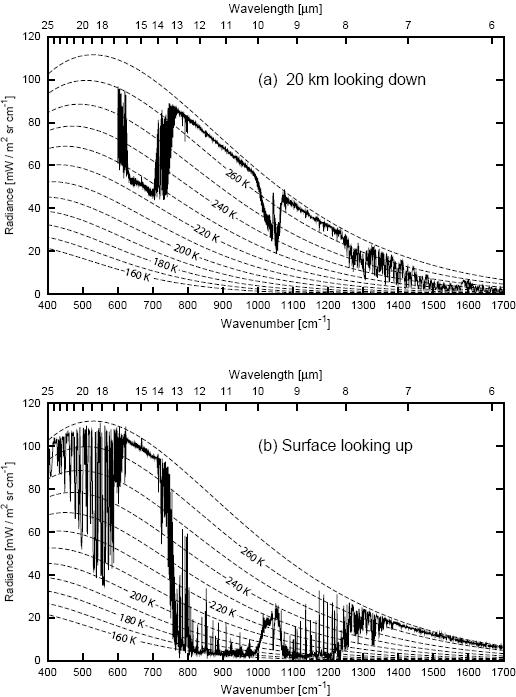
These graphs are drawn such that an equal area under the grap corresponds to an equal total power (in W/m^2) emitted to space at the top of the atmosphere (or in one instance at the bottom of the atmosphere to the Earth's surface). The large feature at about 666 cm-1 wave number, or 15 micrometers wavelength is the CO2 absorption/emission band. As you can see, it is displaced in the Jo Nova graph to suggest CO2 absorbs very little outgoing radiation - but from the actual observations above, it is evident that that displacement is (to be far kinder than she deserves) an error.
As an aside, all five graphs also show the blackbody curves at different temperatues. The "brightness temperature" is just the absorption spectrum rescaled at different wavelengths such that the black body curves form parralel lines with the x-axis. It is convenient for some purposes but not for others.
The most important fact shown in the graphs above is that at atmospheric temperatures, CO2 both absorbs and emits IR radiation at the same wavelengths. This can be seen in the top three images in the tiny spike of increased radiation from the point of greatest absorptivity by CO2. Because CO2 absorbs so efficiently at that wavelength, it also emits efficiently. More importantly, at that precise wavelength, most IR radiation as seen from space looking down comes from the stratosphere, which is warmer than the nearby troposphere, resulting in a peak in net emissions.
The emissions can also be seen (very obviously) in the downward spectrum at Barrow, where the near surface air is much warmer than the near tropospheric air. As a result, the emissions seen from space (which can see no further down than the upper troposphere) are very low and much lower than the nearby wavelengths without CO2 absorption where we can see down to the lower 4 kms of the troposphere (H2O band = 400-800 cm-1) or the surface ("atmospheric window" = 800-1000 cm-1), which being warmer emit more intensively. Seen from the surface, however, all emissions in the CO2 and H2O bands come from the lowest kilometer of the atmosphere and are much warmer than that from the neighbouring atmospheric window (where they effectively come from space).
Turning to your fog model, it contains three essential errors. First, at IR wavelengths, CO2 both absorbs and emits radiation. That is an important disanalogy to your headlights in the fog, for fog will absorb visible light, but not emit it. Second, early in the you define "saturation" in terms of whether or not headlights can be seen in the fog. You say, "If you can't see the headlights in front of you at all, that means the light is completely blocked." But, if you cannot see the headlights at all, then headlights at a shorter distance may well not be blocked. Absorption is a function of distance. Third, the theory of the greenhouse effect is a theory of radiative balance relative to space. You apply your assumptions from the perspective of light leaving the ground, but the proper perspective for the greenhouse effect is that of light escaping to space.
So, consider a hypothetical case in which a gas that absorbs equally in all frequencies. That gas will also emit as a black body, and hence emit according to its temperature. Supose also that the gas is thick enough in the atmosphere as to block all light from the surface. It cannot, however, at Earth's temperatures block all IR radiation, for it emits some. The higher in the atmosphere it is, the higher in the atmosphere from which it will emit so that while it may block all sight of the surface, it can never block all IR emission. So the question becomes, what is the lowest from which you can see an IR beacon on a satellite when looking up? Because from that same altitude, IR radiation emitted by that gas can escape to space. Looking from space, you will see a (very tiny) amount of IR radiation from that altitude, and more from higher levels. If that level is above the surface, the atmosphere is saturated, but that in no way prevents IR radiation from reaching space. It only prevents it from reaching it from the surface.
Suppose, that we take an atmosphere containing that gas, which is just saturated. You can just see the IR beacon from a km above the Earth's surface and from no lower. Now we double the concentration of the gas. It follows that the lowest altitude from which we can see the beacon will rise. Ergo, the IR escaping to space will come from a higher altitude. But, because temperatures fall with greater altitude, it will have a correspondingly less powerfull emission based on the Stefan Boltzmann law. As less energy is escaping to space, the result will be a build up in energy stored in the system until radiative balance is restored, ie, the temperature of the levels of the atmosphere from which IR radiation emitted to space rise to match those of the lower levels from which they previously were emitted.
-
nigelj at 08:28 AM on 11 October 2014GWPF funder Lord Leach – relying on unreliable sources of global warming information
I have heard these climate sceptic arguments many times, and it is obvious they are wrong after even a cursory look at the mainstream information. You do not even need a science degree to see the weaknesses. Intelligent people like Lord Leach must know the arguments are simply wrong.
So call it what it is. These people are simply liars and deliberate deceivers, prepared to lie because they value their libertarian beliefs more highly than the science.
-
DSL at 07:11 AM on 11 October 2014CO2 effect is saturated
Jonathan, you'll get a response here, but if you're actually interested in going through the maths, save some time by going to SoD.
-
Smith at 06:54 AM on 11 October 2014What's the role of the deep ocean in global warming? Climate contrarians get this wrong
Shallow ocean = 0-700 meters
Deep ocean = 700-2,000 meters
Abyss = > 2,000 meters
Are the relative volumes of the above depth categories know?
-
PluviAL at 06:36 AM on 11 October 2014The long hot tail of global warming - new thinking on the Eocene greenhouse climate
Wonderful summary, I think we are slowly coming around to a new perspective of the way the globe works. From my studies of atmospheric energy budgets, I come to a very unusual perspective, which this studies seem to support. I can't find the reference, but there is a paper showing that the acceleration of the Indian subcontinent into Asia was preceded by climate change.
Here is the unusual perspective: Tectonic plate motion is much easier to motivate with an energy source that is much larger than earth flux; climate. Solar flux onto earth is 3900 times larger. And the mechanics of GIA, glacial isostatic adjustment, transfer much greater, faster, and mechanically more viable energy impetus for tectonic plate movement.
In my mind I see Antarctica pumping with a potential of 60 petatons of energy, on the pulse of climate. In that model, waves from that action have piled the continental masses on the northern hemisphere.
Gravitation waves play nicely into the process too, but that is too detailed here. Although it may be farfetched, the mechanics are much more robust. If there is any truth to this at all, the seismicity implications within immediate human history may be substantial. Such volcanic reactions to climate with feedback mechanisms through carbon seem to be potentially valid. Even the 39 cubic kilometers of water in the Three Gorges Dam affected seismicity, how much seismicity can 72,000,000 km3, suddenly lifted cause?
-
Rob Honeycutt at 06:30 AM on 11 October 2014CO2 effect is saturated
Jonathan Doolin... Just want to get something clear first. You're going to throw your lot in with two computer science guys, who have no special training in any of the science that they're commenting on, over that of 30,000+ actively publishing climate researchers, and all the National Academies, and pretty much every scientific organization who has a statement on AGW.
Have I got that right?
-
Philip Shehan at 06:08 AM on 11 October 20142014 SkS Weekly Digest #36
I received the following reply from Ross McKitrick.
I note that I was incorrect in thinking that he was saying that the "pauses" were statistically significant, but I believe he has incorrectly concluded that when warming ceased to be statistically significant, the "pauses" begin, even though at this point the trends are still warming and the error margins have only just crossed thew zero line.
Dear Phil
I don't know why the UAH result is so different. I don't know what algorithm is used on the SKS website. Also there might have been revisions to the UAH data set since I accessed it.My calculations didn't aim to measure a statistically-significant trend in the neighbourhood of zero, instead I was aiming to measure how far back the hiatus apparently started.
Cheers,Dr. Ross McKitrick
- Professor of Economics and Chair of Graduate Studies
- CBE Fellow in Sustainable Commerce -
Jonathan Doolin at 05:31 AM on 11 October 2014CO2 effect is saturated
I was attracted to this particular article because I think that the causality case can be made most convincingly from the properties of the Carbon Dioxide molecule itself... especially its absorption spectrum.
I have got into the practice of screen-recording things as I learn it, so that three to six months from now when I have the opportunity to pick up where I left off, I might remember some of what I was thinking.Here is a short list of where I think I'm still confused.
•What is the meaning of "Brightness Temperature" Isn't brightness usually measured in Watts/meter^2?
•I didn't fully grasp how the "Pressure and Doppler Broadening" but that may have been for lack of time and effort...
• What I see, though, is that the absorption coefficient doesn't drop off instantaneously... I would think that any absorption coefficient below 1/(10 km) is going to be NOT saturated. I think maybe the problem involves a lot more detailed calculus though because in those 10 km to to the top of the troposphere, there are pretty massive changes in the density and pressure, wouldn't there?
•According to the graph at LINK (which I used in the video above) it appears that Carbon Dioxide absorbs about 2% or more of the light in a continuous spectrum from 1.5 micrometers to 30 micrometers.
Is that graph accurate? And if so, wouldn't you say that Carbon Dioxide does *not* saturate the spectrum in the wavelengths where it is absorbing 2% of the light?
Finally, have you thought about trying to put together some kind of quantifiable problem... Could you give a functional representation of the absorption coefficient of CO2, as a function of wavelength and concentration?
Then a representation of the power-distribution emitted by the surface of the earth, as a function of wavelength (Planck distribution, yes, I know)
Then a calculation of the heat capacity of the atmosphere at large, with 70% nitrogen, 29% oxygen, etc.
And maybe a description of whether heat flows at the boundaries of air and water, and between troposphere and stratosphere... What kind of models are used in predicting heat conduction between the layers. I guess convection between air and water is completely halted, since clearly the water doesn't flow into the air, and the air doesn't flow into the water... But what about conduction? Is the phase change just as dramatic between the troposphere and the stratosphere?Moderator Response:[RH] Hot linked urls.
-
michael sweet at 05:31 AM on 11 October 2014The Wall Street Journal downplays global warming risks once again
Judith Curry has an op-ed in the WSJ down playing the problem of AGW. It is paywalled so I could not see the date. I am sure Dana will have a reply soon.
-
michael sweet at 03:01 AM on 11 October 2014How did the UK grid respond to losing a few nuclear reactors?
Cosmicomics:
Can you provide links to these claims?
-
StBarnabas at 02:42 AM on 11 October 2014What's the role of the deep ocean in global warming? Climate contrarians get this wrong
The thermal expansion coefficient of water is very temperature dependent; warm water expands a lot more than cold for a given heat input, so this is very worrying and a double whammy so to speak. It's interesting that global sea level rise has been nearly constant at c 3mm per year for the past few decades. I worry that there will be a rapid acceleration sometime soon
-
cosmicomics at 01:38 AM on 11 October 2014How did the UK grid respond to losing a few nuclear reactors?
A few minutes ago I heard that the French government has decided to reduce France's consumption of electricity from nuclear power from 75% to 50%. At the same time, France will be reducing its consumption of fossil fuels.
Last week the new Swedish government announced policies that will lead to the shutdown of the aged reactors 1 and 2 at Oskarshamn, 1 and 2 at Ringhals, and stop Vattenfall's plans to build additional reactors there.
Sweden has been building up its renewable infrastructure, and this year the nameplate capacity of Swedish wind power will exceed Denmark's.
-
Hank11198 at 23:47 PM on 10 October 2014The Wall Street Journal downplays global warming risks once again
Tom I think I understand what you are saying. I need to go over it in detail ASAP. Thanks for you help.
-
billthefrog at 23:36 PM on 10 October 2014The long hot tail of global warming - new thinking on the Eocene greenhouse climate
Thanks for another illuminating and thought provoking post Howard.
You really know how to spoil somebody's day, don't you?
Cheers BIll F ;)
-
howardlee at 23:01 PM on 10 October 2014The long hot tail of global warming - new thinking on the Eocene greenhouse climate
Ianperrin - I addressed Wright and Schaller's study in this post (under 'timing matters' about half way down, and see comments at the end)
I think we can say for now that their study was refuted in a series of replies (towards the end of this page) on the basis of:- (a) the heat capacity of the oceans required centuries to warm to the PETM extent, (b) an instant release of carbon in the atmosphere would produce a carbon isotopic shift far larger than observed, and (c) that microfossils ruled out the sedimentary rates claimed. There was also a claim that the apparent varves were drilling artefacts but Wright and Schaller pointed out varve-like layers in land exposures of the same clay unit - so they can't be just drilling artefacts.
The Marlboro Clay that they studied will I'm sure provide valuable insight to the PETM, but as things stand more work is needed to bridge the apparently-varved clay record with the longer term but coarser-resolution records.
-
howardlee at 22:47 PM on 10 October 2014The long hot tail of global warming - new thinking on the Eocene greenhouse climate
Correction to the post above the ...rhythm IS recognized...
(not sure how 'not' got in there)
-
howardlee at 22:35 PM on 10 October 2014The long hot tail of global warming - new thinking on the Eocene greenhouse climate
Wili and WheelsOC - yes I meant beat as in heartbeat, sorry if that was confusing. The point is that this 100,000 year and 405,000 year rhythm is not recognized throughout most of the geological record, operating as an oscillation about a background climate state. In the Eocene the climate state was already hot so the orbital oscillations made hyperthermals.
-
ianperrin at 20:29 PM on 10 October 2014The long hot tail of global warming - new thinking on the Eocene greenhouse climate
How does this fit with the Wright and Schaller study of last year that has the PETM push occuring within just 13 years. Though at first it seems unlikely, the study has not been refuted as far as I know.
-
Tom Curtis at 12:20 PM on 10 October 2014The Wall Street Journal downplays global warming risks once again
Hank, your correspondent seems to be taking the view of the greenhouse effect I discussed @9 above, rather than Coonin's actual view. As such, the relevant figures are:
Total greenhouse effect c.1980: 150 W/m^2
CO2 contribution: 20% (30 W/m^2)
(Figures from Schmidt et al 2010)
CO2 concentration c 1980: 340 ppmv
Projected CO2 concentration for mid century with BAU (RCP 8.5): 550 ppmv
Relative forcing: 2.55 W/m^2
Change in CO2 forcing: 8.5%
Assuming that CO2 is responsible for 25% of the total greenhouse effect reduces that to 6.8%. Assuming the forcing change is from 2013 reduces it to 5.6%, or 4.5% assuming the 25% figure.
The only way to reduce it to the 1% figure is calculate it as a percentage of the total greenhouse effect, ignoring the anthropogenic increase over the last 33 years, and ignoring the increase in the total greenhouse effect from water vapour related feedbacks. That is, it requires first fudging the figures, and then making an apples to oranges comparison.
The scenario as described, by the way, deliberately excludes all other well mixed greenhouse gases from the equation; and is chosen to ignore the fact that we are not in temperature equilibrium, and that consequently temperature changes from past forcings (including prior to 1980) are still "in the pipeline".
-
wili at 10:13 AM on 10 October 2014The long hot tail of global warming - new thinking on the Eocene greenhouse climate
Doh! Of course you're right, Wheels. I missed the metaphor. But they do use that throughout, now that I look again.
-
Hank11198 at 08:21 AM on 10 October 2014The Wall Street Journal downplays global warming risks once again
First time post. Hope someone sees this and it not too late.
As an engineer I'm able to follow a lot of the math but not the details. Living in east texas I’m among a lot of deniers. Even other engineers who I would think would understand some basic science. Anyway a friend of mine often sends me articles that criticize climate change science and I try to respond but often don’t understand the details as I said. When I responded to his email he sent me regarding Noonin’s article using one of the comments here, he sent me the following reply.
He is dead on accurate Hank. Koonin said the HUMAN additions to atmospheric CO2 are expected to shift the greenhouse effect by only 1% to 2%. That is perfectly in agreement with the fact that the totality of CO2 in the atmosphere contributes 25% of the total greenhouse effect in the atmosphere. What he's saying is that the 25% is going to increase to be 26% to 27% by the middle of this century.
Your science sources are blooming idiots.”
I was hoping someone could help me with a reply because I don’t understand what that reply is talking about.
-
foolonthehill at 06:12 AM on 10 October 2014GWPF funder Lord Leach – relying on unreliable sources of global warming information
I quite like the image but they're not actually seals...
www.theguardian.com/environment/2014/oct/03/walrus-alaska-beach-climate-change-arctic-ice
-
WheelsOC at 05:32 AM on 10 October 2014The long hot tail of global warming - new thinking on the Eocene greenhouse climate
Pretty sure "beat" is the right word, referring to the rhythmic recurrence of the warming even though the suspected sources for it had dried up. Hence the term "heartbeat" after the block quote.
-
wili at 04:39 AM on 10 October 2014The long hot tail of global warming - new thinking on the Eocene greenhouse climate
In the second sentence after "New Thinking": " But Turner et al refute this, showing that the Hyperthermal beat continued long after reserves of methane hydrates and permafrost must have been emptied..."
"beat" should, presumably, be "heat." -
dklyer at 04:19 AM on 10 October 2014It's cooling
Simpleton here with a dumb question. This has probably been answered multiple times but I'm not finding any reference in the main posts. There are 6 long pages of comments that I haven’t read through.
Much has been made of the hiatus in warming. It seems like it is (at present) small compared to the cooling in the 40’s to 70’s. This seems apparent from your graph on the PDO post. I read that the cooling seen from the 40’s to the 70’s was due to aerosols from industrial pollution and volcanism (see New Scientist) and that the temperature began ramping up after clean air legislation in England and Europe followed by similar legislation in the US.
Is there any new data on aerosols from Asia and India and how those may be affecting global average temperatures? Is the aerosol affect still thought to be the main culprit in the post WWII dip? Didn’t I also read that the aerosols were thought to be a factor in shifting rainfall patterns that created multi-year drought conditions in North Africa? Are people looking at how aerosol pollution from Asia may be affecting the drought in the American Southwest?
Prev 661 662 663 664 665 666 667 668 669 670 671 672 673 674 675 676 Next


