


 Arguments


Recent Comments
Prev 666 667 668 669 670 671 672 673 674 675 676 677 678 679 680 681 Next
Comments 33651 to 33700:
-
Tom Curtis at 11:12 AM on 29 September 2014The Wall Street Journal downplays global warming risks once again
JoeT @37, first, for ease of discussion, here is the IPCC Fig 2.11 (which is discussed in Chapter 2 of IPCC AR5 WG1:
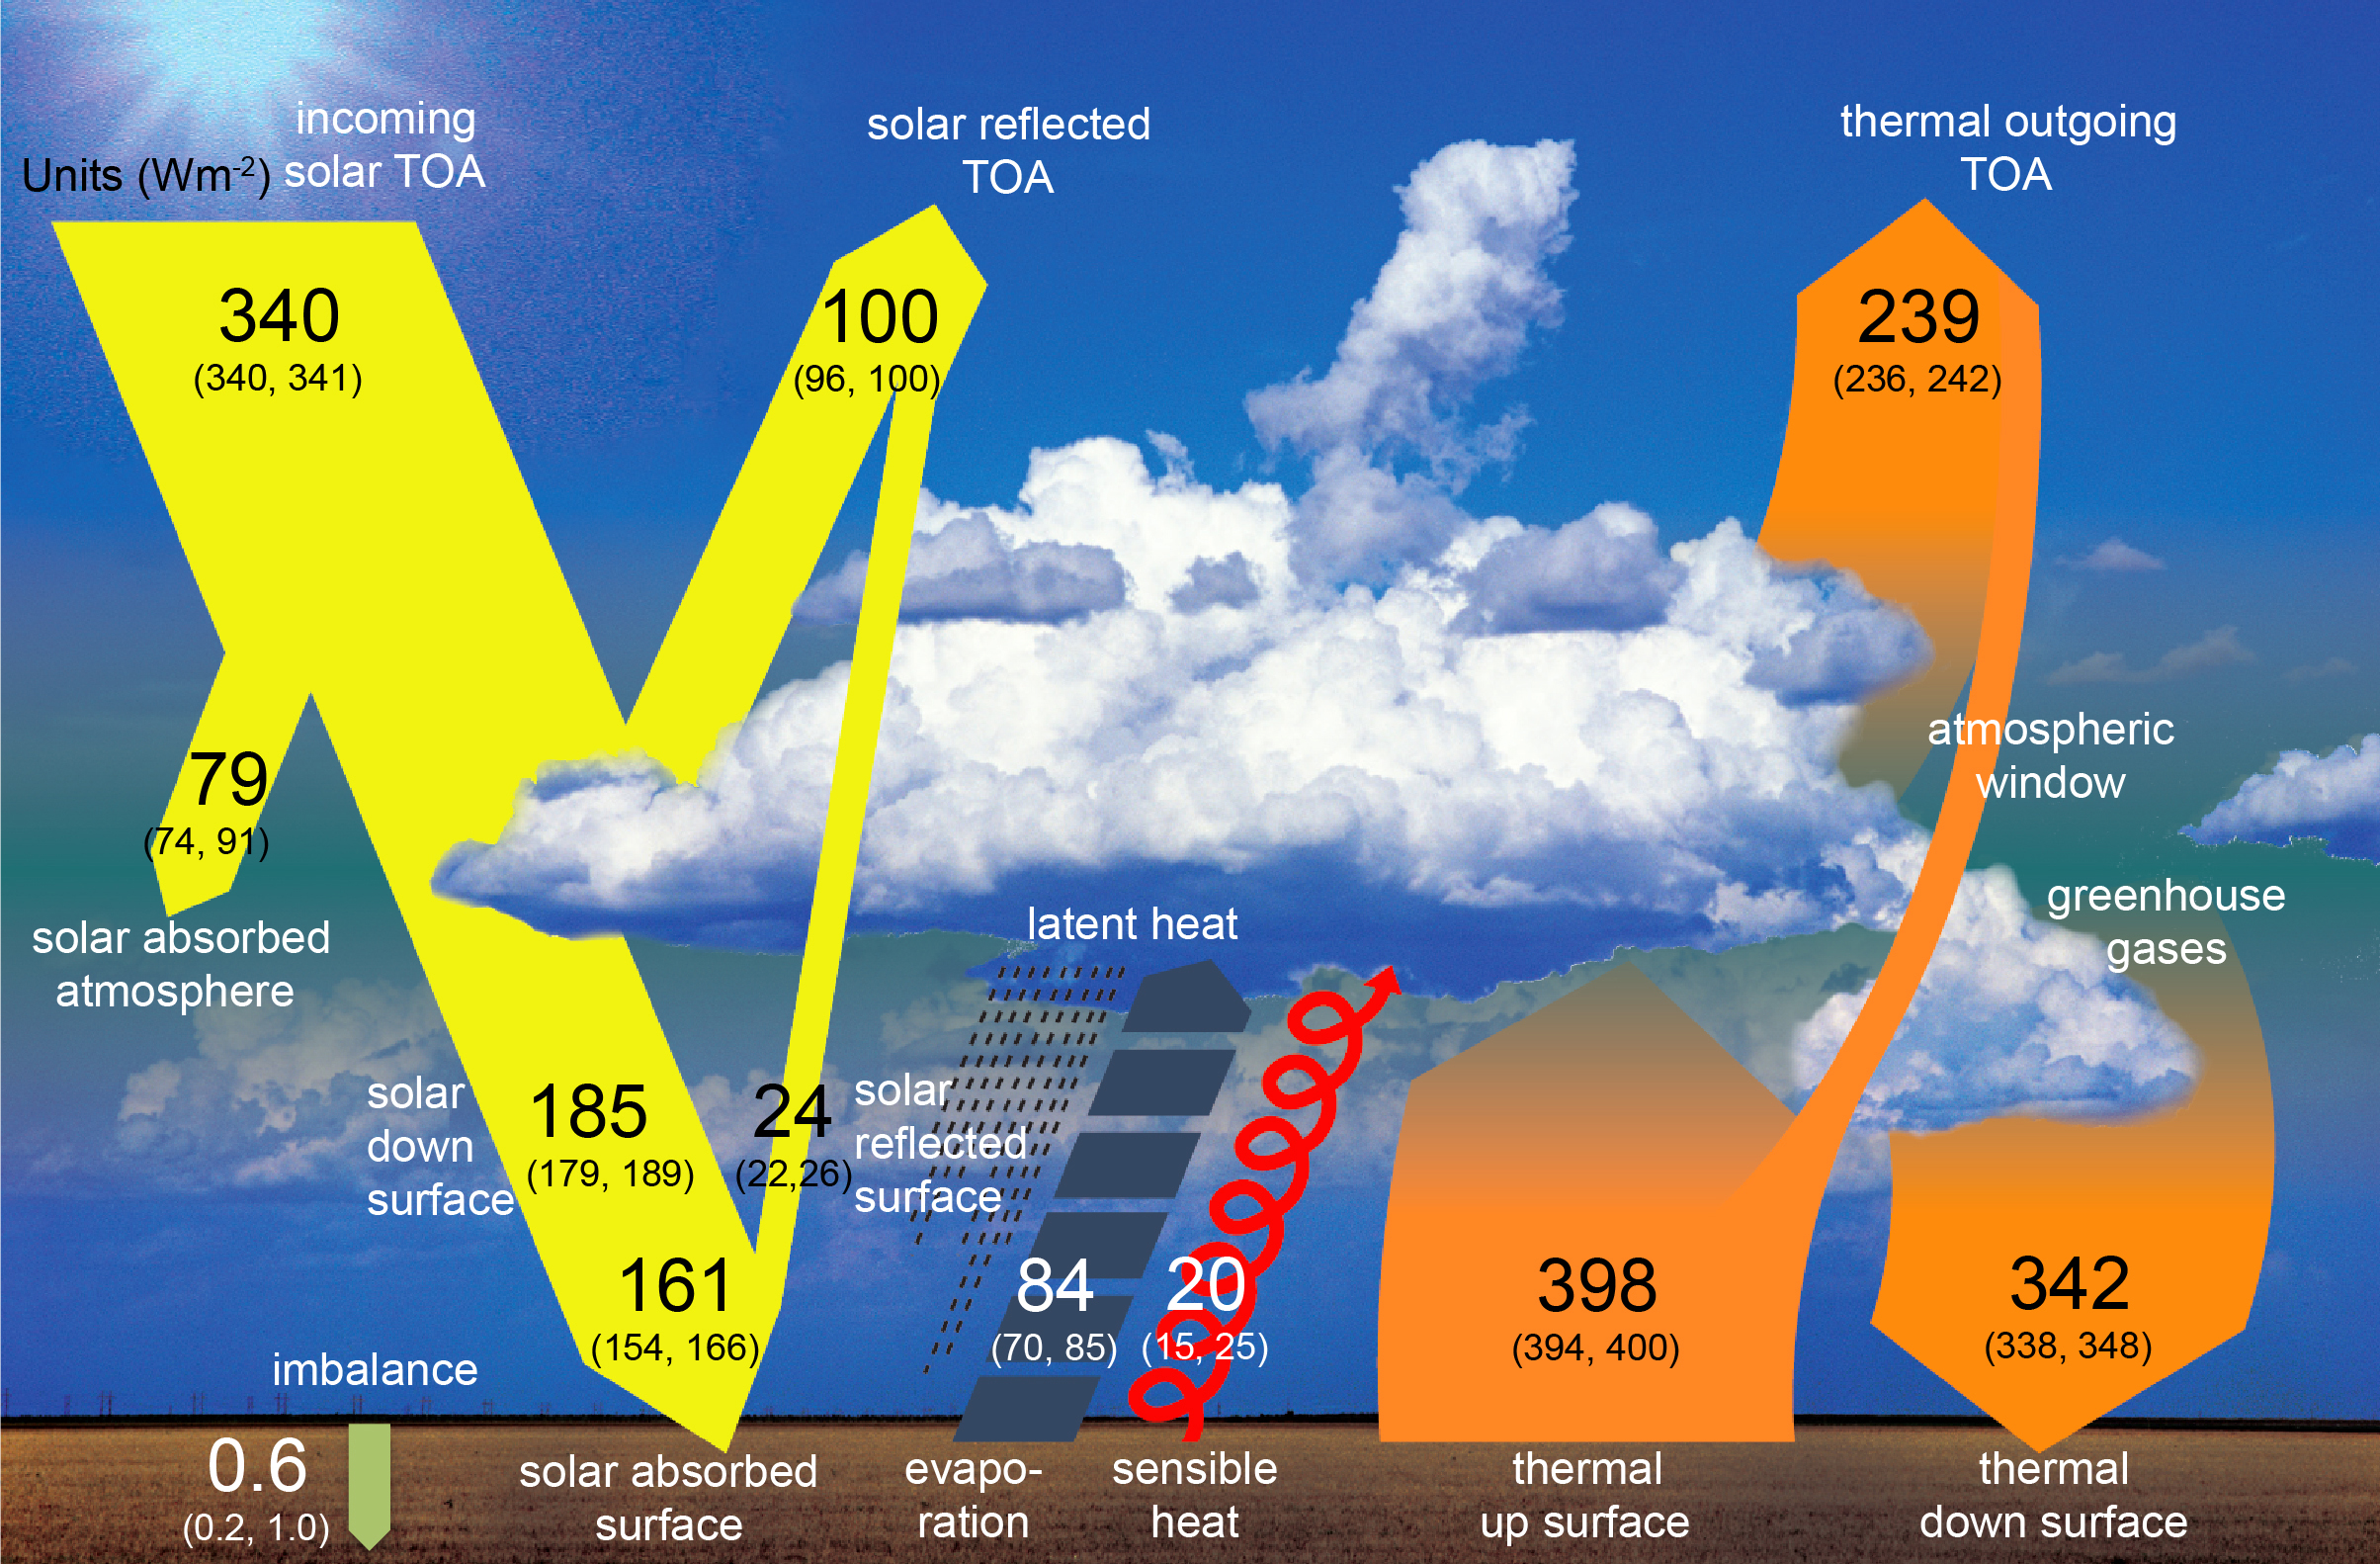
It is an update of previous images by Fasullo and Trenberth, inferior in not showing the size of the atmospheric window (40 W/m^2 in the latest Fasullo and Trenberth image), but superior in showing the 95% confidence interval in brackets. Not including the data for the atmospheric window means the energy balance cannot be determined for the atmosphere, but only for the surface and the Top Of the Atmosphere (TOA). The legend of the image informs us that:
"Numbers state magnitudes of the individual energy fluxes in W m–2, adjusted within their uncertainty ranges to close the energy budgets. Numbers in parentheses attached to the energy fluxes cover the range of values in line with observational constraints."
(My emphasis)
The important thing about figure 2.11 is that it only shows the energy balances. It in no way shows the change in radiative forcing, and is in no way intended to show the greenhouse effect. You can determine what is called the "total greenhouse effect" from it, that being the difference between the upward IR radiation at the surface and the upward IR radiation at the TOA. That total effect, however, includes the effect of feedbacks that effect IR radiation (including WV, lapse rate, and cloud thermal feedbacks) as well as the direct effect of the total concentration of Well Mixed Greenhouse Gases, stratospheric water vapour, and ozone.
To properly understand Koonin's error, it is helpfull to look at Fig 8.1 (from Chapter 8 of the WG1 report):

"Figure 8.1 | Cartoon comparing (a) instantaneous RF, (b) RF, which allows stratospheric temperature to adjust, (c) flux change when the surface temperature is fixed over the whole Earth (a method of calculating ERF), (d) the ERF calculated allowing atmospheric and land temperature to adjust while ocean conditions are fixed and (e) the equilibrium response to the climate forcing agent. The methodology for calculation of each type of forcing is also outlined. DTo represents the land temperature response, while DTs is the full surface temperature response. (Updated from Hansen et al., 2005.)"
The important thing here is to understand what is meant by radiative forcing, which is illustrated in Fig 8.1b. It is the change in net upward radiation at the tropopause following a change in atmospheric composition or incoming radiation etc, after allowing the stratosphere to adjust temperature. With a doubling of CO2 (approximately the situation Koonin considers), that change is 3.7 W/m^2. To determine the percentage of that effect, you need to compare it to the net radiative forcing of relative to the situation with no greenhouse effect.
The total greenhouse effect is given by the difference between surface and TOA upward IR radiation, or 159 W/m^2. However, 75% of that is due to clouds and water vapour, ie, due to feedbacks, and are not a "forcing". The reason for that is that a change in those values will simply revert to equilibrium values in a short time. So, the change in greenhouse forcing due to doubling CO2 is 3.7/(0.25*159), or 9.3%. If the response of temperature to changes in forcing were linear (which they are not), that would result in an increase of temperature of 3.55 K before feedbacks (9.3% of 33K).
Alternatively, we can see that increase is 1.6% of the TOA energy budget, leading to an linear 'expected' increase of 4.08 K; or a 0.9% of the net solar plus total greenhouse effect, leading to an linear 'expected' increase of 2.59 K.
Importantly, these are all TOA comparisons. Because the radiative forcing is a TOA value (technically top of stratosphere, but the numerical difference with TOA is sufficiently small that it can be neglected), it can only meaningfully be compared to TOA values. Koonin tries to compare a TOA value with a surface value, he is comparing apples to oranges, and demonstrating his complete failure to understand even basic theory of the science he criticizes.
If Koonin wanted to make legitimate comparisons, he should really be making comparisons of temperature response. The expected temperature response of doubling CO2 ignoring feedbacks is only 1.2C (+/-0.12 C). That is only 0.4% of Global Mean Surface Temperature (GMST), but 3% of the temperature range consistent with the existence of human civilization. Annual average temperatures below 0 C or above 40 C don't really concern us, because they are inconsistent with human flourishing. It is the percentage change within that range that matters. With feedbacks, that doubling pushes the response up to 6-12% of that temperature range. With a GMST we currently have a small part of the Earth below that range (the poles), and no part of the Earth above it but nearly a third of the Earth is within 25% of the upper limit. One doubling could push sizable portions of the Earth to the limit or beyond; while two doublings may make as much as a third of the Earth unsuitable for human civilization. These are the percentages that matter.
Moderator Response:[TD] The second figure in Tom's comment has gone missing (only the caption shows). Will somebody please fix it?
-
Tom Curtis at 08:55 AM on 29 September 2014Your questions on climate sensitivity answered
For additional information, the often mentioned trillion tonnes of carbon limit on human emissions to avoid dangerous impacts of global warming amounts to a 540 ppmv limit. That view, above all others, represents the scientific consensus on safe levels of emissions. There are scientists who believe that even it overstates the necessary level of concern, but at least equally many who thinks it overstates the safe limits, including Hansen.
The later takes the view expressed by 350.org, ie, that 350 ppmv is the upper limit on safe greenhouse concentrations. I have a problem with 350.org that they appear to over-egg the data. Hansen, for example (and no doubt sincerely), considers the possibility of runaway global warming real, even though the science is very firmly against him on that point.
My biggest problem with the 350.org point of view is a failure to take into account the fact that, given zero net human emissions, CO2 levels will fall substantially if slowly; and that the full impacts of ECS will occur slowly and on approximately the same timescale as the initial natural draw down of CO2. These are very important facts, and make an otherwise impossible task plausible. That is, there is an economic cost in reducing CO2 emissions at least in the short term, and reducing emissions to net negative values in the very short term as advocated by 350.org makes that economic cost sufficient that it could plausible cause as much damage as 550 or even 650 ppmv of CO2. In constrast, limiting net emissions to 0.75 to 1 trillion tonnes (475-540 ppmv) in the short term will have an initial short term economic cost substantially less than (for example) the cold war. That is, it is achievable while retaining the economic ability to achieve other major ends.
Developing the technology to limit CO2 emissions by that amount will also develop the technology to go the further and necessary step to achieve net zero anthropogenic emissions. In particular, zero gross anthropogenic emissions will be impossible to achieve for a variety of reasons, and gross emissions above 5% of current emissions may result in either no natural draw down, or a long term slow build up of CO2 concentration. Therefore, as with 350.org, I agree that we will need to develop a cost effective technology for carbon sequestration. I disagree about the scale to which that is necessary, and the time period in which it is necessary.
(Apologies to the moderators for the extensive off topic post.)
-
sidd at 08:54 AM on 29 September 2014The Wall Street Journal downplays global warming risks once again
Koonin is doing exactly what he has been commissioned to do, influence the APS/AIP climate change statement. I urge those of you who are APS or AIP members to write (paper/snailmail is much better than email) to pointing out his underhanded elisions and demanding a strong statement on climate change. The op ed is directed toward that smallish fraction of physicists who yet engage in denial. As for the rest, he is at a disadvantage, they are scientifically literate, can calculate and look up citations ...Note though, there is actually mention of a revenue neutral tax on fossil carbon. That, coupled with the Goldman Sachs downgrade of Peabody Coal indicates to me that the oligarchs are looking for an exit.
-
Tom Curtis at 08:29 AM on 29 September 2014Your questions on climate sensitivity answered
ranyl @13, it would be helpfull to myself, and presumably other readers if you distinguish quotation from your own words. At a minimum, you should use quotation marks (on your keyboard next to the enter key). It would also be helpful if you used the indent function from the wysiwyg panel in the comments screen, indicated by the quotation mark signal.
Trivial points aside, it is very easy to get a long list of papers which indicate models may (there is disagreement on the point among relevant scientists) overestimate CO2 drawdown (or climate sensitivity). It is equally easy to get long lists of papers which indicate models may overestimate the same. Climate change deniers continually refer to the later and ignore the former, in a process that is called pseudoscience. It is no more scientific to continually refer to the former and ignore the later. The climate scientists who actually device the models, such as David Archer, keep track of both; and revise the models on the basis of the balance of evidence.
So:
- While you can list a series of reasons to think the models underestimate draw down, it has recently been shown that volcanic emissions are significantly larger than previously thought, which implies a larger draw down rate, and hence that models underestimate the draw down.
- The models in question have with reasonable accuracy retrodicted the Earth's carbon budget over the last 600,000 years. While they are likely to be wrong in detail (as with all models), they are therefore unlikely to be wrong about the basic picture.
- The higher temperatures and sea levels in the pliocene where in a near full equilbrium condition. That is, they were achieved as the Earth achieved its Earth System Climate Sensitivity, which is noticably higher than the Equilibrium Climate Sensitivity or the more relevant (over the coming two centuries) Transient Climate Response.
- Finally, anybody who knows me knows I am not sanguine about about even 500 ppmv, let along 650. As a matter of urgency we need to stop net anthropogenic emissions before atmospheric CO2 tops 450 ppmv. Not, however, due to some panicked forecasts about the effect of a current 400 ppmv 500 plus years down the track.
-
ranyl at 07:23 AM on 29 September 2014Your questions on climate sensitivity answered
ranyl & Rob P @8, with a slug of CO2 of a trillion tonnes or more, approximately 25% remains in the atmosphere in the long term. About 50% has human emissions have already been drawn down, so another 50% remains to be drawn down. That means to get a long term 400 ppmv CO2 concentration, in the short term CO2 concentrations need to rise to 620 ppmv. For 460 ppmv CO2e, you need 640 ppmv of CO2 (as other WMGHG decay in the short term). The upshot is that long term concentrations of 400 ppmv plus, along with the effects of such concentrations evident from the paleo record, are likely long term consequences of BAU (RCP 8.5 or even RCP 6) scenarios. They are still very avoidable, however, if we get serious attempts to mitigate climate change.
Sorry Tom that is using models with many CO2 feedbacks not included, presuming a strogner fertilization effect than being seen, not including forest fire feedbacks, and several others despite the complexity of the models. And don't forget the widespread fertilization effect of nitrogen fertilisers, that has been more than enough to offset all the NO2 emissions from them, stop using the industrial fertilizers as is necesary for biodiversities sake and well that fertilizer effects goes. And si has been shown that ecosystem disrupton releases carbon (not included in those optimistic carbon withdrawal nodels), adn extrem weather event sand increased erosion is releasign soil carbon, and then there si the frozen sea bed stoes of permafrost of siberia that are releases stuff also not included.
We are already committed to be above 400ppm (and think 470ppn CO2e) for at the very best least another 200 years or so, so that is at least 80% of the warming of full equilibrium.
Stiff the roses.
350-400ppm it was 3-5C hotter and that was not including the extra heat recetnyl found in the western pacific recently reported, the WPAC was 3C hotter than thought and that is a reasonable chunk of ocean to increase, and thus 5C is the much more likely.
There is no more room for any more carbon emissions, yet we are going to have lots more for nothing stops overnight.
Now I get all the papers and many more to prove these points.
Including several recent papers that match climate models to reality in temr so fo wate vapour and cloud fomrations when only the models with a climate sensitivity of 3C or above do the trick, and it is more likel yto be 4C as many are now realising.
We have a huge carbon debt not a budget.
But anyway apparently WWW3 has kicked off in papal terms so that wil a whole load carbon emssions and habitat destruction with millions of people sufferign on top, so let su be sure 400ppm will soon be a distant target everyone wishes we could back to, but gettign any CO2 out the atmosphere any time soon will a transformation of everything to acheive.
And how much carbon extra is it going to take to actual make all the new power generation, electric cars, etc, and just how toxic are batteries and the like?
Oh I know lets pretend we put another 1/3 again of CO2 into the atmosphere because some computer models (that have underestimated lots so far (e.g. sea ice arctic), give a 2/3 chance of avoiding 2C by 2100, or to put it another way lets play russian roulette with 2 bullets in the 6 carousel with the future of humanity?
Now what is the carbon budget that gives a 95% chance of avoiding 2C when the CS is 4C?
-
JoeT at 05:06 AM on 29 September 2014The Wall Street Journal downplays global warming risks once again
Tom or Bob,
I think it's important for physicists such as myself (I'm a plasma physicist), who are essentially ignorant of climate science (but I'm trying to learn!) understand clearly what Koonin is saying. One more question if I may, just to make sure I have it right. The shocking thing to me from Figure 2.11 of the IPCC report is how huge the back radiation is, 342 w/m2 compared to the solar absorbed at the surface, 161 w/m2. So if I look at a rough energy balance, then there is 159 w/m2 difference between the radiation output at the surface and that at the TOA. Now to get to 342, I need to add 84 for evaporation, 20 for sensible heat and 79 for solar that is absorbed in the atmosphere. That comes to 342 exactly. So, just to be pedantic about all this, the mistake Koonin is making is that he is including evaporation, sensible heat and solar as contributions to the greenhouse effect, rather than just the 159 w/m2. Am I saying that correctly? TIA.
-
MA Rodger at 19:06 PM on 28 September 2014Your questions on climate sensitivity answered
Lewis & Curry (2014) is pretty much what you'd expect from the title 'The implications for climate sensitivity of AR5 forcing and heat uptake estimates' and from its authors - a bean-counter meets a quasi-holistic climatologist. The thrust of the study is to take the numbers from AR5 WG1 Appendix2 and shove the implications of them back at the IPCC. This is easily done but there is quite a bit of cheese-paring required to get the desired result. For instance, note how the 'headline' 1859-2011 result when compared with Otto et al inc. Lewis (2013) loses 5% of the ∆T and gains 25% of the ∆(F-Q).
And choosing a different temperature record than HadCRUT4 would gain 5-10% more ∆T. The comparing of peak temperatures from late-1800s & mid-1900s is potentially questionable unless you are signed up to a big constant-amplitude multi-decadal oscillation. There is certainly room for significantly higher sensitivity by taking different time periods if the Appendix 2 forcings are taken at face value (which is what the study is about). And as most of the warming has occurred recently, slow feedbacks will not have had time to act for 'most of the warming'. And the one natural wobbler of temperature that is beyond doubt, ENSO, is an unknown for the post-1850 period. ENSO could have elevated the 'headline' base temperatures just as it has mainly depressed the 'headline' end period. That could easily have clipped 10% off the ∆T used bt Lewis & Curry. (I note the MacDonald & Case (2005) PDO reconstruction (wiki-graph) looks a bit positive for 1859-82 suggesting ENSO will indeed have been warming.)
So the headline low ECS provided by Lewis & Curry (2014) is at best controversial.
And do note, if it is as Lewis & Curry suggest, it only works if we are now about to experience a repeat of the cooling cycle seen twice before over the last 160 years. So hold onto your hats. The Kara Sea will melt away (or is it 'ice over'?) plunging the whole Northern Hemisphere into two decades of cooling and priming a negative AMO ready for another round of Wyatt's Stadium Wave. This I will enjoy seeing.
-
Rob Painting at 15:06 PM on 28 September 2014Your questions on climate sensitivity answered
Tom @ 9 - True, it depends how things pan out in the real world. If, for instance, carbon fertilisation of the atmosphere does indeed cause the stupendous growth of land-based plants, as the carbon cycle models predict, much of the excess carbon dioxide will be drawn down. The evidence for this is pretty equivocal so far.
Also, once the ice sheets are committed to collapse, there's no turning back. If we haven't passed that point, and humanity were to get its act together, the collapse of the ice sheets may be averted. Trouble is that empty assurances are all we have so far. Fossil fuel emissions keep climbing, and will continue to do so for the foreseeable future.
As you may have figured out, averting dramatic future sea level rise is not something I'm very optimistic about.
-
denisaf at 13:35 PM on 28 September 2014Your questions on climate sensitivity answered
Sunlight is energy input that is absorbed in heating up the atmosphere and the oceans as well driving operations on the land. Energy is output by radiating out into space. The energy input and output had been roughly in balance for eons, so enabling the biological operations that organisms were dependent on. Then the emissions from fossil fuel usage rapidly upset that balance so heat has accumulated in the atmosphere, oceans and land. The emissions have effectively placed a blanket around the globe, so causing the warming. Cutting back the rate of emissions will do no more that slow down the heating. The energy input and output balance has been irrevocably degraded by the operations of industry. Natural forces will very slowly restore this balance after the demise of industrialed civilization.
-
Tom Curtis at 12:45 PM on 28 September 2014Your questions on climate sensitivity answered
ranyl & Rob P @8, with a slug of CO2 of a trillion tonnes or more, approximately 25% remains in the atmosphere in the long term. About 50% has human emissions have already been drawn down, so another 50% remains to be drawn down. That means to get a long term 400 ppmv CO2 concentration, in the short term CO2 concentrations need to rise to 620 ppmv. For 460 ppmv CO2e, you need 640 ppmv of CO2 (as other WMGHG decay in the short term). The upshot is that long term concentrations of 400 ppmv plus, along with the effects of such concentrations evident from the paleo record, are likely long term consequences of BAU (RCP 8.5 or even RCP 6) scenarios. They are still very avoidable, however, if we get serious attempts to mitigate climate change.
-
ranyl at 08:39 AM on 28 September 2014Your questions on climate sensitivity answered
How hot was the earth the last CO2 was 400ppm?
Or should we say 460ppm Co2e?
And how high were sea levels?
Moderator Response:[Rob P] - Based on the relationship between atmospheric CO2 and sea level over the last 40 million years, we are likely committed to 24 metres (+7/-15 metres at 68% confidence) of future sea level rise.
That seems to be supported by recent observations from the Antarctic showing that the West Antarctic ice sheet, and perhaps coastal sectors of the East Antarctic ice sheet, are beyond the point of no return. It will likely play out over millennia, but over a metre of sea level rise this century will cause widespread disruption and be extraordinarily expensive to deal with.
-
Bob Loblaw at 07:40 AM on 28 September 2014The Wall Street Journal downplays global warming risks once again
Tom:
I agree that doing it right has been around a lot longer than 1979, and misunderstandings also go back further. The reason I picked Newell and Dopplick as an example was two-fold:
- I knew of the study (and the comment/reply), having been exposed to it (and why it was wrong) as part of my graduate studies in the mid-1980s (i.e.. 30 years ago);
- it was an example of the sort of mis-understanding that Koonin is making - but an example that appears in the proper scientific literature, underwent peer review, was properly critiqued in the same journal ("hey, you made some mistakes"), and where it received a proper reaction from the original authors ("oops"). Journal-published comments on bad papers are so rare these days that it is useful to have examples where they exist.
The second point is germain to the fact that Koonin:
- is making his points in non-peer-reviewed slop-eds and opinion papers;
- is making mistakes that were somewhat permissible in the scientific literature 35 years ago (J Applied Meteo is a generally excellent journal);
- is making mistakes that he has no excuse (other than willful ignorance) for making in 2014.
If Newell and Dopplick tried to publish a similar paper today, in a respectable journal (not something like E&E or one of the off-topic or vanity press labels the denial indistry is fond of), it would likely not get published at all. Knowledgable reviewers would notice the mistakes immediately.
Joe:
As I knew it was Robert Watts (respected scientist), having read the comment decades before Anthony's blog was a gleam in a denialist's eye, it didn't even occur to me that someone might wonder if it involved Anthony. Thanks for a good laugh!
-
John Hartz at 03:05 AM on 28 September 2014Your questions on climate sensitivity answered
Speaking of ATTP (And Then There's Physics)...
In his article, Study lowers range for future global warming, but does it matter? (Capital Weather Gang, Washington Post, Sep 26, 2014), Jason Samenow references and links to ATTP's post, Lewis and Curry.
Here's what Samenow has to say:
"The blog And Then There’s Physics lists several reasons why Lewis and Curry’s estimate could be too low, including not fully accounting for the transfer of heat between the ocean and atmosphere.
"It further cautions one must use be careful in leaping to conclusions from the results of a single study. Computer modeling studies generally estimate higher values for ECS, as do some studies based on paleoclimate data."
-
Tom Curtis at 03:02 AM on 28 September 2014The Wall Street Journal downplays global warming risks once again
Bob Loblaw @33, Koonin is even more out of date than that. Arrhenius appears to have calculated the greenhouse effect based on back radiation, and the idea of a saturated CO2 effect due to Angstrom (1901) can almost make sense on that basis. Callander in the 1940s, however, showed the greenhouse effect to have not been saturated using more detailed data on absorption at different wavelengths. However, the model of the greenhouse effect used might still be considered a back radiation model. That changes with Manabe and Wetherald (1967) which explicitly incorporates convection into the model, and explicitly models radation balance at the TOA. Therefore, by 1967 at the latest, Koonin's theory was falsified and out of date. He is ignoring 46 years of science he finds inconvenient, including, as you point out, a direct refutation of his theory.
-
JoeT at 01:35 AM on 28 September 2014The Wall Street Journal downplays global warming risks once again
Thanks Bob for the additional comments. I have to admit that I went to the Watts reference first, but was reassured that it was a Robert from Tulane, not an Anthony from nowhere. The articles were actually very informative, so thanks for pointing them out. As a member of the American Physical Society myself, it concerns me greatly that Koonin is (or was?) the chair of the APS committee tasked with rewriting the orgranization's position on climate change. It's the reason I was particularly interested in understanding his article.
-
Bob Loblaw at 01:06 AM on 28 September 2014The Wall Street Journal downplays global warming risks once again
JoeT's comment @38 quotes Koonin, and provides a link to the source. As soon as I read JoeT's comment and followed it to the original, I realized that Koonin was making a rookie mistake. Tom and Joe have provided good discussion; I'd just like to point out the following, which agrres with Tom and Joe:
- Koonin compares radiative changes due to CO2 increases with surface energy balances. This is wrong.
- What happens at the surface is highly complex, involved convective as well as radiative energy exchanges.
- The role that increasing CO2 plays in climate is best represented by the changes in the top-of-atmosphere radiative exchange.
Koonin is not the first to make this mistake. For example, in 1979, Newell and Dopplick published a paper reporting a much lower CO2 sensitivity than other papers had been suggesting. In 1980, Watts published a comment, pointing out the errors (including the mistake of looking at surface energy balances). Knewell and Dopplick responded, acknowledging errors. At one point, they even say "These criticisms are accepted. The situation appears to be much more complicated that [sic] we realized two years ago." This is how science works: publish, review, accept errors and move on.
Koonin is at leat 35 years behind the times in the mistakes that he is making. I wonder how long it will take for him to be scientific and learn from his mistakes? He can clearly be scientific on other topics, but on climate change he's a pseudo-skeptic or dismissive.
-
Doug Bostrom at 16:58 PM on 27 September 201497 Hours of Consensus reaches millions
Re Wol's offering, it's sad for all of us how a bag of hammers always sees nails, always drops the same way, doesn't seem capable of learning anything useful to itself or the world at large.
Critiques of the Cook et al paper generally produce a familiar, dull clank and thud ending their fall, following as they do a limited selection of trajectories with which we're all dismally familiar after witnessing decades of the same behavior regarding climate science itself.
Failing to actually read the research in question before blurting an opinion is basic bag of hammers instinct.
-
Ken Rice at 16:05 PM on 27 September 2014Your questions on climate sensitivity answered
Although Tom has already pointed this out, since it was attributed to me, I will add that I didn't ever say that the method doesn't take the role of the oceans into account. In determining the ECS it does indeed include the change in system heat uptake rate, which is dominated by energy going into the oceans. As others have mentioned there are issues with how they've determined their system heat uptakes rates, but it isn't corret that the method doesn't consider the oceans at all.
-
97 Hours of Consensus reaches millions
I'm sure you have read this:
http://data.parliament.uk/writtenevidence/WrittenEvidence.svc/EvidenceHtml/4191
Comments?
Moderator Response:[Rob P] - Yup, he doesn't even appear to have read our peer-reviewed paper Cook et al (2013). I find reading generally helps to clear up misunderstandings. Cook (2013) states:
"In a second phase of this study, we invited authors to rate their own papers. Compared to abstract ratings, a smaller percentage of self-rated papers expressed no position on AGW (35.5%). Among self-rated papers expressing a position on AGW, 97.2% endorsed the consensus."
Guenier claims:"......a subjective interpretation, as authors were not asked about their view"
Probably lawyer-speak, but it insinuates that our rating process was simply our opinion. The authors of the respective papers are more likely than anyone else to know what their research had to say about global warming. Our abstract rating process had the scientific consensus at 97.1% whereas the author self-ratings were slightly higher at 97.2%.
The simple fact is that the world is warming and changing pretty much as expected. The scientific literature just reflects the overwhelming nature of the evidence. That some people reject science is hardly a novel revelation.
Oh, and please note that link only comments are against SkS policy and will be deleted in future. You need to provide some discussion to demonstrate you're not just link-spamming a thread.
-
Tom Curtis at 08:25 AM on 27 September 2014Your questions on climate sensitivity answered
Christian, hi.
My original version of my comment mentioned, and linked to your comment at ATTP. Unfortunately it was lost and the repeat was much shortened.
-
Christian11155 at 08:12 AM on 27 September 2014Your questions on climate sensitivity answered
Hi Tom,
You rigth, that was what figured out in "And Then There's Physics" Blog. In Fact, L&C used heat-uptake but their value is unable to explain real sea level rise in their final periode and this would imply, that heat uptake from other sources as ocean heat uptake.
Because they ignored other sources, their dQ (Heat-Uptake) ins biased to low.
And that is what ive written in "And Then There's Physics" at September 26, 2014 at 2:37 pm
-
Tom Curtis at 07:47 AM on 27 September 2014Your questions on climate sensitivity answered
Roz Pidcock in the OP writes:
"One criticism of the energy budget model approach that lies behind these kind of studies is that it doesn't take into account the role of the oceans in taking up excess heat."
In fact the formula used by Lewis and Curry is ECS = change in temperature divided by (change in forcing minus change of heat flux into the oceans). Therefore they very explicitly take into account the role of oceans in taking up excess heat. And Then There's Physics never said otherwise. There are very valid criticisms (IMO) of their methods of taking OHC flux into account, but not that they ignored it all together.
-
Tom Curtis at 07:21 AM on 27 September 2014Your questions on climate sensitivity answered
Russ R @1:
1) You say "all estimates derived from recent temperature observations, which are consistently lower than those derived from paleo proxy data or computer models" as if it were actually true. In fact, many estimates based on the instrumental record are as high as or higher than those from the paleo record and computer models. On average, those from the instrumental record are slightly lower. Perhaps more germain, the estimates from the instrumental record that you read are biased low due to your sources of information. But neither of these facts make your assertion true.
2) You are correct that climate sensitivity is "not a thing" (though neither is g). Major changes in continental positions, changes in dominant ocean currents, changes in vegetation and rainfall patterns, and changes in GMST will all effect the the value of the climate sensitivity. Therefore Paleo Climate estimates primarilly provide a sanity range.
However, you do not think the consequences of that through.
What it means is that the purportedly low climate sensitivity over the twentieth century is no gauranttee of a continuing low sensitivity into the future. As global temperatures rise it becomes likely that the low climate sensitivity of recent times (if it is a fact) will revert to the higher non-glacial climate sensitivity from paleodata (ie, regress towards the mean) so that the final impact of anthropogenic forcings will be determined by that higher climate sensitivity than our purported valley.
You argue against that based on an expected reduction in ice albedo feedback as the planet warms. That expectation is correct, but there is also an expected increase in the strength of the water vapour feedback as the planet warms due to the Clasius-clapeyron relationship. The ice albedo feedback is currently near a minimum and is very low compared to that during glacials (for example). Any major warming, therefore, is likely to result in the increase in strength of the water vapour feedback dominating over the decrease in strength of the ice albedo feedback.
You also appeal to uncertainty. In decision making under risk, uncertainty is not your friend. If your playing Russian Roulette, the game is not made safer if before each go, the gun is loaded with the result of the roll of a six sided die minus 2 cartridges. On the contrary, the uncertainty makes the game even more foolhardy. In this case, uncertainty may mean that nailing down the current ECS at a nice midrange 2.5 C does not gauranttee us that it will not have pushed out to 4 C by the end of this century.
3) Despite the increase in sea ice in the Antarctic, the decrease in sea ice in the Arctic is larger in magnitude, and the decrease in winter snowfall in the northern hemisphere is larger still. The net effect is that most models underestimate the ice/snow albedo feedback rather than the reverse.
-
JoeT at 07:00 AM on 27 September 2014The Wall Street Journal downplays global warming risks once again
Tom, I was working on my own post and didn't see yours until I submitted it. I'm glad to see we both have the same conclusion.
-
JoeT at 06:57 AM on 27 September 2014The Wall Street Journal downplays global warming risks once again
Now that I went over Koonin's references, I think Tom's #8 is appropriate — the one he withdrew -— with bits of #9 thrown in as well. Post #8 is correct because Koonin really is looking at the downward radiation as the greenhouse effect, not the difference between the upward surface radiation and that at the top of the atmosphere. That's the difference between 342 w/m2from IPCC figure 2.11 and (398 - 239) = 159 w/m2. Then from SPM.5 (summary for policymakers) he takes the total anthropogenic forcing since 1750 of 2.29 w/m2. Then he does a net trick — he divides the 2.3 by 503 to get 0.0046, which indeed is less than 0.5% !!! That is he adds the incorrect 342 to the incoming solar radiation of 161 w/m2. Otherwise that number should really be 2.3/159 = 1.5%.
Then he says assume by 2050 CO2 rises to 550 ppm. Then the increase in the forcing is 5.35 ln(550/400) = 1.7 w/m2. Add that to 2.3 and you get 4.0 w/m2 (Koonin says 3.9). Now 4/503 = 0.8%, so to get the 1-2% that he says in the WSJ, he must have taken 4/342 = 1.2%.
Nowhere does he talk about sensitivity however and actual temperature change. -
Tom Curtis at 06:46 AM on 27 September 2014The Wall Street Journal downplays global warming risks once again
JoeT @28, thankyou for the sleuthing. Given the footnote it becomes sadly apparent that I was right the first time. I need to reinstate my comment @8, which discusses this misunderstanding, and withdraw my comment @9 (which while technically accurate, does not discuss Koonin's opinion).
So specifically:
1) Koonin misrepresents the greenhouse effect as simply a function of backradiation. That interpretation of the greenhouse is false, and has been known to be false for well over three quarters of a century. In scientific terms, it is like criticizing the planning of the apollo missions because they will not work based on Aristotelian physics. It is flat earth society material.
As I said @8, "at base Koonan's claim is based on a simple misunderstanding that shows he completely misunderstands the nature of the greenhouse effect, or that he is completely dishonest, or that he is simply parroting memes provided by others without understanding what the mean and what they are related to. The science really is settled on this one, so there is no fourth option."
2) Although Koonin mentions the solar radiation, he appears to be caclulating his percentage from the 390 W/m^2 of thermal radiation (back radiation). If he wanted to calculate the actual difference in backradiation, however, he ought to include the increase from feedbacks (WV and clouds) as well. The total effect is an increase of approximately 20 W/m^2 (at equilibrium), or approximately 5% of the total back radiation at the surface.
3) Koonin does not even calculate the direct effect of the increase in CO2 accurately. He appears to add the difference in radiative forcing for the change in CO2 (approx from the current 400 to the future 550 ppmv) to the current total anthropogenic forcing. By excluding any changes in anthropogenic forcing other than that from CO2 he understates the change in anthropogenic forcing by mid century. However, he does not state that he is discussing the change in anthropogenic forcing, but in the contribution of CO2 to the greenhouse effect, which makes it peculiar that he should us total anthropogenic up to 2011. This does not, however, make any difference to his 1-2% value.
Further, Keenan uses the TOA radiative forcing, not the change in CO2 contribution to the back radiation. The two are distinct values both because of the higher temperatures and because overlaps with H2O are more significant for back radiation. Again, this may not make a difference to the 1-2% estimate (due to the overlaps) - but Koonan does not know that. The values he uses are not relevant to the percentage he estimates (which is in turn irrelevant to the strength of the greenhouse effect).
-
Russ R. at 06:21 AM on 27 September 2014Your questions on climate sensitivity answered
There are a couple of points I'd make about Lewis & Curry's 1.64 degree C estimate of ECS (and by extension, all estimates derived from recent temperature observations, which are consistently lower than those derived from paleo proxy data or computer models).
First, and most importantly, climate sensitivity is not really "a thing", in that it's not some fundamental, unchanging constant of the planet (like g= 9.8m/s2). Climate sensitivity is the sum total of a whole array of forcing and feedback mechanisms, which are themselves not constants. So, ECS isn't always going to equal 3.0, or 1.64 or some other fixed value. It can (and very likely will) vary under differing climactic conditions as those underlying forcing and feedback mechanisms vary. Treating ECS like a constant is a useful shorthand for back-of-the-envelope estimates, but it's nowhere close to a law of physics.
As a simple example, consider Ice Albedo feedback. It only applies at the transition zone of polar ice extent (it has no effect in places that are permanetly frozen nor permanently ice-free), and as that ice extent retreats to higher latitudes with less surface area and insolation, the magnitude of IA feedback weakens, ultimately to zero. So, all else equal, you'd expect net feedback (and ultimately ECS) to be higher at the peak of an ice age vs. during an interglacial period. But all else won't be equal... other feedback mechanisms will each have their own dynamics, the sum total of which is unlikely to remain a constant. As such, different methods of estimation (paleo proxy measures vs current observations) might yield markedly different findings, and both can be entirely correct about the conditions that they measured. So evidence that ECS was 4 degrees Celsius in the distant geological past does not contradict evidence that ECS was 1.6 degrees Celsius in the very recent past. Furthermore, if ECS is not a linear constant, then extrapolations about the future become increasingly uncertain the further out you project.
Second, models all very sensibly assume ice albedo feedback is positive (i.e. warming causes polar ice to retreat, which causes more sunlight to be absorbed, which causes more warming.) To just about everyone's surprise, for the last couple of decades, the southern hemisphere has experienced the exact oppposite... ice extent has increased in the face of warming, acting as a damper rather than amplifier (i.e. a source of negative feedback rather than positive) which would lower . Nobody can say for certain why this has occurred (there are several good theories), or for how much longer it will continue to happen, but in the long term, the anomaly should reverse and warming should lead to less ice and positive feedback. Looking at the recent temperature record, this anomaly will "contaminate" observations, and likely lead to discrepancies between observation based estimates of ECS and model based estimates. So evidence that ECS was 1.64 degrees C in the recent past does not contradict models that estimate ECS at 3.0 degrees C for the near future.
Moderator Response:[Rob P] - There are no 'recent observations' for ocean heat content back in the 19th century. All these energy budget approaches have to use modelled estimates for that time period.
-
The Wall Street Journal downplays global warming risks once again
JoeT - Thank you, that explains much about Koonin's statements.
Koonin expressing anthropogenic forcings as "1 to 2%" of insolation is akin to graphing the 0.9C warming over the last 150-200 years as Kelvin degrees with a baseline of oK - which has been done by denialists multiple times, appallingly enough. See Denial Depot for a rather amusing explanation of how this is done. He might as well have characterized the height difference between basketball player Yao Ming and a lawn gnome using a percentage of the height of the Empire State building.
In doing so Koomin is rather deceptively minimizing the extent of the changes, which at this time have increased temperatures to or beyond the peak value at any time in the Holocene, at any time during human civilization (Marcott et al 2013) - with more unrealized warming to come. That's a more realistic scale, one that more clearly describes how these changes will affect us.
-
JoeT at 02:27 AM on 27 September 2014The Wall Street Journal downplays global warming risks once again
Tom Curtis,
Thanks very much for replying to my question regarding Koonin's statement. I'm still trying to understand it better. I finally came across an article with footnotes in which Koonin explains his reasoning on the CUSP website of which Koonin is the director . Here is the relevant passage:
[1] AR5 WG1 Figure 2.11 shows the global radiative balance, with the total downward flux on the Earth’s surface estimated as 503 ± 7 W/m2
(161 W/m2 solar + 342 W/m2 thermal). AR5 Figure SPM.4 shows the total anthropogenic direct perturbation of this balance to be some 2.3 ±
1 W/ m2, less than 0.5% of the downward flux. If the atmospheric concentration of CO2 were to rise to 550 ppm with all other anthropogenic effects unchanged, this perturbation would rise to be 3.9 W/ m2.I'm hoping that you might comment further. Thanks again!
-
One Planet Only Forever at 01:01 AM on 27 September 20142014 Arctic Sea Ice Extent Prediction
Looks like about 5.2 for the September average. So most predictions were low, and many of them significantly low.
My oops about this being the 5th lowest. I didn't count the dashed line of 2012 on the NSIDC interactive chart.
It would appear that predicting annual values needs much more reliable prediction of many difficult to forecast factors. Like many other climate related things, the longer term trend is much easier to predict.
-
MA Rodger at 19:36 PM on 26 September 2014Antarctica is gaining ice
Of course, we all make mistakes. Indeed, I managed to trip over a decimal point myself @289 by converting 1.9cm into 19cm. The trick is to correct mistakes and not compound them.
jetfuel @291.
Your explanation for where you obtained your numbers is helpful but it also indicates that you are entirely inattentive to what the numbers you present here actually represent.
@291 for instance you say that @279 I have "a graph showing only 58 Gt per year loss." This you apparently consider as "only 58 Gt pa" because you are comparing it with the preceeding quoted sentence "According to these studies, the rate of ice mass loss from Antarctica has increased progressively over the past decade and, between 2010 and 2012, fell in the approximate central range 105 to 130 Gt yr−1."
What you fail to appreciate here is that the graph reproduced @279 is Figure 5 from Willams et al (2014). This source is made palin @279 and you will note that in the quote you present @291, one of "these studies" helpfully listed by the quote is the very same Williams et al (2014). Hey, and guess what? A quick regression of the Williams et al. data for 2010-12 yields 107 Gt/yr. You of course are quoting the average for 2003-12 which will be different if there is an acceleration involved which there obviously is.
You are also wrong @291 suggesting the 105-130 figure came from this discussion thread. I see no sign of it prior to you introducing it @282.
And "these studies" do not determine "the snow/ice layer boundary depth" as your comment suggests. "These studies" use GRACE gravity measurements.
And you may take comfort that such a small proportion of Antarctica is melting away each year but the point is not to preserve Antarctica as a frozen continent. It is to prevent damaging SLR. If Antarctica were to melt to nothing (and the way humanity is acting, that is not so silly on a multi-century time scale) it wound drown 90% of present human endeavour.
You are probably at liberty to call the NOAA "a bunch of idiots". They likely get called worse fro time to time. But it is you that is wrong in saying the NOAA is "wrong". Their quote of a record breaking August this year is helpfully accompanied by a graph illustrating the record which is thus obviously the record since 1979.
And yes, we are all comforted that Antarctic Sea Ice is not yet showing the slightest sign of collapse, but that does not make up for melting cryosphere everywhere else in the world. And perhaps, because Antarctic Sea Ice is not part of some grand global equasion, it is also off-topic in this comment thread.
-
Tom Curtis at 10:37 AM on 26 September 2014Antarctica is gaining ice
Sorry, Scaddenp, your mention of "significant" along with KR's discussion of statistical significance seems to have made my mind to skip a few lines and (I suspect) start teaching my grandma to suck eggs. Just take my comment as a general comment with relevant information and ignore the fact that I addressed it to you.
-
Tom Curtis at 10:33 AM on 26 September 2014Antarctica is gaining ice
Scaddenp @292, Tamino made that claim a couple of years ago, when it was true. Since then Antarctic sea ice has continued to expand and the expansion is now statistically significant, and was in most of 2013 as well:
Indeed, by pixel count, the Antarctic sea ice extent lies at approx 4 Standard Deviations above the mean for the satellite era. Of course it is well below that of the pre-satellite era, and approx 10% below that of the 1960s as shown by HadISST (contrary to Jetfuel's claims above).
Further, although is also a possibility of an error in baselining a transition between two satellite records that has been raised by Eisenmann et al (2014) and discussed by Tamino. Even if accepted, which the NSIDC does not (I believe), that only accounts for 0.2 million square Km of the record, and the trend is still significant. It does not place the satellite era record under threat.
-
Tom Curtis at 10:20 AM on 26 September 2014Antarctica is gaining ice
Jetfuel @291, McMillan et al's own finding about the rate of mass loss from 2010-2013 is 159 +/- 48 Gtonnes per year, as detailed in table 1, and also in the sentence immediately following that which you quote, and which reports other results. That is 65% of the mass loss expected if we assume the 1.9 cm per year is all ice. Ergo they have included both snow and ice loss in the calculation, and difficulty distinguishing between the two accounts for the increased uncertainty in the mass figure relative to the altitude figure (30% vs 10%).
In your post @282 you wrote:
"The paper does state that for the period from 2010 to 2013, the avg ice level is falling at 1.9 cm per year and that there is a 105-130 Gt per yr loss of ice mass. Considering there are 30,000,000 Gt of ice there, and a single 2009 snowfall in East Antarctica deposited 200 Gt of snow, and the report stating that the vast majority of Antarctica is stable, forgive me for thinking that this years 1960'sish sea ice levels down there could have made West Antarctic land ice more stable. How many years of -100 Gt per year until we can round 30 million down to 29.9? 10 centuries by my math."
And here is the relevant quote from the paper:
"At the continental scale, the most recent estimates of Antarctic ice sheet mass balance are based solely on satellite gravimetry surveys [Barletta and Bordoni, 2013; Velicogna and Wahr, 2013; Williams et al., 2014]. According to these studies, the rate of ice mass loss from Antarctica has increased progressively over the past decade and, between 2010 and 2012, fell in the approximate central range 105 to 130 Gt yr−1.Our survey puts the contemporary rate of Antarctic ice sheet mass loss at 159 ± 48 Gt yr−1, a value that, although larger, is nevertheless consistent given the spread of the gravimetry-based uncertainties (16 to 80 Gt yr−1). A possible explanation for the discrepancy is the exceptional snowfall event of 2009, which saw an additional ~200 Gt of mass deposited in East Antarctica [Boening et al., 2012; Lenaerts et al., 2013; Shepherd et al., 2012] that, although absent from the CryoSat-2 record, does factor in the gravimetry-based estimates of imbalance. "
I have italicized your quote @291, from which you also derived the total figures @282. I have bolded the sentence which reports McMillan et al's own result. The following sentence contains the only mention of the 200 Gt snowfall in 2009 in the paper, a snowfall you have mentioned several times including @281. Clearly you have read the paper's report of its own result for it lies immediately between two sentences you have clearly read. Depite that you chose to report other paper's results rather than those of the paper under discussion, and what is worse, left the impression that you were quoting this paper's results when you did so. This looks to me like a very open and shut case of deliberate misrepresentation of the paper. How the moderators choose to view this clear dishonesty, and act on it is up to them.
-
Antarctica is gaining ice
Jetfuel - Yes, there is currently a small (barely statistically significant, IIRC) increase in Antarctic sea ice extent.
But this small increase, likely due to increased surface fresh water from land ice melt, increased halocline inhibiting mixing from (relatively) warmer deep water, and wind changes, is but a flyspeck on the wall compared to the observed mid-20th century 25% decline in sea ice extent (de la Mare 1997).
You seem to be repeatedly arguing that recent Antarctic sea ice extent is somehow contradictory to observations of a warming globe - and even leaving out the masses of evidence such as thermometers, the Arctic, growth zones, etc, focusing entirely on Antarctic sea ice extent, that's just nonsense.
-
scaddenp at 09:23 AM on 26 September 2014Antarctica is gaining ice
Jetfuel - and your point is? We know the seaice is a record for recent times - if the conditions that create seaice trend continue, then upward trend will continue. So what? What do you see as the significance of this?
-
jetfuel at 07:48 AM on 26 September 2014Antarctica is gaining ice
I got the 1.9 cm from here in the report linked in michael sweet @273:
"Results
The CryoSat-2 observations confirm the continuation of existing signals of elevation change [Pritchard et al., 2009; Shepherd et al., 2002, 2012; Wingham et al., 1998; Zwally et al., 2005], identify regions which have evolved since previous surveys, and allow investigations of new terrain. Between 2010 and 2013, the average elevation of the Antarctic ice sheet fell by 1.9 ± 0.2 cm yr−1. Although most of the observed changes are smaller than expected fluctuations in snowfall (Table 1), those that are not coincide with areas of known dynamical imbalance (basins 13, 18, and 20 to 22) or with episodes of anomalous snow accumulation (basin 6) [Lenaerts et al., 2013]."
And quoting from the discussion section, I got the 105-130 Gt numbers:
"At the continental scale, the most recent estimates of Antarctic ice sheet mass balance are based solely on satellite gravimetry surveys [Barletta and Bordoni, 2013; Velicogna and Wahr, 2013; Williams et al., 2014]. According to these studies, the rate of ice mass loss from Antarctica has increased progressively over the past decade and, between 2010 and 2012, fell in the approximate central range 105 to 130 Gt yr−1"
MA Rodger @279 has a graph showing only 58 Gt per year loss. I am impressed that the snow/ice layer boundary depth can be determined by a satelite, and I am assuming they are ignoring the snow. I had been pondering the 1.9 cm per year ice depth loss as not much at the point where the ice is 13,200 feet thick, but as an avg across the entire continent, is seems like a lot and now i read it is way off base. ratioing the 58 to 2660 Gt calcs above, I convert the 1.9 cm to 4 mm of ice mass loss spread across the entire continent. Of course, 4 mm is an average and the concern is at the places that are falling at 9 m per year.
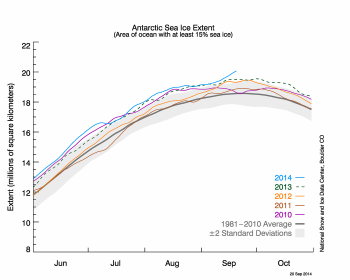
I'm sure there are easily a dozen different sources stating that this year is setting records. Me and NBC aren't the only ones getting it wrong. In this case, I'm in with a bunch of other idiots who are getting it wrong. From NOAA in August this year (2014): "This was the largest August Antarctic sea ice extent on record, surpassing the previous record set just last year"
I compared the Nimbus 1 data from 1964 with this week's extent and there are plenty of areas that have farther reaching sea ice now than then, out off Ross Sea for instance.. Granted, it is a crude comparison, roughly scaling maps from Charctic, and there are areas of greater extent from 1964.
-
Tom Curtis at 06:39 AM on 26 September 2014The Wall Street Journal downplays global warming risks once again
ChrisK @26, I worked out the figures using the total forcings. To convert to temperature change by 2050, you need to multiply by 0.4-0.55 to convert to the Transient Climate Response. Hence, 0.4-0.55 C based on the figures I used. (Those figures were based on eyeballing a graph, and so are not exact. They are merely close enough for reverse engineering Koonin's claim, I think.)
If the change in forcing has time to reach equilbrium, the effect will be closer to 0.75 C, but that ignores the fact that we are not currently at equilibrium, so that there is another approx 0.5 C already in the pipeline. That then works out as about 3.8% of the current total greenhouse effect in temperature at equilibrium. As that total greenhouse effect is an equilibrium figure, you should compare equilibrium temperature estimates.
That figure, is lower than the equivalent figure calculated in terms of forcing because (a) it ignores the Earth System Response which is also incorporated in the total greenhouse effect figure; and (b) as the temperature rises there is a smaller rise in temperature for each W/m^2 additional forcing. (It is near linear over the range of forcings expected in the near future, but not over the total greenhouse effect.)
-
ChrisK at 06:19 AM on 26 September 2014The Wall Street Journal downplays global warming risks once again
Tom Curtis@9: I am still puzzled by the "1 or 2%" in Koonin's editorial. I have thought that the total greenhouse effect is about 35C and is not that what he means? (Not that the average reader would know or think that.) However, if you say it would really be 5 or 10%, 1.75 or 3.5C more by 2050 sounds, too high and he is talking about the change from now until then, as I read it. 0.35 or 0.7C more by 2050 would seem to be more in the ball park. I am wondering whether these numbers are reasonable.
-
Tom Curtis at 04:45 AM on 26 September 2014It's cooling
Alterna @255:
1) The Earth continues to warm as measured by Global Mean Surface Temperature (GMST). The so called "hiatus" refers to the fact that taken over short time periods, the trend in GMST is not distinguishable from zero. However, it is also not distinguishable from the IPCC projected rate of warming. If the former fact means there is no warming, then by parity of reasoning the later fact must mean we are warming at the IPCC predicted rate. That reasoning leads directly to a contradiction. The correct interpretation is that by our best estimate we are warming at a slightly reduced rate relative to prior periods, but that because of the short term nature of the trend, we are unsure how much the trend has reduced or increased.
2) The unstated assumption of the talk about a "hiatus" is that 1998 (the pivotal year for claims of a hiatus) was a year with a normal, or near normal temperature. If it was not so, determining trends from 1998, or near to but including 1998 is equivalent to a survey claiming the land slopes down as you go inland because most of the land is below the pinacle of a large hill on the coastline. In fact, 1998 was far above the temperature trend of the time, and from 1998 it is not until 2010 that temperatures fall persistently the 1970-1998 trend, as illustrated below:

Of the years falling below the trend after 1998, all have a low MEI score, indicateing La Nina like (or at best neutral) conditions. Using the SOI they are even more strongly La Nina like years. Given this the most natural interpretation is that the ongoing trend since 1970 has continued unabated, and that the "hiatus" is purely an artifact of a transition from a record breaking (or near record breaking, depending on index used) El Nino to a near record breaking (or record breaking, again depending on index) La Nina in 2011/12. If anything, the surprise is why 2011/12 were so close to the continuation of the trend.

The ENSO explanation of the pause is very simply confirmed by seperately taking the trends of El Nino, Neutral, and La Nina years:
The near exact agreement of the trends show that it is the primary explanation of the phenomenon.
It is also essentially the same explanation as the idea that the heat has been moved into the ocean (that being the effect of a shift from El Nino to La Nina).
3) There is also good, and independent indications of reduced forcings over the later half of the purported "hiatus". There is no reason why these two explanations should be contradictory. For all we know, temperature trends may have accelerated without a reduction in forcing, and the ENSO impact. Taking the two sets of information at face value, it would have. We therefore need to judge the evidence of the reduced forcings on its merits and not assume that it somehow renders the ENSO explanation invalid.
-
Tom Curtis at 04:19 AM on 26 September 2014Antarctica is gaining ice
Composer 99 @287, the first to papers you link to study late quaternary (ie, 2.6 million years ago to present) fluctuations. As such they mainly report differences in sea ice extent between glacials and interglacials. Not having read more than the abstracts, I cannot comment on how accurate they are for distinguishing differences in Holocene sea ice extent.
Perhaps more usefull are the proxy studies using MSA in ice cores, which show regional variations in Antarctic sea ice extent. Thus we have Curran et al (2003) showing Antarctic sea ice extent of East Antarctica near Law Dome (80 to 140 degrees Longitude).
-
Alterna at 03:34 AM on 26 September 2014It's cooling
This posts suggests that surface temps are not increasing because the energy is going to another part of earth's energy budget (the ocean). I've also seen the Kaufman, et al. arguments (http://www.pnas.org/content/108/29/11790.full) that the 'pause' in warming is due to less energy entering our system due to a variety of reasons. I'm trying to reconcile the two competing ideas: hidden warming (ocean) versus no actual warming. Can anyone shed light on the current thinking regarding these ideas?
-
Tom Curtis at 02:48 AM on 26 September 2014The 97% v the 3% – just how much global warming are humans causing?
CBDunkerson @108, as a purely technical point, I get uncomfortable calling percentages of agreement below 90% a "consensus". Calling the level of scientific agreement that AGW is likely very harmfull a "super majority", however, underplays the level of agreement considerably and gives a poorer idea of the level of agreement than calling it a "consensus".
More importantly, I did not raise a trivial point. It is important to recognize the difference between rational, and irrational disagreement. Scientists and economists, for example, can rationally disagree with the proposition that BAU over the coming century will likely result in harmfull global warming. That is, there can be rational disagreement with AGW as I have defined it.
I do not think, however, that anybody given current evidence can rationaly disagree with the proposition that BAU over the coming century has a significant risk of resulting in harmful global warming. Nor indeed, can we rationally disagree with the proposition that BAU over the coming century may not inevitably result in harmful global warming. From the IPCC assessments, the lower limit of the likely range for ECS combined with the lower limit of the likey range for risk assessments yields a scenario with minimum harm (and just possibly net beneficial) with a roughly 5% probability of occuring. (With equal probability, of course, we will have a near total disaster.) I do not consider those like Hansen who are on the upper end of those limits, and should not consider those like Tol (at least Tol a few years ago) on the lower edge.
In this respect, disagreement about how dangerous global warming will be is quite unlike disagreement about the probability of warming itself with BAU.
As to "intrinsic" and "closely", while your definition of "intrinsic" is correct, the fact is that judgements of harmfulness and the science of impacts goes well beyond the science of attribution, projections of forcings and determining TCR and ECS. The judgement of whether or not global warming will be harmful is no more intrinsic to the judgement that it will occur than the judgement that an explosive is harmful is intrinsic to the chemistry of the explosive reaction.
-
Tom Curtis at 02:25 AM on 26 September 2014The Wall Street Journal downplays global warming risks once again
Tony W @23, Albert Bartlett's mathematics is correct, but he applies it to the wrong quantities. At least, he applies it to the wrong quantities for projecting potential future growth, although not for busting some of the absurd things that have been said about sustainability of growth based on fossil fuel use.
The reason I can say that is that fossil fuel use is not a primary good. It is not something we do for the pleasure of doing it itself (unless your a Top Gear presenter). Rather, it is something we do to obtain the means to do something else, ie, to cook food, to be warm in winter and cool in summer, to communicate with the world over the internet etc. Energy use is itself not a primary good, but it is a at least one step up the chain.
So, Bartlett's lesson needs to be applied to energy use, and energy consumption if you want to recognize the true limits on growth.
To start doing, so the total energy production of the human race amounts to the equivalent of 0.028 W/m^2. That level of energy generation is not considered a problem in terms of global warming. It follows that if we replaced fossil fuel energy production by some form of nuclear energy production, we could fully supply the world's current needs, and potentially double it without creating more than local problems with regard to waste heat. Unlike the case with fossil fuels, that is production which is sustainable in the sense that the fuels can be sustained for thousands of years, or at least they can with breeder cycles.
That may not be desirable from your point of view. It is, IMO, far preferable to falling back to human and animal power as the only sustainers of our civilazation for the simple reason that doing so will not sustain our civilization, and will not leave the surpluss of resources that is required for growth of knowledge and the bettering of the human condition.
More importantly, however, 0.028 W/m^2 is just 0.012% of total solar power incident on the Earth's surface (allowing for no change in albedo). Taping solar energy allows us to not just replace fossil fuel energy but to meet the energy needs of the probably (not quite) doubling of the human population of the comming century, while lifting global energy use per capita by a factor of 10 to allow the third world to grow economically, and still use only 1% of the global surface for power at 25% efficiency (or 2% at 12.5% efficiency).
Looking at total available energy resources, therefore, we are not even close to the limits on growth.
That does not mean solar energy is a formula for unlimited growth. It is clearly not, and probably allows for continuing growth for another century or two. In a century or two, of course, it may be possible to sustain further growth by moving factories, and food production of world to make use of more sunlight. (Simply directing further sunlight at Earth with mirrors creates the same waste heat problem as nuclear.) At its limit, such a process finishes with the construction of a Dyson swarm (or something further up the technological chain to the limit of a Dyson sphere). Such a process can expand our civilizations potential energy use (and equivalent food production capacity) by a factor of 100 or more over current solar input to the Earth. We need not move other suns to the Solar system (as per Bartlett's thoughtless ridicule), but merely use more of the Sun's total energy output - a process with a limit of approximately 2 billion times the Sun's current energy output (or using only 1% for energy 80 billion times our current energy usage.
I do not know whether or not that will be technically feasible or desirable. That is a decision for a later generation. What I do know is that growth need not, and should not stop now, nor until the rest of the world enjoys a reasonable approximation of current typical western standards of living. And I know that the later is quite possible using solar power.
-
The Wall Street Journal downplays global warming risks once again
TonyW - BC is a significant example in that their introduction of a carbon tax and it's lack of effect on GDP growth indicates that it is indeed possible to grow the economy and address climate change.
I agree that it's difficult to extrapolate from a single region to all situations, but I feel that BC's tax demonstrates a very promising strategy.
Moreover, there is reason to believe that GDP growth and energy consumption are not inextricably linked - Huang et al 2008, for example, found that there was no relationship for low-income countries, a positive correlation for middle-income countries (growth leading energy use, not the other way around), and actually a negative correlation for high-income countries; GDP growth from conservation and energy efficiency. I wouldn't consider that the last word on the subject, but it's pretty clear that the growth/energy linkage isn't as strong as many right-wing pundits would claim.
-
CBDunkerson at 23:53 PM on 25 September 2014The 97% v the 3% – just how much global warming are humans causing?
Tom, sure the level of consensus is slightly lower... but still very high and far far from the 'no consensus' view some 'skeptics' push.
Whether they are "intrinsically" or "closely" connected seems likely to be a largely semantic argument. Indeed, I'd actually describe 'closely connected' as suggesting a stronger link... 'intrinsically' just means that the connection between the two is 'inherent in their nature'. That is, most of the science underlying the two is the same, so anyone familiar with the facts behind one is also familiar with most of the facts behind the other... an intrinsic / natural connection.
-
Firgoose at 22:09 PM on 25 September 201497 Hours of Consensus reaches millions
@John: Talking of personal, or perhaps it's more personable, I really love the way that a 97's hand shoots up and their face lights up, with the smile turning into a big "Me, me! I know the answer!" grin. :-D
And the way that the 3%, having nothing to contribute, frown and avert their eyes. Nice touch! ;-)
You say that "second time around, we'll do things a little differently". Does this mean reusing the same animation or are you planning something different?
One other small question. Maybe I missed it somewhere but what does "nsh" stand for? Is it supposed to be lowercase? With my eyesight I kept seeing is as the equally mysterious "rish".
Response:[JC] nsh - ninety seven hours
Like any riddle, obvious in hindsight :-)
-
MA Rodger at 20:26 PM on 25 September 2014Antarctica is gaining ice
I was intrigued by jetfuel's comment @282 concerning McMillan et al (2014):-
"I did read it, and the bold quote of Tom's from the paper is not visible to me in the report. ... The paper does state that for the period from 2010 to 2013, the avg ice level is falling at 1.9 cm per year and that there is a 105-130 Gt per yr loss of ice mass."
How to make sense of that? The quote is apparently quite promanent within the "report" (as quoted @284) and, with Antarctica being 14 million sq km, an annual 1.9cm fall in ice level would of course result annually in 7mm SLR and 2,660 Gt mass loss. Further the 105-130 Gt figure is not the finding of McMillan et al. and also is not specifically for the period "from 2010 to 2013." This comment from jetfuel is totally nonsensical, something not of this planet.
And so it proved.
I tracked down only one potential source and that is where you would expect to find it - the planet Wattsupia. There, back in May, they gathered all the populus at the feet of an idiot called Larry Hamlin who was greatly angered by the reporting provided by The Guardian about McMillan et al. It is Loony Larry who quotes from McMillan et al. in which he doesn't provide sight of the "bold qulte from Tom." However the 105-130 GRACE figures appear, as does the mention of "the exceptional snowfall event of 2009, which saw an additional ~200 Gt of mass deposited in East Antarctica," just as jetfuel has been banging on about down this thread. And while the "falling at 1.9cm per year" is absent, a 0.19mm SLR contribution is mentioned which presents a possible source of a grossly misquoted figure.And if anyone is in the slightest bit interested by Loony Larry's thesis, it can be summarised thus:- The Guardian is outrageously alarmist. There is no "doubling" of ice loss and obviously so. Does not McMillan et al. state that it' findings are "consistent" with other studies, so it can't have found a doubling. The Guardian confuse "two distinct issues." The "doubling" is not the rate of ice loss but the SLR contribution which has doubled from 0.19mm pa to 0.45mm pa. Of course Loony Larry says it better than I do. When I summarise his argument, I seem to make him sound like a congenital idiot.
-
michael sweet at 20:05 PM on 25 September 2014Antarctica is gaining ice
Jetfuel,
It would be nice if we could use the rate of ice loss from three years ago as the rate loss for the future. Unfortunately, the data MA Rodgers provided at 279 shows a continually increasing loss of ice. You must include the rate of increase of ice loss. Then we see that it will not be so long before Miami no longer drains after heavy rains. Your fact free ramblings are not convincing.
-
TonyW at 15:18 PM on 25 September 2014The Wall Street Journal downplays global warming risks once again
CBDunkerson
Albert Bartlett's lecture can never go out of date (other than the data used to illustrate points) because it's based on maths and physical realities. Growth destroys the environment, as we've seen, but growth can't continue indefinitely, even if we could figure out how to grow without destroying the environment. The price of solar energy is irrelevant to this, though I doubt the world could convert to solar, due to resource issues and emissions of solar panel production. If it could, the world would have to operate on a much lower EROEI, so growth would end anyway. Kevin Anderson's analysis hasn't been shown to be in error either. By 2020, it will be obvious that either nothing will be done about the problem or that doing something about it unacceptably harms economic growth.
KR,
As I understand it British Columbia was already on a downward track with emissions, before introducing that tax, so it's unclear what the impact of the tax has been, or how it has affected emissions in surrounding regions. However, BC is not the world. I'd welcome a revenue neutral carbon tax but it isn't likely, on it's own, to reduce emissions by the 10% per year needed to have half a chance (not 100% chance) of not exceeding the very dangerous level of 2C, though we'd breeze through the dangerous level of 1C.
Prev 666 667 668 669 670 671 672 673 674 675 676 677 678 679 680 681 Next


