


 Arguments


Recent Comments
Prev 669 670 671 672 673 674 675 676 677 678 679 680 681 682 683 684 Next
Comments 33801 to 33850:
-
2014 SkS Weekly News Roundup #38B
Deniers -either deliberately or through ignorance - confuse temperature (by which they usually mean atmospheric temperatures) with heat. Since the heat budget is what really matters in all but the short term, the denial side gets an easy ride on this point because any weather related scenario can occur regardless of the way the heat content of the planet itself is increasing.
-
Tom Curtis at 08:30 AM on 22 September 20142014 SkS Weekly News Roundup #38B
giulio8 @4, Lubos Motl is "considered" a physicist because he has a PhD in physics and has made contributions to string theory. He even, for three years, held an Assistant Professorship at Harvard. None of that has any bearing on whether or not he is in denial about anthropogenic changes to climate.
On the other hand, he has political opinions so right wing that he wrote regarding the mass murder of young Norwegian members of the labour party:
"At any rate, I don't think that today, in 2011, there exists a problem in Europe that could even remotely justify the killing of dozens of this young people who attend a summer camp. ... I may speculate and I often speculate about the future in which tough decisions may have to be made to avert threats that are worse than anything we are seeing today but this mass murder didn't occur in the future. It occurred a few days ago and given this fact, it's unforgivable."
Do not over interpret that. He also wrote (in the space of the elipsis), "Sorry but this looks unforgivable to me - unforgivable at the level of a death penalty which doesn't exist in Norway" and earlier wrote:
"The mass murder itself remains shocking for me. It is both scary as well as incomprehensible. I just don't understand what the young people affiliated with the Labor Party who are having fun on some summer youth camp - and perhaps some random people on the street of Oslo - have to do with all the ambitious political plans. They were innocent children and young people, weren't they?"
So like any decent person he was shocked by Breivik's horrific acts. But not so shocked that he could not see a legitimate political role for them in the future.
I will state categorically that there is no political trajectory from any center left (or center right) party in Europe that would ever justify taking up arms against it; and no trajectory from any party ever that justifies murdering civilians as the primary target of the attack. Ever!
That Motl can contemplate current political trajectories in Europe as, in the future, justifying such acts shows him to be contemptible, and his thought on politically related matters (including on science that touches on politics) to be beneath contempt. As with Monckton, the fact that the climate denier community do not disown Motl shows how low they have sunk.
-
Tom Curtis at 08:09 AM on 22 September 2014The 97% v the 3% – just how much global warming are humans causing?
MA Rodger @79, mindful of the context of the discussion, I will note that by 1700 there is already a significant ongoing decline in δC13, and hence already significant evidence of increasing anthropogenic forcings:

Indeed, the rate of decline of δC13 does not change significantly until at least 1900 although I very strongly suspect that conceals a switch from LLUC to fossil fuels as the primary source of emissions over that period.
With regard to Ruddiman's hypothesis, knocking out the declining δC13 does knock out a major evidentiary support for his theory making it far more controversial than I had supposed. He does, as you note, have an auxilliary hypothesis. That auxilliary hypothesis is plausible, and has some evidence in support in that Elsig et al 2009 does appear to use a low estimate of peat burial. Ruddiman et al (2011) write:
"A second argument for rejecting the early anthropogenic hypothesis has been the small amplitude of the negative δ13CO2 trend during the last 7000 years. This constraint was thought to limit total emissions of terrestrial carbon to the atmosphere (including those from anthropogenic sources) to at most 5 ppm. In compiling their carbon-isotopic mass budget, however, Elsig et al. (2009) chose a value for late-Holocene carbon burial in boreal peat deposits of 40 Gt, which falls below most published estimates. A new estimate of just under 300 GtC from Yu (2011, this issue) is close to earlier estimates by Gorham (1991) and Gajewski et al. (2001). This much greater carbon burial in boreal peat over the last 7000 years, combined with model-based constraints on carbon exchanges from other natural processes, requires much larger anthropogenic emissions to balance the δ13CO2 budget (Table 5)."
Taken at face value, that means human preindustrial emissions from the Holocene climactic optimum are in the order of 260 GtC, or approximately half of their emissions in the industrial era. That is consistent with an anthropogenic increase in CO2 of 20 ppmv over the last 8000 years to 1750. (For those not familiar with the carbon cycle, over periods of thousands of years, only 10-30% of emissions remain in the atmosphere depending on the amount of emissions.)
Returning to the context of the discussion above, my take on Ruddiman's hypothesis is that the basic idea must be true in principle, in that humans did start about 10,000 years ago undertaking activities which increased CO2 and CH4 emissions such that they increased atmospheric concentrations relative to what they would otherwise have been. What is being argued about is whether that increase amounts to 5% or 100% of the increase in CO2 over that time. Therefore the assumption that preindustrial changes in temperature are entirely natural is unwarrented. However, I must revise down my current estimate of how much anthropogenic factors reduce the millenial scale cooling trends since about 8000 years ago.
-
From Peru at 07:53 AM on 22 September 20142014 SkS Weekly Digest #38
310 000 people in New York ....
... 4 orders of magnitude less people in my district.
I hope that elsewere in my city (Lima, Peru) there were better results.
-
giulio8 at 07:25 AM on 22 September 20142014 SkS Weekly News Roundup #38B
correcting the above link: http://disq.us/8k6vfe
-
giulio8 at 07:23 AM on 22 September 20142014 SkS Weekly News Roundup #38B
How can a denier like Motl be considered a physicist
and continue insulting people aware of the greenhouse effect?
Look at his ignorant reply to my comment -
MA Rodger at 05:58 AM on 22 September 2014Antarctica is gaining ice
jetfuel @266.
It is difficult to know when you talk of "the turn around in the Arctic" whether you are proposing the reversal of the trends of the last 30 years or that the winter freeze has arrived.
This "number of days in the year when sea ice area was increasing at both poles" you talk of - why do you pick on 1994? Indeed, why this annual statistic? A quick bash at the SIA data shows those 'numbers of days' are not very relevant to levels of SIA & SIE for those years. Why then do you feel the statistic is worthy of the diodes recording them?
-
MA Rodger at 05:47 AM on 22 September 2014The 97% v the 3% – just how much global warming are humans causing?
Tom Curtise @78.
Perhaps we use the word "controversy" differently. When a theory has a whole list of stuff to overcome (like Rudiman's theory gets in AR4 Section 6.1.5.2), that is when I would consider aspousing such a theory "controversial."
I was of the understanding that the isotope data (eg from Elsig et al 2009) was a problem for Ruddiman's case was as yet unresolved. Elsig et al. Figure 1. of data from Dome C cores shows no fall in C13 as required for biosphere emissions. Ruddiman in his 2011 paper did respond with a peatland argument but that draws the whole early Holocene carbon cycle into the equasion rather than put the matter to rest. I note Ruddiman's latest presentation of his theory (Ruddiman et al 2014) remains silent on any isotope issue.

My sympathy for the Ruddiman theory perhaps rests on not knowing how agriculture developed. I tend to find the human population (gu)estimates are quoted with more credence than they deserve and feel a low figure is worthy of more consideration. A small population is one of the things leveled at Rudimman. How can so few illiterate prehistoric humans armed with only a stone axe be so much more effective at CO2 emissions than the illiterate 4x4 owners today? I think due consideration would show it is far from impossible for a small population using fire and perhaps even hunting to make a big impact on CO2 emissions (averaging 30 MtC over the period) and which appear to be up to speed very quickly as sedentary agriculture had only just begun.
-
John Hartz at 02:41 AM on 22 September 20142014 SkS Weekly Digest #38
The New York Times is providing continuous coverage of the Climate Change March in New York City via the following article:
Climate Change March Begins in New York City

-
Jeremy C at 01:12 AM on 22 September 20142014 SkS Weekly News Roundup #38B
Its very interesting that in Australia (apologies for this post being Aus-centric) before this news came out about 2014 the deniers have been running this ruse that Australia's Bureau of Meteorology weather station records can't be trusted. Its almost as if they knew they wouldn't be able to keep up the ruse about the world not warming for the past how-many-years and this latest ruse is very well timed to blunt any data coming out about rising temps.
You might call me paranoid but if I was a denier its what I would do. -
Tom Curtis at 00:43 AM on 22 September 2014The 97% v the 3% – just how much global warming are humans causing?
MA Rodger @77, if his case were established "beyond ... controversy" I would have called it an overwhelming case. IMO, the chief points in Ruddiman's favour are that CO2 levels have risen while global temperatures have fallen from the HCO. Absent significant emissions into the atmosphere from a terrestial source, that is not possible (as colder water absorbs more CO2). Further, at the same time deltaC13 has also risen indicating the the excess CO2 has come from plants:

The mechanisms whereby humans can cause such a change, deforestation, increased rice agriculture (leading to increased methane production from C12 enriched sources), and increased cattle grazing (same as rice production) definitely have that effect. The question is whether they have been sufficient to account for a significant proportion of the effect, or whether natural deforestation (as with the Sahara) or increases in wetlands are to blame. I think the case for the former is significantly stronger than the later, in part because while interglacials can vary, it would be a remarkable coincidence for this interglacial to vary on just this point immediately following the invention of agriculture.
-
Tom Dayton at 00:28 AM on 22 September 2014We're heading into an ice age
The link to Archer 2005 is stale. Here is a new location of that paper: http://geosci.uchicago.edu/~archer/reprints/archer.2005.trigger.pdf
-
Tom Curtis at 00:22 AM on 22 September 2014Antarctica is gaining ice
jetfuel @266 says:
"Meanwhile, The Antarctic ice level far surpasses the level at this time at 10, 20, and 30 years ago. Since the turn around in the Arctic has already happened so Ice area is increasing there too, while the Antarctic is well into unchartered territory in increased area covered by sea ice, ..."
It is true that the Antarctic Sea Ice anomaly is greater than at any time in the last thirty years, but even my history goes back longer than that - let alone the Antarctics. So, let's look at the charted sea ice extent from the HadISST database, as plotted by Tamino:
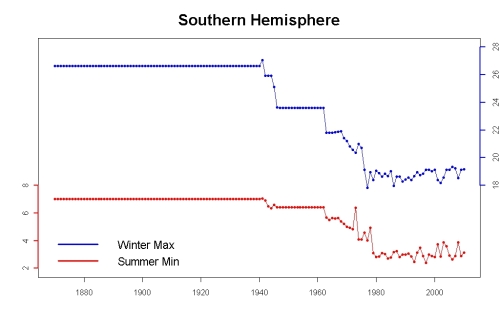
Of course, that is a little out of date. The current data (Sept 20th, 2014) is at 20 million square kilometers. Uncharted for the satellite era, certainly - but uncharted simpliciter? That you choose to forget history does not mean it does not exist.
Or we might compare the August 2014 sea ice extent to a 1904 estimate of winter sea ice extent, which is shown extending as far north as South Georgia:

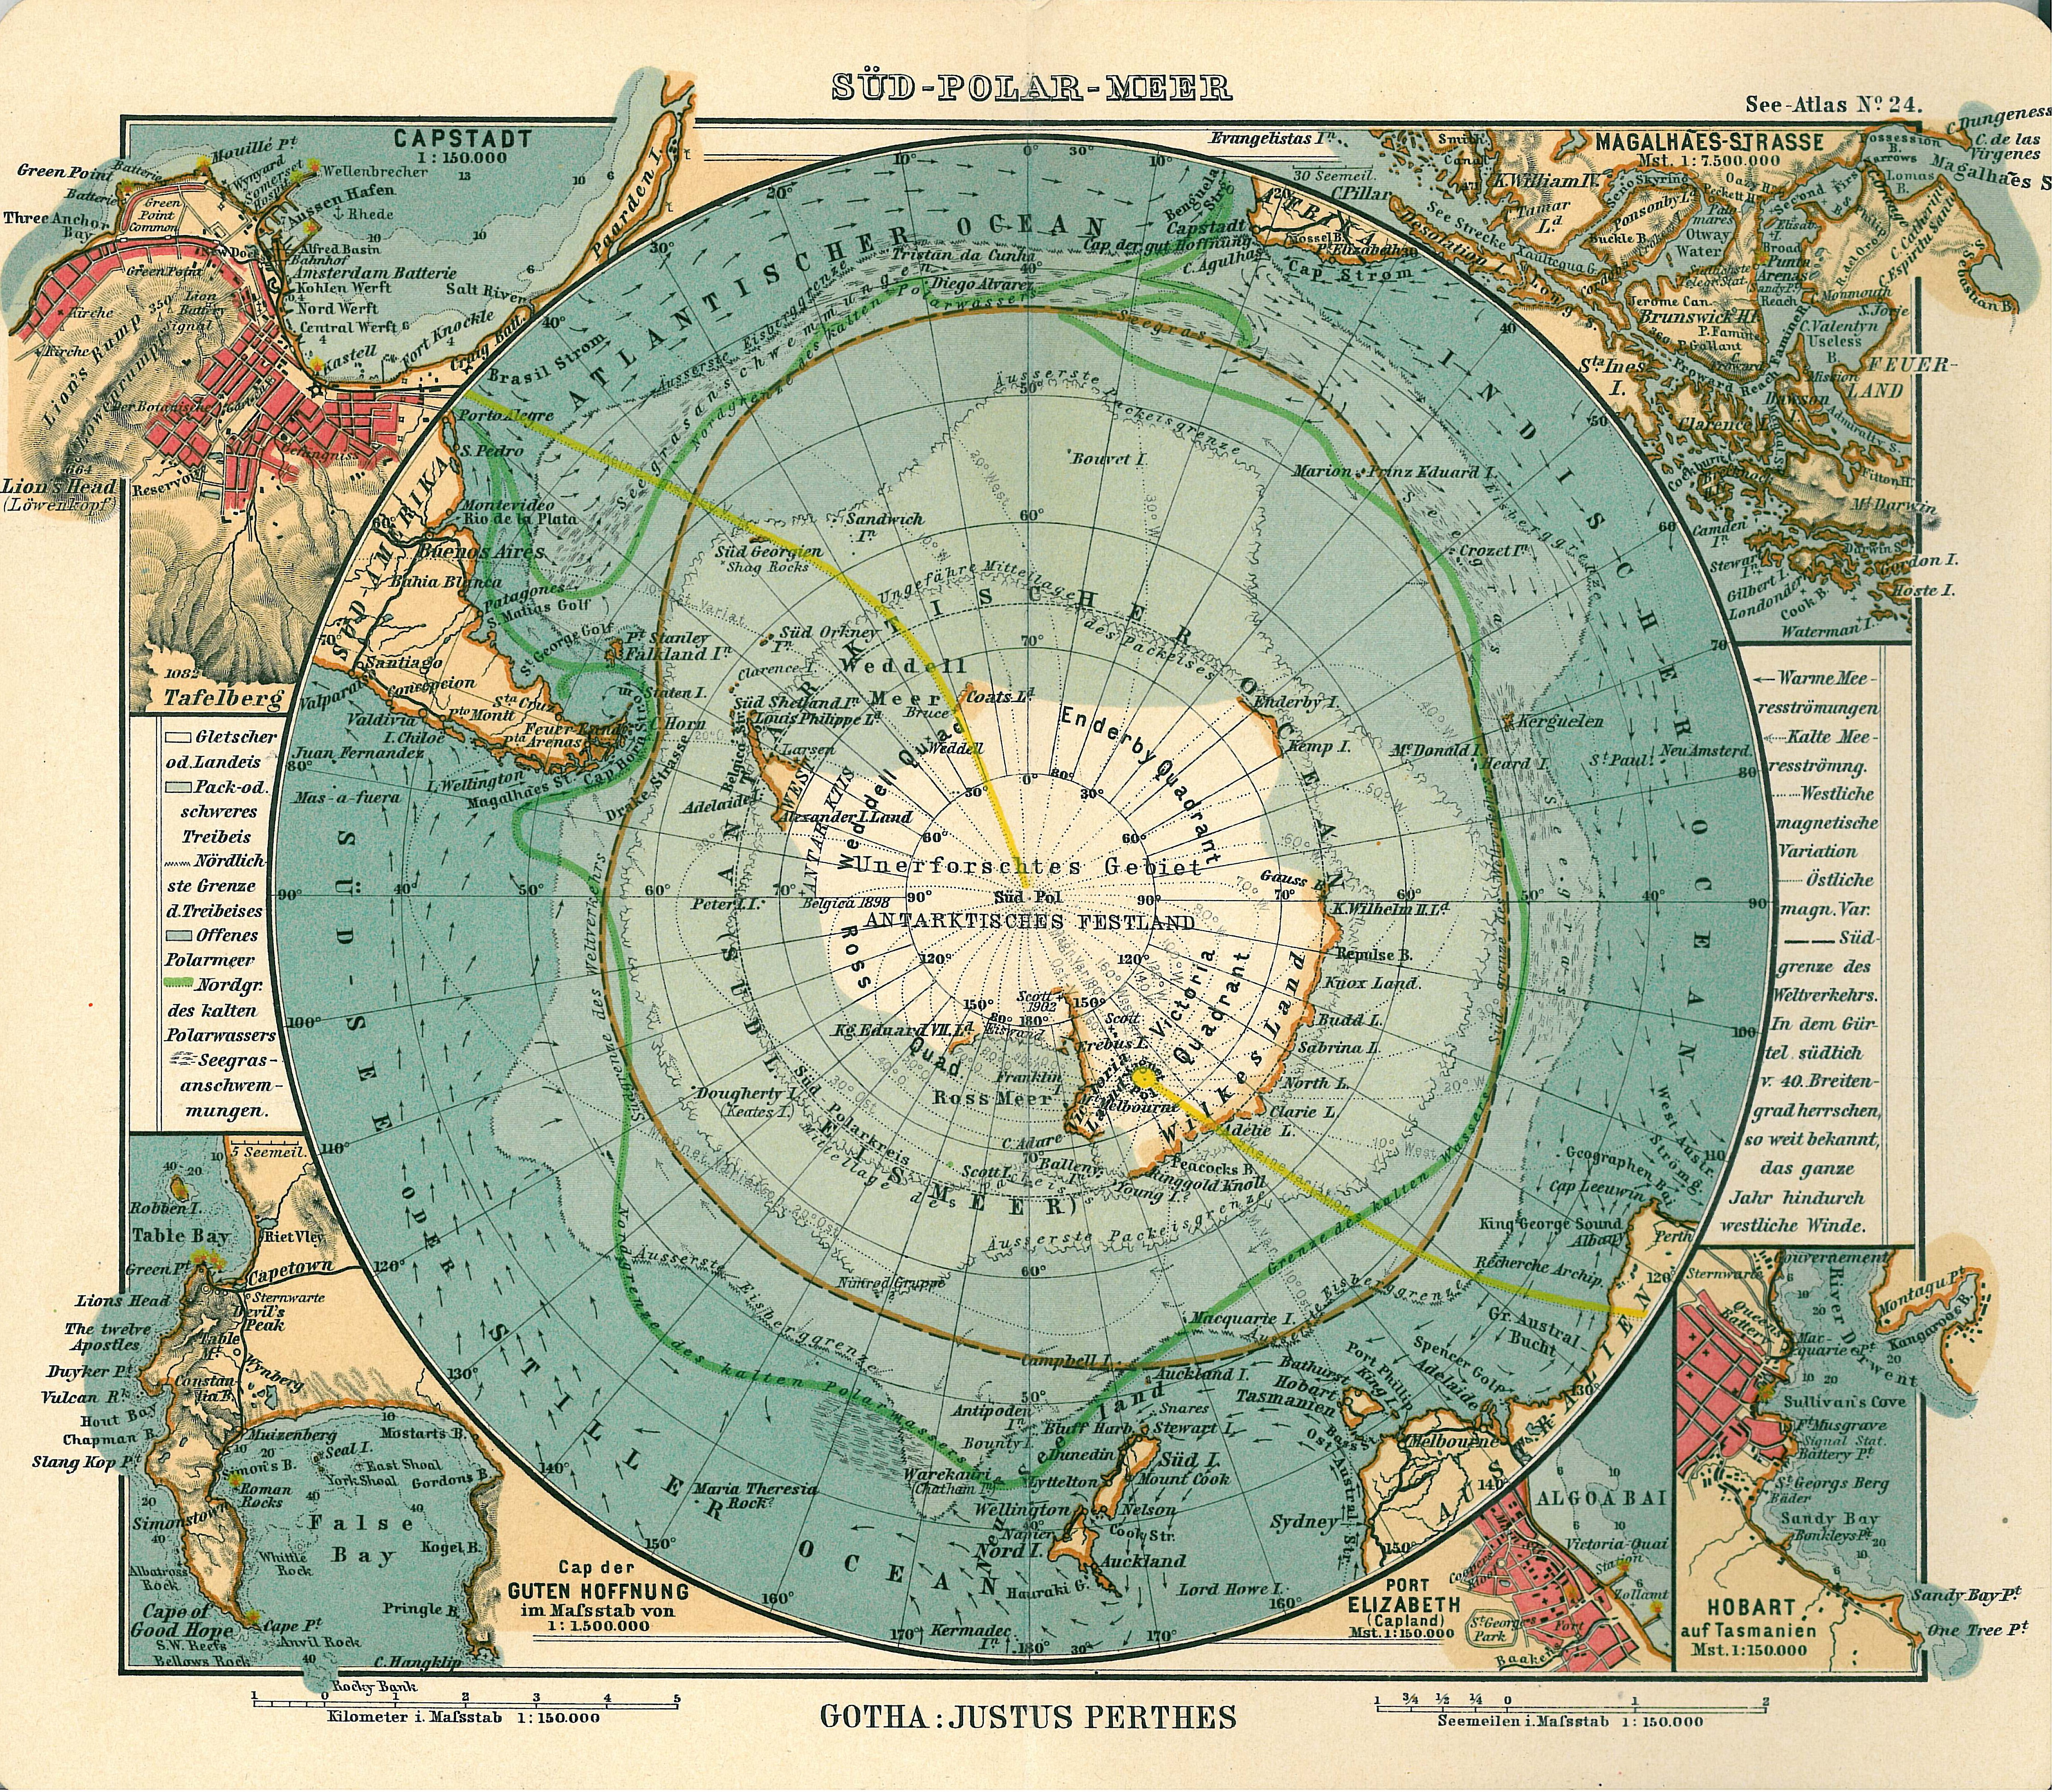
So, Antarctic sea ice extent is in uncharted territory, but only if you are carefull not to look at charts that might bust your pet theory.
-
MA Rodger at 23:53 PM on 21 September 2014The 97% v the 3% – just how much global warming are humans causing?
Tom Curtis @72
Some interesting points being made in recent comments here (I always enjoy a good AMO discussion) but I was surprised to read "Ruddiman mounts a very convincing case..." I didn't think his case has established itself beyond being an interesting controversy.
I'm not averse to the idea that a few hundred thousand humans in pre-history could have been responsible for CO2 & CH4 levels by some means as Ruddiman suggests they did and that the Holocene ice cores yield data that looks a lot different to the Eemian and other interglacials.
But surely the "means" suggested do remain speculative and interglacials are not expected to be carbon-copies of each other. Or have I missed something? -
Tom Curtis at 23:50 PM on 21 September 2014Deciding who should pay to publish peer-reviewed scientific research
Ashton @15, I don't know which Tom Curtis you are responding to, but it is certainly not me. I suggest you read my post @14, which you probably did not see before posting your comment. It makes it quite clear, however, that you are arguing against a strawman. Specifically, I do not disagree with open access. Indeed, I am strongly in favour of it. What I disagree with are specious arguments that we, as taxpayers, are already entitled to open access without having made specific legislative and funding provision to support it.
-
Tom Curtis at 23:14 PM on 21 September 2014The 97% v the 3% – just how much global warming are humans causing?
michael sweet @75, the change in CO2 is a drop from approx 282 ppmv to 274 ppmv, which would entail a negative forcing of 0.15 W/m^2, which would correspond to a 0.06-0.18 C temperature influence over centenial scales, with a 0.12 C influence for a climate sensitivity of 3, taking about 200 years to approach the full impact. That in turn is about a fifth of the total temperature change from the MWP to the LIA.
It is a matter of scientific dispute as to the cause of the decrease in CO2. I lean to the theory that it is temperature related. That is, as global temperatures fall, oceans absorb more CO2 thereby lowering global atmospheric CO2 concentration. Such a process would make little change to the C13/C12 ratio in atmospheric CO2. I have only read the abstract, but this article appears to support such a cause for the fall in CO2 levels. However, other causes have been proposed, including increases in wetland areas, and, as you mention, depopulation in the Americas due to disease brought by European colonists (for which I cannot find a suitable reference).
Against the last proposal, I would note that the Americas are only one part of the world and deforestation was occuring in Europe and potentially other places in the world at the time; and further, the lost farmlands had not denuded the forest as with modern agriculture, but formed a patchwork within the forest so that the impact may have been less than suggested.
However, I cannot claim to be well informed on this topic so beyond noting that there are alternative theories, I do not think I can really help you.
-
Antarctica is gaining ice
jetfuel, what are you trying to dance around? Do you have a point?
Btw, Arctic sea ice area minimum for 2014 is less than SIA minimum for 2013 (3.554m km2 vs. 3.483m km2). If you're going to use a one-year change to claim "recovery," then what do you do when the next one-year change reverses the sign? The summer minimum linear for Arctic SIA from 1979-2006 (the year before the 2007 collapse) is -47,592 km2. The same for 1979-2014 is -69,590 km2. Between 1979 and 2013, there are 15 years where SIA exceeds the preceding year. Most importantly for the sake of your dance, reality is about 50 years ahead of model expectations for Arctic decline. Call me when the ten-year linear is positive. Maybe I'll listen.Also, if you don't think wind patterns, wind speed, and salinity have anything to do with Antarctic sea ice growth, by all means provide the physical mechanism through which these forces are rendered powerless.
-
jetfuel at 22:40 PM on 21 September 2014Antarctica is gaining ice
Scaddemp, In your rebuttal to my comment about 2012 conditions being used as a rebuttal to what is happening today in the Antarctic, you point to articles written in 2012 about what happened in 2011. Further removed from recent happenings.
Meanwhile, The Antarctic ice level far surpasses the level at this time at 10, 20, and 30 years ago. Since the turn around in the Arctic has already happened so Ice area is increasing there too, while the Antarctic is well into unchartered territory in increased area covered by sea ice, I expect another very cold winter just south of the Great Lakes. The Arctic turn back up of ice area happened already and did so only 3 days later than last year.
In combining the number of days in the year when sea ice area was increasing at both poles at the same time, this happened for 41 days in 1994 (20 years ago). So far this year, it has been happening for 36 days and surpassing the 20 years ago mark looks easy considering 6 more days will do it. All totalled, there was about 980,000 km sq more sea at these times in 1994 than today, out of 27M, that is less than 4% less. This .98M difference is falling each day, as The Antarctic just passed 20M with a half million increase just in the last week. The vaguery of "shifting wind patterns" is proposed as the reason why we are about to have more sea ice than 20 years ago even though the oceans are supposedly the warmest since 1900. All this while state legislatures fight over sea level rise extrapolation methods that amount to less change in 1000 years than an annual but rare moon caused tidal change that happened this summer.
Sea ice data from nsidc charctic
Moderator Response:[Rob P] - Perspective is important here. A back-of-the-napkin calculation by myself, using middle-of-the-road estimates, shows that the annual average rate of global ice volume loss over the last decade is around 50 times greater than the increase in Antarctic winter sea ice. So the fact that Antarctic sea ice is increasing doesn't challenge our observations that the world is warming in a largely coherent manner - which we would expect given the increasing greenhouse effect.
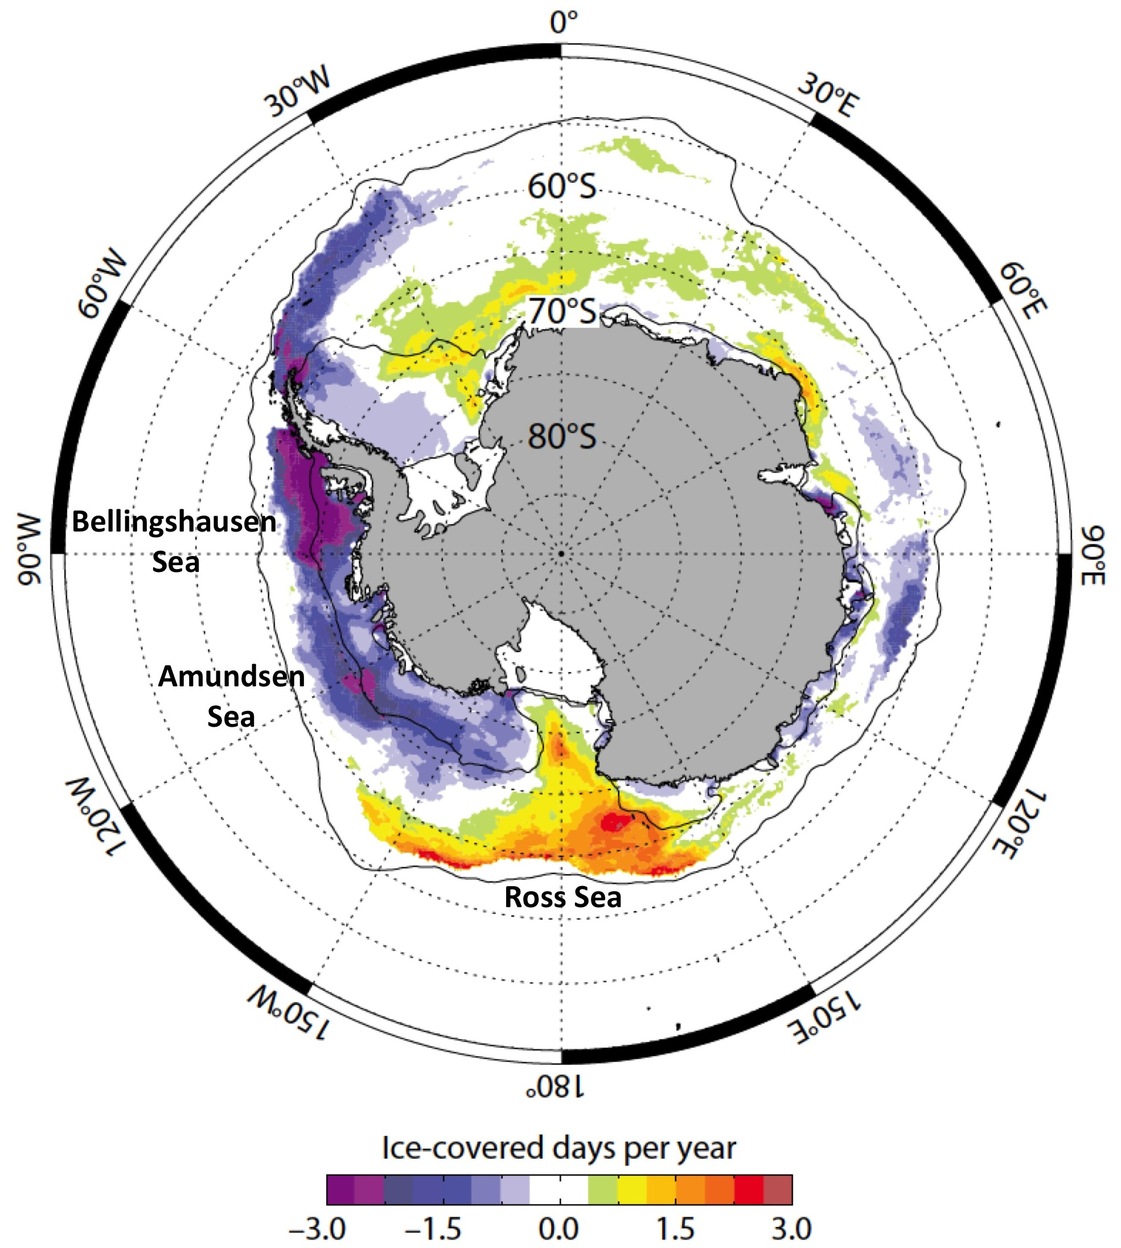
Trends in Antarctic sea are very patchy though, strong losses in some areas, but overcompensated by gains in other areas. Indeed, the growth areas appear to be in the vicinity of the Weddell and Ross Sea polar gyres - where divergence at the surface pulls cold water up from the deep. This will likely weaken when the Interdecadal Pacific Oscillation (IPO) switches to its positive phase in the coming years. So it will be interesting to see how the gyres respond, and what effect this has, when this phase switch occurs.
The image below is from Maksym et al (2012):
-
John Hartz at 22:05 PM on 21 September 20142014 SkS Weekly News Roundup #38B
nigelj:
Also see:
El Niño is Kinda Sorta Maybe Here by Brian Kahn, Climate Central, Sep 18, 2014
-
michael sweet at 21:56 PM on 21 September 2014The 97% v the 3% – just how much global warming are humans causing?
Well if you want to get schooled in the data on a subject just make a comment to Tom!
Thank you for the data on long term forcing. It appears that over centuary spans natural forcings exceed human forcings.
Do you know if data supports the claim that the decrease in CO2 around 1550 (from your post 72) was caused by the collapse of Native American Indian populations due to the introduction of European diseases (and subsequent reforestation of their farmlands)? How much did this decrease in CO2 change the temperature (if the sensitivity is 3.0) over the next 250 years before the CO2 concentration rose again?
-
Dikran Marsupial at 19:25 PM on 21 September 2014Deciding who should pay to publish peer-reviewed scientific research
Ashton, as to your final question, the answer is here.
Most journals these days allow authors to self archive (i.e. put on their website) a pre- or post-print of the paper. So even with commercial publishers, it is not generally the case that publically funded research findings are not freely available to the public.
The next point is that the public gets for its tax dollars only what it pays for. If society decides that they want papers/data to be freely available, then that is an extra cost and they need to pay some extra tax to cover it. This is rather like the problem with the availabilty of national weather service data. The data has commercial value, so governments generally decided that national met offices should exploit this commercial value to cover some of the costs of its collection and so reduce the burden on the taxpayer. Now people are demanding free access to the data (not that they actually do anything useful with it), which means that the tax payer must now make up the shortfall in the met offices income caused by not being able to commercialise their data.
RCUK make the funds available via a block grant to each university, so it doesn't actually appear as a cost on grant proposals anyway (I am not convinced that is a good idea).
As regards predatory open access journals, the UK's Research Excellence Framework (REF) grades research output into five gradings from "four star" (Quality that is world-leading in terms of originality, significance and rigour) through to "one star" (Quality that is recognised nationally in terms of originality, significance and rigour), and "Unclassified Quality" (falls below the standard of nationally recognised work). Work published in such journals is unlikely to get a three or four star rating, and hence there is a big disincentive to publish there, as the funding is likely to be non-linear with proportionally more funding directed at the departments with a higher average grade.
If you want to see how open access should operate, take a look at JMLR.
-
Ashton at 15:15 PM on 21 September 2014Deciding who should pay to publish peer-reviewed scientific research
Tom Curtis Your rather hard line stance on journal publication is likely to enhance rather than diminish the proliferation of open access journals. I'm not sure if you have ever applied for a grant but if you put in a line requesting funding of, say, $1000 for future publications. you might well jeopardise or at least feel you are jeopardising, your chances of obtaining a grant as money is very tight and grants are very competitive. As an academic who applies for reserarch funding, I can assure you that an application has to include a substantial portion of funds requested for the University and very rarely does this portion cover publication costs. But Tom Curtis, Universities wax fat on the efforts of researchers as their success in attracting grants adds to the public profile of the university. This in turn. attracts more students and thus leads to more income. Similarly journals wax fat on the research papers they receive and for which they levy a charge on the researcher as without these papers, they are as nothing. So Unis charge researchers so they can attract and charge more students and journals charge researchers so they can attract and charge more readers Can you not see what an invidious system it is and why open access journals are regarded by the "establishment" as the "spawn of the devil"? Sure, looking at the publishers of open access journals lambasted by Jeffrey Beall he certainly has a point. However to condemn open access because at the moment it is far from ideal is not the best approach at all. It would be better to get these journals to meet the necessary standards. A way this might be achieved is to adopt/adapt the approach of the mass media to support the costs of on line publication such as judicious use of advertising. As an aside, is it pertinent or indeed impertinent, to ask if bringing SkS to readers incurs charges and if so to ask how these charges are met?
-
Tom Curtis at 12:29 PM on 21 September 2014The 97% v the 3% – just how much global warming are humans causing?
michael sweet @70, I don't think your argument holds. Specifically, while anthropogenic forcing has been a factor since 6000 BC (as can be seen by the rise in CO2 from that time in the first figure @72), that influence has been small and gradual such that natural variations have dominated the trends on a centenial scale up till 1850 at least. That can be seen clearly from the forcings of the industrial era (1750 onwards):

Clearly the volcanic forcing dominates in the early 1800s (and as it happens, the early 1700s) so that the rise in temperature over the 19th century is primarilly due to the reduced volcanism. As late as 1940, the strength of volcanic forcing effectively equals that from GHG, so that for the rise in temperature in the early twentieth century, anthropogenic factors only contributed about a third.
For earlier periods, volcanic forcings are also dominant on century scale trends. The temperature contribution of various forcings is shown by Cowley 2000 (click here for clearer image):

Blue is volcanic, pink, green and gold are three proxies for solar activity, red is GHG and blue are tropospheric aerosols. A climate sensitivity of two is assumed, but the fit is to MBH 98 which is known to understate climate variability.
Here are more recent treatments, from AR4:

And from a 2014 comparison of NH forcings with the AMO:

The abstract of the later (Knudson et al) is worth reading:
"The Atlantic Multidecadal Oscillation (AMO) represents a significant driver of Northern Hemisphere climate, but the forcing mechanisms pacing the AMO remain poorly understood. Here we use the available proxy records to investigate the influence of solar and volcanic forcing on the AMO over the last ~450 years. The evidence suggests that external forcing played a dominant role in pacing the AMO after termination of the Little Ice Age (LIA; ca. 1400–1800), with an instantaneous impact on mid-latitude sea-surface temperatures that spread across the North Atlantic over the ensuing ~5 years. In contrast, the role of external forcing was more ambiguous during the LIA. Our study further suggests that the Atlantic Meridional Overturning Circulation is important for linking external forcing with North Atlantic sea-surface temperatures, a conjecture that reconciles two opposing theories concerning the origin of the AMO."
So, while I agree that the increase since 1600 has an anthropogenic component, and that the dominant cause of that increase has been changes in forcing rather than internal variability (as jwalsh requires), I think it misreads to the data to think that it was primarilly anthropogenic. Of course, as I have argued above, just the dominant forced component is sufficient refute jwalsh, who requires not just that the increase be natural (for natural forcings have been accounted for in the assessment), but that it be predominantly due to internal variability.
-
michael sweet at 10:16 AM on 21 September 2014The 97% v the 3% – just how much global warming are humans causing?
Tom,
It seems to me that if jwalsh (sorry for the previous reference to Russ) wants to claim that there may be significant increase in temperature recently due to natural causes he has to show that humans have not been responsible for the increase in CO2 and temperature you document over the past 8000 years.
He claims "it seems at least plausible that we're still (since 1600 or so) in an upward natural trend that would shift the value for the natural component up in figure 10.5."
If Ruddiman is correct, and he has peer reviewed papers to support his claims, than any increase since 1600 was AGW, not natural. The natural forcing since 1600 was negative, not positive. Vague natural cycles are hand waving.
The long term natural forcing for the past 8,000 years is cooling, not warming. All warming, plus the additional cooling that would have occured naturaly, is AGW. Perhaps jwalsh can provide data to support his claim that natural forcings have been positive. I doubt he can provide such data for any time period greater than 100 years in the past 8000, because the natural forcing is cooling.
-
nigelj at 08:17 AM on 21 September 20142014 SkS Weekly News Roundup #38B
Thankyou for the article. If 2014 turns out to be the hottest year on record, or even just in the top three, while being a weak el nino or just a normal year this all strongly supports the entire globaly warming theory.
What mystifies me is why we have not had a decent el nino for some time. is the warming trend changing the frequency of the el nino? This seems possibe given el nino relates to ocean currents, and extra heat energy is being pumped into the oceans.
Would theory or modelling suggest fewer but maybe larger el ninos?
Moderator Response:[Rob P] - the wind-driven ocean circulation in the Northern Hemisphere has spun down. This means the poleward export of heat from the tropics is weaker-than-normal. Now you might expect this to cool the mid-to-high latitudes, but that's not the case. Why? Because the subtropical gyres are areas of convergence (downwelling) and the subpolar gyres areas of divergence (upwelling).
With strong tropical trade winds and mid-latitudes westerlies, there's a greater volume of heat transport out of the tropics, more heat is mixed down in the subtropical gyres, and more cold water drawn up to the surface in the subpolar gyres. Guess what happens when the winds weaken? The reverse - weaker transport of heat out of the tropics, weaker downwelling of heat in the subtropical gyres, and warming of the subpolar gyres as less cold water is drawn up from the deep there.
What we're seeing with the record sea surface temperatures, is largely confined to the Northern Hemisphere. If this spreads to the Southern Hemisphere, and the whole system spins down, we're entering probably entering the positive phase of the Interdecadal Pacific Oscillation (IPO). Something worth keeping an eye out for. Still early days though.
-
One Planet Only Forever at 07:58 AM on 21 September 201450 Canadian climate researchers speak out in support of the People's Climate March
Not only is Canada suffering a national sustainability deficit, the vast majority of the problem is what is from going on, and hoped to be expanded, in Alberta. Alberta produces a lot of electicity from coal. And it also does the more absurd thing of burning natural gas to make heat as well as electricity to extract the bitumen from the oil sands.
And the stuff they want to sell out of Alberta is intended to be processed and burned by some other nation. And those extra-national impacts are not 'counted as Canada's'. And processing the stuff from the oil sands to a refinable grade of oil generates petroleum coke. And that petcoke is worse than coal and is also sold to be burned (mountains of it near Chicago are moved out of the US as a cheaper alternative to coal).
So Canada' production of trouble is far more than what the 'accountants stiving to figure out ways to make Alberta look good', which includes Canada's PM, want to count.
-
Tom Curtis at 05:16 AM on 21 September 2014Deciding who should pay to publish peer-reviewed scientific research
Andy Skuce @13, I agree that free public access to scientific research would be very desirable. I disagree that that desiderata is a right based on tax payer funding. That becomes obvious not just from comparisons with CIA documents, but with government information generally. Even data which is publicly accessible by legislation will still attract a fee based on costs of accessing the data in FOI requests. Some people may consider that a bad thing, but the alternative is to allow government departments (or researchers) to be paralyzed by frivolous FOI requests that are paid for by the department or researcher. A $35 fee for a paper is a very reasonable value relative to that for most FOI requests.
Nor, does government funding transfer intellectual property rights. That is, the intellectual property rights on the research remains that of the researcher - and ought to do so. You tacitly acknowledge this in making an exception for publicly funded research by private corporations.
If we think free public access to research is a good thing, then we need to get our representatives to set up and fund institutions that provide that service. Personally, I think that should be done by funding public accessable journals, with grants to such journals based on their impact factor (or impact factor relative to specialization) so as to discourage the development of a vanity press in science. Further, the grants should be sufficient to provide a small stipend to editors and reviewers based on the impact factor of published papers (ie, rewarding quality over quantity) to attract the highest quality editors and reviewers to the public access journals. Further, existing private publishers should be invited to transfer there journals to a public access model on the same funding basis as journals set up specifically for that purpose.
What ever the model pursued, however, we need to recognize that there are issues relating to international cooperation, and potential pitfalls. We also need to recognize that this is a new service from government that we are requesting, not one that we already have a right to.
-
Tom Curtis at 04:52 AM on 21 September 2014The 97% v the 3% – just how much global warming are humans causing?
michael sweet @71, Ruddiman mounts a very convincing case that human generated GHG emissions from land use change have prevented a significant decline in global temperatures following the "Holocene Climactic Optimum" 8000 years ago.
However, the conventional end date of the pre-industrial era is 1750, not 1900. It is 1750 for a reason, specifically that from 1750 human emissions commence their near exponential growth, although the resulting increase would not emerge from the noise caused by changes in CO2 concentratrion due to changes in global temperatures for about 100 years after that:


-
Tom Curtis at 04:34 AM on 21 September 2014Climate sceptics see a conspiracy in Australia's record breaking heat
scaddenp, one of the denier's chief arguments is that a scientist who had worked at Rutherglen said that there had been no site moves, a claim also picked up by the Australian. As noted above, according to the BOM the site move indicated by the BOM occured between 1958 and 1975, and is likely to have occured in 1966. You have linked to their conclusive evidence that such a move took place.
What, then, of the contradiction with Bill Johnston's eye witness testimony?
It turns out, in comments at The Conversation, that he "... had collaborative work there for 4 or 5 years". When asked which years, he responded:
"In the late 1990's to early 2000's, which is irrelevant to whatever point you are labouring."
So, he visited periodically (collaborated) from a period starting in 1995 at the earliest, a point he considers irrelevant to his being quoted in national media and all over the blogosphere as an eye witness that there had been no station move between 1958-1975.
It turns out, by the way, that he is also denies that there has been any sea level rise over the twentieth century. As the saying goes, "Once you go over the the darkside (or pseudoscience) in all areas will it distort your thinking."
-
michael sweet at 03:58 AM on 21 September 2014The 97% v the 3% – just how much global warming are humans causing?
Hasn't William F. Ruddiman (old article, first of many on GOOGLE) published studies that show the human contribution to AGW started 5,000 years ago? The increase in temperature from 1500 to 1900 is just the slower increase from preindustrial human caused AGW, not a natural variation.
The last I saw on Rudiman's work the claim was made that most scientists supported his theory but it was not yet accepted as a consensus position.
It strikes me that Russ needs more than his unsupported asertion to show that any purproted increase in temperature over that past 5,000 years is natural. It is at least as likely that it was preindustrial AGW.
-
Andy Skuce at 03:49 AM on 21 September 2014Deciding who should pay to publish peer-reviewed scientific research
When research is fully or partly publicly funded, any publications arising from it absolutely should be freely available to the public. Publication costs should be part of the funding, since somebody has to pay for it and it may as well be the grant payers rather than university libraries.
Of course, there is publicly-funded research information that cannot be published, for example, on weapons or other issues of national security, but cost-free public access to this is beside the point, since such research is not published anyway. If the CIA were to write articles to be published in a science journal, then those papers ought to be free to everyone to read, but nobody, surely, is demanding open access to all of the CIA's reports.
Of course, there is a good case to be made for corporations to be allowed to keep their own research proprietary, even if it is partly funded through tax incentives. Again, we are not talking about free access to information that is not published.
The lucrative business models of the for-profit publishing houses get a free ride on the backs of taxpayers and, in the process, restrict public access to knowledge. This needs to change.
-
Tom Curtis at 02:59 AM on 21 September 2014Deciding who should pay to publish peer-reviewed scientific research
Kernos @10, you have not already paid for the research. In addition to the fact that not all research is paid for from taxes, as noted by Rob Honeycutt, not all research is done in the United States. By your argument, only those articles whose research was fully funded by the US government should be available to you (and other US citizens), and such articles should be available for free only to US citizens.
Further, even as regards to the US funded research, what is funded is the research - not the publication. When you can persuade your congress to set aside additional funds so that all tax funded research attracts an additional grant for public access publication, then your claim would be valid. Until then your interest as a taxpayer gives you no more right to free access to the publications than it does to free access to CIA reports.
I will grant that you may have a right to FOIA the paper, but doing so will just result in the agency through whom you initiate your FOI request purchasing a copy of the article, adding their own administration fee and then billing you for the total as the cost of satisfying the request.
-
Rob Honeycutt at 02:44 AM on 21 September 2014Deciding who should pay to publish peer-reviewed scientific research
Kernos... In fact, not all research is paid through tax funded government grants. A large amount of research is paid for through charitable trusts. So, you don't really have any idea which research is publicly funded. You're merely assuming you "should" have free access because your tax dollars paid for it.
I can guarantee you that free access to research is not going to do anything to improve the general public's scientific literacy, since nearly all research is written on a level that requires a great deal of knowledge in any given field.
Educating the public on scientific issues is a great thing! But it's an issue entirely separated from access to research.
-
Kernos at 02:31 AM on 21 September 2014Deciding who should pay to publish peer-reviewed scientific research
"Rob Honeycutt at 01:31 AM on 20 September, 2014
Kernos... You do have access to the research, through a subscription. There happen to be costs that come into play regarding the publishing and distribution of research. That's what subscriptions pay for."We have already paid for the research. We shouldnt have to pay again. With most journals online, costs are minimal anyway. If it has to come out of the grant money so be it. Include it in your grant proposal.
If the public is to become more science literate, access must be available to all. $20-$30 a paper is impossible for most Americans. And, avoid publishing in for-profit journals. They need to disappear.
-
Tom Curtis at 02:08 AM on 21 September 2014The 97% v the 3% – just how much global warming are humans causing?
MA Rodger @69, from an extended discussion of the issue by K.a.r.S.t.e.N:

As he concludes, "From a NH point of view, the AMO plays a minor role as far as the temperature evolution is concerned."
-
MA Rodger at 22:23 PM on 20 September 2014The 97% v the 3% – just how much global warming are humans causing?

jwalsh @63 & @65.
Being as generous as I can , Figure 3 from Mann et al (2008) here shows perhaps 0.1ºC per century rise for the NH "since 1600 or so", about 7% of the 20th century rise. (Being less generous, note that some of the reconstructions are flat with zero warming.) I'm not sure how much of the warming is attributable to the Maunder Minimum/Dalton Minimum - probably the lion's share. When solar forcing is considered for the post-1950 contribution, it will be small but cooling.
So using Mann et al (2008) to argue for a significant natural contribution to the global surface warming since 1950 (33% to 25% is quoted @63) doesn't make any sense to me.
-
Tom Curtis at 16:12 PM on 20 September 2014The 97% v the 3% – just how much global warming are humans causing?
jwalsh @63:
"First, If you water-board me to come up with a figure for AGW since 1950, I'd probably say 66-75%, so I am arguing from a position "within" the 97% (if I had published something on climate)."
I did not ask about where you estimated the anthropogenic contribution to be, but what evidence you had in support of inflating the IPCC's uncertainty by a factor of two or more. Never-the-less it is interesting to note that your "estimate" of the anthropogenic contribution has a probability of 2.3% based on Fig 10.5, and that even if we inflate IPCC uncertainty so that there is a 5% chance of a 50% contribution or less, that probability rises to only 5.8%. Further, it is interesting to note that, as discussed above, your evidence for your preffered contribution is weak, ambiguous (at best) and does not in fact support your preferred value. However, if I ever decide to determine the anthropogenic contribution by inexpert ellicitation, I'll be sure to keep your wild assed guess in mind.
"He's right of course. You can't assume that the net natural contributions must be positive. But the same argument can be made about assuming them to be "zero" or negative over a short time frame."
This argument misses the true beauty of the AR5 assessment. The GMST record shows a gradual fall from 1880-1910, a sharp rise from 1910-1940, a gradual fall from 1940-1970, and a sharp rise from 1970-2000, with a gradual rise thereafter. That pattern is the basis for claims that internal variability is a significant contributor. It sets the phase and period of the multi-decadal internal variability in global temperature, if it exists. But that being the case, the period from 1951-2010 is exactly in phase. It goes from the early declining phase of the first cycle to the exactly equivalent year of the second cycle. Ergo any contribution from that cycle to the rise in temperature over that period comes entirely from any purported change in amplitude of the internal variability - which change of magnitude is not evident on any grounds, and on best evidence is a decrease in magnitude.
Nor is it any good to claim that the periods of the internal variation is not coordinated with that pattern. If it is not, then the effect of internal variability has been small such that it does not impact the overall pattern of warming through the twentieth century. So, either 2010 is in phase with 1950 and the internal variability between the two is consequently small, or the internal variability is small in any event, having little effect on the overall temperature pattern.
The logic here is very simple, and leaves no room for a large non-forced component of the temperature change from 1951-2010 unless it comes from multi-century patterns of internal variability, and as seen above those patterns do not have sufficient trend to be relevant, and are in any event most probably forced.
So, my questions remain unanswered. I asked for evidence as to why the IPCC uncertainty should be greatly inflated and you have merely provided unsupported speculation about the actual contribution, and ill thought out meanderings about Schmidt's comment that paid no attention to the actual relevant durations.
-
Andy Skuce at 11:53 AM on 20 September 2014Deciding who should pay to publish peer-reviewed scientific research
Maybe the means of calculating the impact factor itself could be changed to encourage open-access publishing. This might encourage researchers to go to open-access journals first. Perhaps an open-access journal could justify having more IF points because we might assume that its articles are more widely read, since there is no barrier to access from people with no instititional library access. It's not just citations that matter, but eyeballs, also.
-
Tom Curtis at 11:08 AM on 20 September 2014Skeptical Science Study Finds 97% Consensus on Human-Caused Global Warming in the Peer-Reviewed Literature
Will Power @346, incorrect. Specifically, "the AGW theory" is, in its simplest form, that:
a) humans have caused most of recent warming,
b) continuing as we have will result in a very significant warming, and
c) warming is likely to cause significant adverse consequences. Therefore Russ R's position as stated by you is incoherent. Specifically, if 97% there is "a 97% consensus supporting AGW theory", then there is also a 97% consensus supporting the claim that humans have caused most of recent warming.
Russ R's position should be restated that "there is a 97% consensus supporting that anthropogenic factors have caused some (>0%) of recent warming; and 1.6% supporting that most (50% or more) of recent warming has been anthropogenic". That position, however, is also incoherent as shown in my post at 318 , which I recommend you read if you have not done so already.
Finally, it is sometimes said that Cook et al show there is a 97% concensus behind the theory of AGW, or the IPCC. In fact it does not. Certainly it shows (as much as any empirical study can) that there is a 97% concensus behind (a), and by implication also behind (b). However, some small part of the scientific community accept (a) and (b) without accepting (c), and (c) was not specifically tested for in the survey. There may also be a 97% consensus behind (c), but Cook et al have not shown it.
-
Will_Power at 11:02 AM on 20 September 2014Skeptical Science Study Finds 97% Consensus on Human-Caused Global Warming in the Peer-Reviewed Literature
RH, you can say it isn't a point reasonable people can disagree about, but it seems abundantly clear it is a topic people do disagree on. I think it'd be good to clarify exactly what they disagree about. You can't do a good job explaining how a person is wrong if you don't explain what they say.
In that vein, am I right to say Russ R thinks this is an appropriate description of your results:
There's a 97% consensus supporting the AGW theory, and 1.6% put the human contribution at >50%.
And you guys say that statement is wrong, that it misrepresents your results?
Moderator Response:[RH] It is a misinterpretation of the results.
-
Will_Power at 10:12 AM on 20 September 2014Skeptical Science Study Finds 97% Consensus on Human-Caused Global Warming in the Peer-Reviewed Literature
Let me see if I understand the disagreement correctly. Everyone agrees Category 1 quantifies the human contribution, but Categories 2&3 do not. The disagreement is Russ R feels that means we should describe the results by saying:
There's a 97% consensus supporting the AGW theory, and 1.6% put the human contribution at >50%.
The other view says we should say:
There's a 97% consensus that puts the human contribution to global warming at >50%.
Because while Categories 2 and 3 don't directly quantify the human contribution, they do endorse the idea it is >50%.
Am I misunderstanding one side of this, or can can everyone agree that description of the positions is right?
Moderator Response:[RH] This is not a matter of disagreement. The fact is, categories 1-3 endorse human contribution and categories 5-7 minimize human contribution. Cook13 also went the additional step to be self-skeptical of potential bias that could have been introduced by raters (as Andy Skuce aptly pointed out with section 4.1, and Tom Curtis has repeated pointed out), by asking scientist to self-rate their own research. Thus, Cook13 has two independent measures that agree, which also agree with the results of previous research by Oreskes, Doran&Zimmerman and Anderegg.
This makes Russ' description wrong.
-
Tom Curtis at 06:40 AM on 20 September 2014Skeptical Science Study Finds 97% Consensus on Human-Caused Global Warming in the Peer-Reviewed Literature
Will Power @343, saying "papers in Categories 2&3 do not quantify the human contribution" is ambiguous. Papers in those categories do not explicitly quantify the contribution by definition of the category. They may still endorse (explicitly or implicitly) that >50% of recent warming is anthropogenic. An example of an explicit endorsement without quantification would be "while anthropogenic forcings continue to rise, combined natural forcings are negative over recent times, and internal variability is small" from which it is readilly deduced that anthropogenic factors are the primary cause of recent warming, without being able to quantify whether they contribute 55% or 110%, or something in between. Another example of explicit endorsement without quantification is "The IPCC shows global warming to be a substantial threat to human civilization". (It is irrelevant to the case whether they actually do show that, so please don't get distracted.) Such a statement endorses the (purported) IPCC findings, and therefore endorses basis of those findings, including that anthropogenic factors have contributed more than 50% to recent warming.
Because the abstract ratings in Cook et al attempt to quantify a quantitative factor (">50% or recent warming") using non-quantified data, that increases the risk of errors but several tests including the self ratings have shown the errors not to have effected the results. That is, they are more likely to have rated as neutral papers that do endorse the consensus than the reverse (as is shown by statistical analysis of internally detected error rates, and by comparision with the author self ratings). Unless you can show by statistical analysis or by replication that those two tests of relative error rates are in error, bringing up short lists of supposed errors is mere cherry picking, and rhetorical rather than scientific criticism.
-
Andy Skuce at 06:30 AM on 20 September 2014Skeptical Science Study Finds 97% Consensus on Human-Caused Global Warming in the Peer-Reviewed Literature
I would encourage everyone to read (or reread) section 4.1 of our paper "Sources of uncertainty". Many of the problems that our critics think they have uncovered were previously acknowledged there. Perhaps this is a sign that they never actually bothered to read it.
Yes, the abstract rating process was often subjective and the results were noisy. We frequently disagreed amongst ourselves. There will be instances where the final ratings can be reasonably disputed. It would be great to see this work redone by a different team.
The fact remains that very few papers and fewer abstracts reject the consensus on AGW. I was thrilled whenever I found one. Reading thousands of abstracts that endorsed or were neutral on AGW did get a little boring and finding a real dissenter brightened my day. It turns out there were just 78 rejections out of 11944 abstracts. Finding a real one could take hours of patient slogging.
Rejection of the basics of AGW in the scientific literature is a fringe activity. If your worldview hinges on there having to be significant doubt among experts about the basic science, it is understandable that this can be a hard fact to swallow.
-
Will_Power at 06:19 AM on 20 September 2014Skeptical Science Study Finds 97% Consensus on Human-Caused Global Warming in the Peer-Reviewed Literature
RH, I'm confused. I guess my comment did go through. What point do you want me to acknowledge? My comment specifically agreed with everything you said in your response to me. It seems clear we agree papers in Categories 2&3 do not quantify the human contribution. Is that right? Can everyone accept that and move on?
Can we all agree, "Categories 2&3 don't quantify the human contribution but do endorse the consensus"?
Papers that are in 2&3 are not expected to quantify AGW. They only need to implicitly endorse the consensus position.
Did you mean to say implicitly or explicitly/implicitly? I thought only Category 3 was for implicit endorsements?
Moderator Response:[RH] My error: Cat 2 explicitly endorses human caused warming, without quantification. Cat 3 implicitly endorses human caused warming, without quantification. Neither requires quantification.
Your original statement suggested that tons of 2&3's don't quantify, which is what is expected for papers found in those categories.
-
Tom Curtis at 06:17 AM on 20 September 2014Skeptical Science Study Finds 97% Consensus on Human-Caused Global Warming in the Peer-Reviewed Literature
With respect to Will Power @335, the title and abstract of the first abstract from which he quotes read as follows:
"Effect of encapsulated calcium carbide on dinitrogen, nitrous oxide, methane, and carbon dioxide emissions from flooded rice
The efficiency of N use in flooded rice is usually low, chiefly due to gaseous losses. Emission of CH4, a gas implicated in global warming, can also be substantial in flooded rice. In a greenhouse study, the nitrification inhibitor encapsulated calcium carbide (a slow-release source of acetylene) was added with 75, 150, and 225 mg of 75 atom % 15N urea-N to flooded pots containing 18-day-old rice (Oryza sativa L.) plants. Urea treatments without calcium carbide were included as controls. After the application of encapsulated calcium carbide, 3.6 μg N2, 12.4 μg N2O-N, and 3.6 mg CH4 were emitted per pot in 30 days. Without calcium carbide, 3.0 mg N2, 22.8 μg N2O-N, and 39.0 mg CH4 per pot were emitted during the same period. The rate of N added had a positive effect on N2 and N2O emissions, but the effect on CH4 emissions varied with time. Carbon dioxide emissions were lower with encapsulated calcium carbide than without.The use of encapsulated calcium carbide appears effective in eliminating N2 losses, and in minimizing emissions of the “greenhouse gases” N2O and CH4 in flooded rice."
I have placed in italics the portion he quoted, and underlined the portions most relevant to the classification. It is my opinion that interest in the reduction of greenhouse gases, the only criteria under which the treatment was tested, is only relevant if greenhouse gases are the major contributor to global warming, and only a recommendation of greenhouse gases are the major contributor to global warming. Hence implicitly the abstract assumes that greenhouse gases are the major contributor to global warming (which is also implicitly assumed to be a bad thing). As background, the anthropogenic origin of the recent increase in greenhouse gases is so well established that rejection of it ranks with rejection of heliocentrism in terms of scientific credibility. Ergo acceptance of greenhouse gases as the major contributor to global warming strongly implies that anthropogenic causes are the major contributor to recent warming. Without that assumption (and hence tacit endorsement), the paper is as of much scientific interest as 19th century papers about how long it takes for ants to wander outside circles of specific diameter.
For the second abstract, here are the title and full abstract:
"Global warming and clean electricity
Examines the possibility of global climate change due to the emission of carbon dioxide and other greenhouse gases. The problem can be ameliorated by reducing fossil fuel consumption through conservation and expanded use of nuclear and solar power. In particular, major reductions can be achieved if fossil fuels are replaced in electricity generation and if electricity assumes a larger role in the overall energy economy."
Again I have italicized the portion quoted, and underlined the relevant portion. From the abstract the article examines whether or not increased greenhouse gases will cause climate change. Further, it goes on to explore ways of ameliorating climate change by reducing emmissions of greenhouse gases. Clearly, therefore, it found that increased GHG do cause climate change, and that they cause it at sufficient quantities as to require amelioration. Given this information it is possible, though unlikely, that they found greenhouse gases cause global warming at sufficient rate only to cause 45% of recent warming, but it is far more likely that they found warming at a sufficient rate to cause >>50% of warming. Again, this is an inductive conclusion that may be wrong - but it is unlikely to be so and as previously noted, errors from neutral to endorsement have been shown to be outnumbered by errors in the reverse direction.
-
Will_Power at 06:01 AM on 20 September 2014Skeptical Science Study Finds 97% Consensus on Human-Caused Global Warming in the Peer-Reviewed Literature
It seems one of my comments didn't go through. RH, I have read the paper. I don't disagree with anything you say about it. You say "only categories 1 and 7 'quantify' human contribution." If only Categories 1&7 quantify the human contribution, Categories 2&3 cannot quantify the human contribution.
That means I accept with everything you say about the paper.
Moderator Response:[RH] Your previous statement was, "I read through 200 abstracts today. There are tons in Categories 2&3 which acknowledge AGW but don't quantify the human contribution. They are silent on the issue."
Papers that are in 2&3 are not expected to quantify AGW. They only need to implicitly endorse the consensus position.
Please re-read Cook13 more carefully before proceeding to comment.
-
Tom Curtis at 05:38 AM on 20 September 2014Skeptical Science Study Finds 97% Consensus on Human-Caused Global Warming in the Peer-Reviewed Literature
Well said KR @337.
-
Tom Curtis at 05:37 AM on 20 September 2014Skeptical Science Study Finds 97% Consensus on Human-Caused Global Warming in the Peer-Reviewed Literature
Will Power @355, by the definitions of the rating categories, any paper rated 2 or 3 that does quantify the contribution explicitly and rated 2 or 3 is a mistake. Pointing out that those papers do not explicitly quantify the contribution is therefore not a criticism of the paper, and if you think it is it shows you have not understood it.
With regard to the two papers you consider, it is quite clear that they implicitly endorse the consensus. That is, their statements together with reasonable background knowledge strongly implies that the paper endorses the consensus.
That implication is inductive. It may be wrong. However, error analysis first conducted by Richard Tol, and then done correctly by Cook and others in their response to Tol clearly show that there are more errors in the opposite direction. Ie, if we corrected all such probable (or plausible) errors, more rating 4 abstracts would be rerated as 3 or higher, than rating 3 or higher abstracts rerated as 4. The net result would be to strengthen the consensus finding.
You are welcome to disagree with that finding, but if you do you need to quantify the proportion of such mistakes in both directions (and also as related to rejection papers). Failure to do so renders your critique merely rhetorical. Ideally you would replicate the paper, but make sure your replication includes the element of author self rating as a check on your abstract rating bias.
-
Tom Curtis at 05:20 AM on 20 September 2014Skeptical Science Study Finds 97% Consensus on Human-Caused Global Warming in the Peer-Reviewed Literature
Dikran Marsupial @328, there is a defacto exclusion of papers that are not related to climate by the inclusion of category 4:
"(4) Not climate-related Social science, education, research about people's views on climate"
Presumably the intention is to exclude opinions by non-physical scientists who are not only not necessarilly expert in a particular area of climate science, but do not necessarilly have the scientific background to assess the evidence adduced by the IPCC in support of the concensus position. Therefore we can conclude that a limited number of Duarte's very small list do represent genuine errors of classification.
What Duarte (or Russ R) have not established is the relevance of that. Of course there are errors of classification. The classifiers were human, and humans make mistakes. In so large an excercise with the classification of 12,465 papers there are bound to be a number of mistakes. It is well known, and easilly established that the largest single group of such mistakes is classifying rating (1-3) articles as rating (4) due to simple error or insufficient information in the abstract and title, something we know by comparison with the author self ratings. There are in the order of 3500 such "mistakes".
Given that there are bound to be such errors, both increasing and decreasing the consensus value, the only significant question is what is the effect of correcting those errors. For one class or errors (internal rating errors) it is now well established that it has no significant effect by Cook et al's response to Richard Tol's flawed critique. Duarte, and Russ R acting as Duarte's puppet, raise a different category of mistakes. They make no attempt to quantify relative proportions of such mistakes, either by count or statistically, and cherry pick mistakes only in one direction. However, simple analysis as above shows it is highly implausible that such mistakes will impact the result.
Another approach is to note that only 283 out of 12280 abstracts were rated as not climate related, ie, just 2.3%. Assume that twice that number escaped correct classification and all were rated as endorsing the consensus. With these utterly implausible assumptions, "correction" of the results would reduce the consensus rate from 97.1% to 97%.
Again this underlines the fact that simply finding an error of classification or rating does nothing as regards a scientific critique of Cook et al. With out quantification of the relevant ratios, and a projection of those ratios to determine the impact on the concensus rate, listing cherry picked examples of such errors is simply propaganda, haveing nothing to do with science.
Of course, I have laid out these points before @322. Russ R firmly established which side of the science/pseudoscience divide he is on by brushing them aside with an inane comment. Other than pointing that out, I will leave it there lest I also become guilty of excessive repetition. -
Skeptical Science Study Finds 97% Consensus on Human-Caused Global Warming in the Peer-Reviewed Literature
Stepping back a bit from the repeated attempts to post hoc redefine the criteria actually used in the Cook et al paper (absurd), I find it utterly fascinating how stridently any expert consensus on AGW is being denied.
Look at other consensus objections: as with creationism, anti-vaccines, the entire tobacco industry campaign, ozone, acid rain, and now anthropogenic global warming - a repeating pattern of minority opinions trying to convince the public that the experts are not in agreement (when they actually are). Possibly because people without a relevant background will trust the majority opinion of the experts as being meaningful, and that shapes policy.
So - nit-picking on tiny aspects of papers that don't, that cannot, change the base conclusions of the science, fake experts (the 3%), the ad hominem attacks on authors in attempts to discredit their work, the contradictory counter-explanations du jour (the sun, cosmic rays, cycles, it's not happening, anything but us), on and on and on. And claims that the consensus doesn't exist, despite 'skeptic' attempts to claim a skeptical consensus does (the OISM petition). But a distinct lack of science - of attempts to examine the data and see if those minority opinions have any support from the evidence.
So why is consensus on AGW fought so much by the 'skeptics'? IMO it's because if 95-97% of those studying a topic agree, yet you vehemently disagree, you just might be fooling yourself... and people seem to find that intolerable.
Prev 669 670 671 672 673 674 675 676 677 678 679 680 681 682 683 684 Next


