


 Arguments


Recent Comments
Prev 673 674 675 676 677 678 679 680 681 682 683 684 685 686 687 688 Next
Comments 34001 to 34050:
-
Tom Curtis at 14:19 PM on 17 November 2014CO2 effect is saturated
Stephen Baines @372, firstly, thanks. Second, the reason I have persisted so long in the discussion is because of a hope that it would prove instructive to interested readers. I judge that by now, any questions that need to be answered have already been answered (several of them several times). However, if somebody other than Satoh has questions, I would be happy to address them if I am able.
-
John Hartz at 14:16 PM on 17 November 2014CO2 effect is saturated
[JH] Moderator's Comment
Satoh: Your "Artful Dodger" schtick has run its course. Any future posts by you will be summarily deleted.
-
Stephen Baines at 13:11 PM on 17 November 2014CO2 effect is saturated
TC...lest your get frustrated, I just wanted to say that the only reason I followed this discussion was because I am less familiar with this aspect of atmospheric physics thanI should be (it's off my specialty by quite a ways) and I wanted to learn some more. And I have certainly learned a lot in this exchange, perhaps more than if you had simply been trying to explain things de novo.
-
Tom Curtis at 12:30 PM on 17 November 2014CO2 effect is saturated
Satoh @370, you are evidently determined in your decision to be absolutely resistant to evidence. In this case, the modtran graphs shown above the only emissions shown are from CO2. The show emissions from an altitude of 80 km, and a difference of 5 km makes a difference in the emissivity. A difference of 10 km would also make a difference. Ergo, your introduction of Hottel graphs into the discussion, and your insistence that only values for the free path length of photons with a wave length of 14.9 microns with respect to a CO2 gas are shown (respectively) to be a red herring, and a blunder. Further, your insistence that you know more on this subject than the scientists who have spent their career pursuing the topic and wrote textbooks on the subject is simple arrogance of a breath taking quantity.
-
Satoh at 12:06 PM on 17 November 2014CO2 effect is saturated
Yes, but emissions just above and below the 15 micron band, that go for kilometers, have nothing to do with CO2. They come from water vapor, cloud, and terrestrial. The ones from right next to 15, along the sides of the band that do come from CO2, are negligible in amplitude compared to the emissions from 15, or more exactly, 14.9, and even they don't go for kilometers.
Your attempt to rationalize a path length of 10,000 feet, in an attempt to rationalize a curve on the graph that shows a CO2 emissivity of 0.3, need to come to an end. Especially since you just said the Hottel charts don't work for atmospheric emissivities. (Correct, they don't. The Hottel charts are industrial charts for short distances in factory settings, under high pressure and very high heat.)
-
Tom Curtis at 11:56 AM on 17 November 2014CO2 effect is saturated
A slight correction and clarrification for my preceding post. The emissivities calculated with modtran are for the tropical atmosphere only. Further, as I took the ratio of the integrated emission across the wave lengths shown to the total emissions for a black body with the surface temperature the emissivities are underestimates, within the limits of accuracy of the model, not over estimates as I indicated.
-
Tom Curtis at 11:14 AM on 17 November 2014CO2 effect is saturated
Satoh @367, I thought you would take that line. That is why I pre-rebutted it, writing:
"Because the emissivity plotted in Hottel diagrams is total emissivity, it is irrelevant that the emission at 15 microns is absorbed within a very short distance. Emissions just above or just below 15 microns may not be absorbed for meter, or even kilometers and hence make a substantial contribution to mean Beam Length (L). Therefore, in determining the total emissivity of the atmosphere, you cannot assume very short mean beam lengths."
(Emphasis added)
I will illustrate what I mean with an example from Modtran, a Broad Band Model of atmospheric radiation. The example shows the downward IR radiation from CO2 only for a tropical atmosphere with no clouds at 0 and 5 kms:

Because the IR spectra are show the net downward flux from CO2 in the absence of other radiative molecules, it shows the net emission from CO2 (ie, total downward emission by CO2 less total absorption of downward emission by CO2). This is not observed data, for which we cannot obtain H2O (and O3, and CH4 etc) free conditions. The model is of the type that has been shown to be reasonably accurate at predicting emissions from CO2 in furnaces and flames (ie, reasonably approximate to Hottel diagrams), especially near room temperatures. Ergo they will show the correct basic principles.
In atmospheric conditions pL is ill defined because, as shown in the side graph pressure is not constant with altitude, and nor is temperature. For this reason, Hottel diagrams are useless in determining atmospheric emissivities. However, pL in Hottel diagrams is proportional to the number of molecules in the mean beam length. Obviously, there are fewer molecules from 5 km to the top of the atmosphere (TOA) than there are from the ground to the TOA, so that the 5 km look up corresponds to having a smaller pL in a Hottel diagram.
The crucial difference between the two as seen above is that the emission in weak bands is stronger for 0 km looking up than it is for 5 km looking up. This is partially obscured by the lower base temperature for the 5 km looking up, but is very clear in the 10 micron emission range which is moderately strong for 0 km looking up, but near non-existent for 5 km looking up. That difference results in a reduced total emissivity for the 5 km looking up example than for the 0 km looking up example.
In fact, the model output gives the emission over the wavelengths shown in the graph, and the temperatures for the different levels. From that it can be calculated that the total emissivity of CO2 for the tropical atmosphere from 0 km up is 0.264 and for 5 km looking up it is 0.18. Because the calculation does not include the full spectrum, these will be slight over estimates of the emissivity. However, the total emissivity from 0 km looking up will not drop appreciably below 0.2.
SOD shows that it cannot be below 0.13 from observational evidence by SOD using measurements of back radiation spectra:
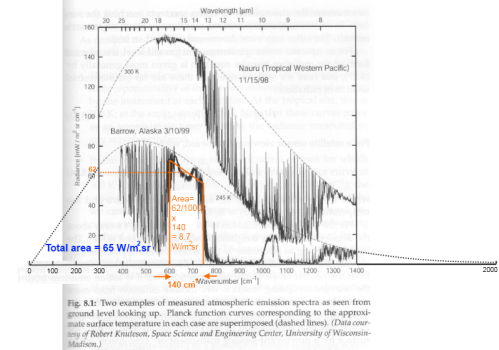
But that, is known to be an underestimate, not least because the example used is from an Arctic autumn (a factor not mentioned by SOD). It is possible to constrain the lower limit of total emissivity of CO2 in the atmosphere like this for a given surface temperature because CO2 absorbs so strongly in the 15 micron band, making it easy to distinguish.
So, while your reasoning is approximately valid the 15 micron peak of CO2 emissions, it is not valid for total emissivity. That mean beam length at 15 microns is so constrained is one of the reasons why emissivity does not increase linearly with pL.
-
Satoh at 09:56 AM on 17 November 2014CO2 effect is saturated
Here is a thought experiment. If 15-micron photons are streaming up from the surface, being absorbed, re-emitted, absorbed, re-emitted, all the way from the surface for 10,000 feet, how can you consider that 10,000 feet would ever come into any sort of calculation for total emissivity? Do you think anything gets bigger and bigger for 10,000 feet? If photons are absorbed and re-emitted 100 times from the surface to the TOA, that somehow that means there are 100 times more photons than if you only considered the uppermost photon paths? When a photon is absorbed and re-emitted, it's still just one photon? The amount of emissivity at the surface depends ONLY on the number of photons coming from the uppermost path length. That is the reason they say path length, and not total distance that all these have traveled. Only the top photons even REACH the surface, the others were all absorbed!
In a relay race, where 4 runners pass the baton, the emissivity at the end of the race is one baton, not 4.
-
Tom Curtis at 09:35 AM on 17 November 2014CO2 effect is saturated
Satoh @347, 348, 349, 350, and 354 criticized my understanding of path length as used as a measure of pressure-length (pL) in Hottel diagrams. This is despite the fact that he responded to my post @340 in which I describe my understanding by saying "excellent work" with no expressed quibble about my understanding of pL or emissivity, both of which he now disputes. In particular, he wrote @349:
"You randomly picked the top line and said "it's 4 foot atmospheres which is .0004 X 10,000 feet" so it would point to the 0.2 mark. That's pretty arbitrary. The mean free path length of 15 micron photons at sea level is definitely not 10,000 feet so you can't use that line.
This paper has been floating around the web which says the mean path length for photons in CO2 at sea level is 32 meters. I don't buy it. They first measured it many years ago and it was in millimeters. I'd like to know what the latest calculations are for that.
Mean path length applies to absorption, and it also applies to emission. They are inverse of the same process."
The first and most crucial point is that L is not defined as "mean free path length", and that "mean free path length" is not the same thing as "mean path length". Indeed, Mehrota et al (1995) (download PDF), define L in pL as "mean Beam width". Further, in a worked example, they calculate estimates of emissivity for a Claus plant (described in Nasato et al, 1994), saying, "A mean beam length of L = 0.9 x diameter = 0.04 m can be used." (The inside diameter of the tube in question was 43.99 mm.)
Further, that is consistent with the lecture slides by Dr Prabal Talukdar on Gas Radiation in which he defines "Mean Beam Length":
"• The simple expression for the hemisphere of gas is not
applicable for other geometries
• A concept of mean beam length is introduced for
engineering calculations- This is an equivalent path length L which represents the
average contributions of different beam lengths from the
gas body to the striking surface- In the absence of information available, mean beam
length is approximately calculated as
L =~= 3.5*V/A
Where A=total surface area of the enclosure
and V = total volume of the gas"He then shows a slide of a table of formula for different shapes including a "Circular cylinder of semi-infinite height" radiating to "an element at the center of the base" for which the formula is 0.9 *D. As these formula are not restricted as to the actual volumes enclosed, and as the worked example by Mehrota et al has a Beam Length significantly greater than your estimated Mean Free Path Length, I take this to show how experts in the field interpret L for the pL contours in Hottel diagrams (as opposed to the interpretation of biologists working outside of their field that even Anthony Watts considers to be a pseudo-scientist).
Worse, however, the mean free path length is given by the general formula l=1/(nσ), where l is the mean free path length, n is the number of particles involved, and σ is the effective cross sectional area of collision. (In Nahle's varian he uses "l=m/(nσ)" where m is the mass of the gas, and n is the number of molecules per unit mass which is equivalent.) However, by the ideal gas law,
P=nRT/V, where n is the number of molecules in moles, P is pressure, T is temperature, V volume and R a constant. Ergo, for constant temperature and volume, P is proportional to n. But n is inversely proportional to l (free path length), so that if L in pL is mean free path length, pL is constant for a constant temperature and volume. Ergo, if L were mean free path length, contours of constant pL in Hottel diagrams (which assume constant volume) would by necessity be vertical, ie, have a constant value in the x-axis (Temperature). Therefore it is mathematically impossible that L from pL = mean free path length. (Put another way that may be less obscure, because p is the inverse of l, of L=l then Hottel diagrams should revert to a mapping of Temperature directly onto emissivity, and shoud require no pL contours for that mapping.)
Turning to emissivity, we have the statement of Byun and Chen (2013) that Hottel diagrams model total emissivity, not spectral emissivity. The latter is the emission at a given wavelength or frequency relative to that predicted by the appropriate form of Planck's law for a black body at that wavelength or frequency. The former is the integral of the spectral emissivions as a ratio to the emission predicted by the Steffan-Boltzmann law for the total emission of a black body. Both, or course, are relative to a particular temperature.
Because the emissivity plotted in Hottel diagrams is total emissivity, it is irrelevant that the emission at 15 microns is absorbed within a very short distance. Emissions just above or just below 15 microns may not be absorbed for meter, or even kilometers and hence make a substantial contribution to mean Beam Length (L). Therefore, in determining the total emissivity of the atmosphere, you cannot assume very short mean beam lengths. (Nor should you assume mean beam lengths equivalent to the total height of the atmosphere because of decreasing pressure with altitude.) But looking horizontally, mean beam lengths of multiple kilometers are possible with near constant pressure. Hence my example of 10 horizontal kilometers, which with CO2 and amtospheric concentrations gives a total emissivity of approximately 0.2 (which I know independently to be the approximate total emissivity of CO2 looking vertically in clear sky conditions).
-
Andrew Mclaren at 08:39 AM on 17 November 2014It hasn't warmed since 1998
Looks like this handy rebuttal to a commonly expressed "skeptic" argument needs an update... where it states that the warmest 12 consecutive months on record are June 2009 - May 2010, this has just been surpassed according to NOAA, by the October 2013 - September 2014 interval. Time for a quick edit already!
-
Stephen Baines at 07:15 AM on 17 November 2014CO2 effect is saturated
"Stephen, the mean free path length is the path length."
Satoh, saying so does not make it so. I linked to the wikipedia definitions for both terms that make the difference in common usage clear. You refused to acknowledge those links. Hottel et al did not mean mean free path when they refer to pathlength, nor does anyone who uses the graphs. Simply saying they mean something different does not change that.
"Stephen, the curve for 4.0 atm ft doesn't tell us anything about the combination. They could be 4 atmosphere with a path of 1 foot, .04 atmospheres with a path of 100 feet, or .000000000004 atmospheres with a path of 100000000000 feet. Like I said, if you increase the partial pressure you decrease the path, and are still on the same curve of the graph and have the same emissivity."
So, why are their multiple lines on the Hottel emissivity graph if the meaning of pathlength, as used by the authors, corresponds to what you say? By your definition, there should only be one line, as concentration and pathlength would be perfectly anticorrelated for a given gas, although varying with temperature.
(BTW..I must apologize to everyone for getting issue involving emmisivity and absorptivity mixed up above in discussion of pathlength. Unnecessarily confusing that.)
-
Rob Honeycutt at 05:52 AM on 17 November 2014Fact check: China pledged bigger climate action than the USA; Republican leaders wrong
joeygoze... ubrew12 included a citation. It's a "per person" reference. I would even hold that it is smaller than that since a portion of those emissions are the result of producing products for western markets.
If you've ever spent any time in China you realize how small a single Chinese person's carbon footprint is. Most of the population still lives an agrarian lifestyle. And even those who live in cities spend very little heating or cooling their homes. Most use public transportation. Appliances are small. Most clothing is still hand washed and air dried. So on and so forth...
-
michael sweet at 05:41 AM on 17 November 2014CO2 effect is saturated
Satoh,
You cite the paper I referenced at 249 and 250.
Since you now deny what you previously cited I will no longer post responses to you. It is impossible to resolve diferences when one side denys what they previously claimed.
-
joeygoze9259 at 05:39 AM on 17 November 2014Fact check: China pledged bigger climate action than the USA; Republican leaders wrong
@ubrew12
Can you source your data, China carbon footprint 1/4 of USA?
Simple search found "EDGAR (database created by European Commission and Netherlands Environmental Assessment Agency) released 2012 estimates. The following table lists the 2012 estimate of annual CO2 emissions estimates (in thousands of CO2 tonnes) from these estimates along with a list of emissions per capita (in tonnes of CO2 per year) from same source."
China is #1 emitter at 9,860,000 (in 1000s of tons CO2)
USA #2 emitter at 5,190,000
http://www.ask.com/wiki/List_of_countries_by_carbon_dioxide_emissions?o=2801&qsrc=999&ad=doubleDown&an=apn&ap=ask.com#cite_note-EDGAR-9
-
Satoh at 05:15 AM on 17 November 2014CO2 effect is saturated
Stephen, the curve for 4.0 atm ft doesn't tell us anything about the combination. They could be 4 atmosphere with a path of 1 foot, .04 atmospheres with a path of 100 feet, or .000000000004 atmospheres with a path of 100000000000 feet. Like I said, if you increase the partial pressure you decrease the path, and are still on the same curve of the graph and have the same emissivity.
-
Satoh at 05:08 AM on 17 November 2014CO2 effect is saturated
Michael, I am not interested in discussing that Nahle paper. I did not cite it and don't care about it. I didn't even read it. Attacking that paper is a straw man.
Stephen, the mean free path length is the path length. The photon leaves the surface and hits a CO2 molecule. That's the path. After that, the energy converts to kinetic heat when the CO2 molecule bumps into an O2, N2, H2O, Argon, another CO2 molecule, a tree, a drop of rain, or anything else. It another photon gets emitted by the H2O, tree, raindrop or anything else, it's not a continuation of the "path." It's a new path.
Please end that line of argument because your line of argument has already bumped into something and was absorbed.
Moderator Response:[JH]
Please note that posting comments here at SkS is a privilege, not a right. This privilege can be rescinded if the posting individual treats adherence to the Comments Policy as optional, rather than the mandatory condition of participating in this online forum.
Please take the time to review the policy and ensure future comments are in full compliance with it. Thanks for your understanding and compliance in this matter.
-
Stephen Baines at 05:01 AM on 17 November 2014CO2 effect is saturated
And yes, I accidentally said 10,000 m instead of feet. Mea culpa, but you are completely missing the main point.
TC picked that line because on that graph it best reflects the combination of the real ppmv of CO2 in the atmosphere (~400) and the real thickness of the atmosphere (which is actually thicker than 10,000', but you take what you can get.) Thus, 0.0004atm*10,000' = 4 ft.atmospheres.
The concept is simple...you need to consider the distance over which light traverses as well as the concentration of substances that may absorb light to determine the fraction of IR that is absorbed as it passes along that path. It's the basis of Beer-Lambert law in spectrometry and underlies a lot of quantitative chemistry.
-
Stephen Baines at 04:31 AM on 17 November 2014CO2 effect is saturated
"The definition of mean free path is well known and nothing new. You can't call a column of air the path length. "
Satoh, this is getting tiresome. You can't simply refer to mean free path and then call it path length and expect anyone to understand what you are saying. Those are two different concepts. If you conflate them (and others) noone can have a sensible conversation with you.
-
michael sweet at 04:03 AM on 17 November 2014CO2 effect is saturated
Satoh,
I read some of your cite. It contains chemistry calculations which I am familiar with. The first equation is:
"The density of the gas carbon dioxide in the atmosphere is obtained by the following formula:
ρCO2 = (12.187 * Molar mass of CO2 * volumetric fraction of CO2) / (276.69 K) = 756 mg/m^3. (Ref. 7)
Where 12.187 is the molar mass of elemental carbon, 44.01 is the molar mass of carbon dioxide, 390 ppmV is the volumetric fraction of CO2 and 276.69 K is its temperature."
I went to his reference 7 and got 756 mg/m3 for 390 ppmV. I found several problems with this calculation.
1) The units of Nahle's calculation are g/mol carbon*g/mol atmosphere/K. He incorrectly uses the units from reference 7 of mg/m3.
2) The textbook I teach chemistry from lists the molar mass of carbon as 12.0107 not 12.187. Nahle's number appears to have been made up to get the correct result.
3) Reference 7 uses 273.15K as the temperature not 276.69. Once again Nahle appears to have made up his number.
4) Additonal errors are smaller and not worth the text space.
Tom Dayton above links many additional basic errors.
How can you rely on a citation which has so many basic errors? Why do you think such junk is worth sharing? What websites are you reading to pick up this junk? Why do you believe what those websites say?
If you continue to rely on websites that think pseudoscience rife with basic errors can counter the IPCC report you will never understand the greenhouse effect and AGW. Perhaps you should start asking questions to become more informed, rather than citing obvious junk to support your mistaken notions.
-
Satoh at 03:57 AM on 17 November 2014CO2 effect is saturated
Stephen, you are quite wrong. The definition of mean free path is well known and nothing new. You can't call a column of air the path length. The path length for CO2 is clearly defined as the mean length a photon will go before bumping into a CO2 molecule. It can't be scattered or re-radiated, and still be called the same path. Your comment is in grave error. The concept of mean free path length applies to moving molecules, atoms, electrons, photons, cosmic rays, etc. Emissivity of a solid or liquid is a surface phenomenon, emissivity of a gas uses the path length for obvious reasons...the photons that originate behind the path length don't originate at the surface....which is the path length.
Michael, I did not cite that Nahle paper. I brought it up because it's the only paper online that estimates the path length for CO2 at sea level, and is cited several times around the web. In fact, I said it was wrong as part of my argument.
Tom Dayton, atmospheric column? Read what I said to Stephen.
Stephen again, TC did not say 10,000 meters as the column length, he said 10,000 FEET so he could use the top curve on the graph, because it gave the higher emissivity of 0.3 for his argument.
Everybody, if the path length of CO2 was 10,000 feet, photons would go 10,000 feet on average before hitting a CO2 molecule, there would be no greenhouse effect from CO2, and we would not be here.
-
Stephen Baines at 02:13 AM on 17 November 2014CO2 effect is saturated
Satoh
Most people try to figure out extinction, absorption or emissivity over an arbitrary length scale of interest — say, the depth of the atmosphere or 10,000m. That is the pathlength TC is using. That length scale is not simply a random choice to get a result, but central to the entire point of the conversation, so it's a mystery why you should be surprised that he uses it. You appear to be saying that the amount of CO2, or water vapor, in that 10,000 meter column of air has no effect on the opacity of the atmosphere to absorb IR emitted from earth. I doubt that is what you mean, because we would have to throw spectroscopy right out the window...just to start.
You seem to be using "pathlength" to mean something completely different, maybe the average distance a photon emitted by a CO2 molecule must travel before (possibly) running into another CO2 molecule? or an extinction length scale? I can't tell for sure. If I as cynical I would say that you seem to change depending on which definition gives you the number for emissivity that you want.
-
Tom Dayton at 01:43 AM on 17 November 2014CO2 effect is saturated
MA Rodger, thanks for the link to Nasif Nahle's claim that CO2 is cooling the planet. On that thread, a commenter named Neutrino heroically corrected Nahle's "logic." After revealing many of Nahle's astonishingly sloppy transcriptions of equations, misplacing of parentheses in equations, inconsistencies in units, and more, Neutrino summarized the crux of Nahle's error as treating the emissivity of one meter of atmosphere as if it is of the entire atmospheric column. Nahle then vanished from the discussion.
-
One Planet Only Forever at 01:29 AM on 17 November 20142014 SkS Weekly News Roundup #46B
Common sense based on a reasoned evaluation of available information would conclude that the likes of the Republicans are irrationally pursuing the maximum possible short term benefit for a select portion of current day humans to the detriment of all other humans and the future of humanity.
Common sense would say the actions they want to get away with are not just harmful but are ultimately unsustainable ways of living well that only a few on the planet can be allowed to benefit 'most vigorously' from, with people fighting any way they can get away with to benefit the most, with some people not getting any net benefit, and many people and other life being harmed without getting any benefit.
And the most galling of the string of actions by this group of deliberate trouble makers is their attempt to claim that the made-up claims they want believed are 'common sense', which they hope will mena people accepting them without reasoned evaluation of available information. What they really hope is to keep a large percentage of the population inclined to want a better present for themselves rather than caring about the development of a sustainable better future for all.
Their ability to prolong the poppularity of such damaging ultimately unsustaiable beliefs is a greater threat than the rapid production of excess CO2. And they probably understand that rational thoughtful 'common sense' gaining enough popularity threatens their ability to get away with their many deliberate misleading claims attempting to support their many harmful and ultimately unsustainable pursuits of profit. Hence. their attempts to abuse and ruin the term 'common sense', to try to make it mean something you believe without really thinking about.
-
michael sweet at 01:12 AM on 17 November 2014CO2 effect is saturated
Satoh,
Citing unpeer reviewed internet blogs that claim everyone else is wrong is not very useful in a scientific discussion, although it is better than nothing. Please raise your game. Nahles claim that his "paper" was "peer reviewed" by his friends in the Physics department is not a suitable scientific citation. Think: if this is the best you can find, is it really comparable to the recent AR5 report? That report was written by several thousand specialists and peer reviewed by tens of thousands of scientists. You must provide stronger evidence to get informed people to believe what you say.
You will look better if you think longer before you post. Tom's graphs A and B were clear to me.
Tom: thank you for defining emissivity and emission.
-
VictorVenema at 01:07 AM on 17 November 2014Not a cite for Soare eyes
They just asked me to review a paper about the Earth's magnetism. That is about all I got from the abstract; hardly understood anything. Almost looks as if they send the manuscripts to random scientists.
-
Satoh at 19:26 PM on 16 November 2014CO2 effect is saturated
Yes, of course, if the partial pressure goes up, the path length goes down. Naturally.
I still need to know why you said 10,000 feet and why you used the top curve on graph 1.
-
Stephen Baines at 17:46 PM on 16 November 2014CO2 effect is saturated
Nahle claims to disprove AGW by pointing out that the earth is not an actual physical greenhouse, which suggests the concept of metaphor is completely lost on him.
-
MA Rodger at 17:17 PM on 16 November 2014CO2 effect is saturated
Satoh @349/350.
That paper you cite manages to conclude saying:-
"By considering also that the carbon dioxide has by far a lower total emissivity than the water vapor I conclude that the carbon dioxide has not an effect on climate changes or warming periods on the Earth."
This is not the only argument from the author Nasif S. Nahle that purports to have disproved AGW. He has even shown that CO2 is cooling the planet, rather than warming it. This, of course, is 'men-in-white-coats' territory and not the stuff that should be presented here at SkS.
-
Tom Curtis at 16:45 PM on 16 November 2014CO2 effect is saturated
Satoh @347:
"The mean path length at sea level for photons between CO2 molecules was 33 mm years ago but I'm saying 30 mm now which is .03 m. The emissivity of CO2 at sea level goes along the curve of .0004 x .03 which is the .000021 I mentioned, which is not on the graph but you can visualize it."
Ah! So because partial pressure has increased from 360-400, pathlength has decreased from 0.033 to 0.03, or in other words (on your interpretation) atmosphere meters is a constant for any given gas at a constant temperature. Do you perhaps want to rethink that?
-
Satoh at 14:57 PM on 16 November 2014CO2 effect is saturated
The paper I just cited says the emissivity of CO2 is .0027 (no units)
-
Satoh at 14:49 PM on 16 November 2014CO2 effect is saturated
I see what you did. You randomly picked the top line and said "it's 4 foot atmospheres which is .0004 X 10,000 feet" so it would point to the 0.2 mark. That's pretty arbitrary. The mean free path length of 15 micron photons at sea level is definitely not 10,000 feet so you can't use that line.
This paper has been floating around the web which says the mean path length for photons in CO2 at sea level is 32 meters. I don't buy it. They first measured it many years ago and it was in millimeters. I'd like to know what the latest calculations are for that.
Mean path length applies to absorption, and it also applies to emission. They are inverse of the same process.
-
Satoh at 13:33 PM on 16 November 2014CO2 effect is saturated
Wait, did you think that 10,000 feet was the length the photons went, the column of air, from surface to top of atmosphere or something? There is no possible way an IR photon at 15 microns is going through 10,000 feet of air. It's blocked right near the ground. Gee whiz. Blocked and turned into kinetic heat. Please tell me where your 10,000 feet comes from.
-
Satoh at 13:21 PM on 16 November 2014CO2 effect is saturated
I don't know where your 10,000 feet comes from. I think you are confused by path length. When a solid or liquid emits a photon, it emits from a patent surface, the solid surface or the liquid surface, but when a gas emits a photon, being a gas, it emits from a region of space. Emissitivy is not calculated the same for a gas. The path length refers to the length between emitting molecules, in a straight line. The shorter that path, the greater the emissivity. The mean path length at sea level for photons between CO2 molecules was 33 mm years ago but I'm saying 30 mm now which is .03 m. The emissivity of CO2 at sea level goes along the curve of .0004 x .03 which is the .000021 I mentioned, which is not on the graph but you can visualize it.
-
Tom Dayton at 12:06 PM on 16 November 2014CO2 effect is saturated
Satoh, you're acting a lot like the Black Knight.
-
Tom Curtis at 11:56 AM on 16 November 2014CO2 effect is saturated
Satoh @343:
"... using 400 ppm and sea level path length of 33 meters you'd get a line that would read .0000121 atm m"
It is atmosphere - meters, not "atmosphere/meters". Ergo 400 ppmv (= 0.0004 atm) with a path length of 33 meters equates to 0.0132 atmosphere meters. The closest contour shown to that is 0.012 atmosphere meters (ie, pathlength of 30 meters with current atmospheric concentration of CO2). 15 degrees C (=288 K) is 519 Rankine, at which temperature the 0.012 contour approximates to an emissivity of 0.06. That is, just 30 meters of atmosphere at current CO2 concentrations and excluding the effects of water vapour eliminates 6% of upward surface emissions.
-
Tom Curtis at 11:48 AM on 16 November 2014CO2 effect is saturated
Satoh @341, at one point I refer to the graph posted by DeWitt Payne as the "second graph". That was potentially ambiguous, but was intended to refer to the graph with units of degrees Rankine on the x-axis (which is for CO2). Fig 1 (b) is, of course, for H2O, while figure 1 (a) is also for CO2. Refering to that, and considering the upper most line (4 foot atmospheres). With a CO2 partial pressure of 0.0004 (ie, 400 ppmv), that equates to 10,000 feet or 3,048 meters. As can be seen, that approximates to an emisivity of 0.2.
For the same distance, a pressure-distance of 20, corresponds to a partial pressure of 0.002 atmospheres which is a very low value for water vapour concentration, yet yields an emisivity of approx 0.6.
Cearly there are overlaps between CO2 and H2O absorption bands, but given the depth of the atmosphere, these are underestimates of the emissivities of the two gases for the full depth of the atmosphere. Therefore, as a reasonable sanity check on your claims, we can simply combine them by addition for a combined emissivity of 0.8 - indicating just 20% of surface emissions escape to space - and that in clear sky conditions. Therefore, correctly used as a sanity check, the Hotel emission graphs support the findings of Khiel and Trenberth.
-
Satoh at 11:38 AM on 16 November 2014CO2 effect is saturated
Ok see now, when you said 2nd graph you meant the 3rd graph at the bottom. Looking at that graph, which is for high pressure industrial use and doesn't come close to the atmospheric value, using 400 ppm and sea level path length of 33 meters you'd get a line that would read .0000121 atm m
-
Satoh at 11:21 AM on 16 November 2014CO2 effect is saturated
I meant @332
Convert 1 foot = .3 meters and visualize the line
-
Satoh at 10:44 AM on 16 November 2014CO2 effect is saturated
Tom, excellent work, except the second graph is for water vapor. The first is for CO2, which demonstrates the sea level values, seasonally averaged, that I gave in @322. I don't mean to criticize, it's a simple mistake.
-
Tom Curtis at 10:20 AM on 16 November 2014CO2 effect is saturated
As the discussion has turned to Hottel Emissivity, graphs, here are two, one for CO2 and the other for H2O:

And another with metric units for pressure length, but degrees Rankine for temperatures, CO2 alone:
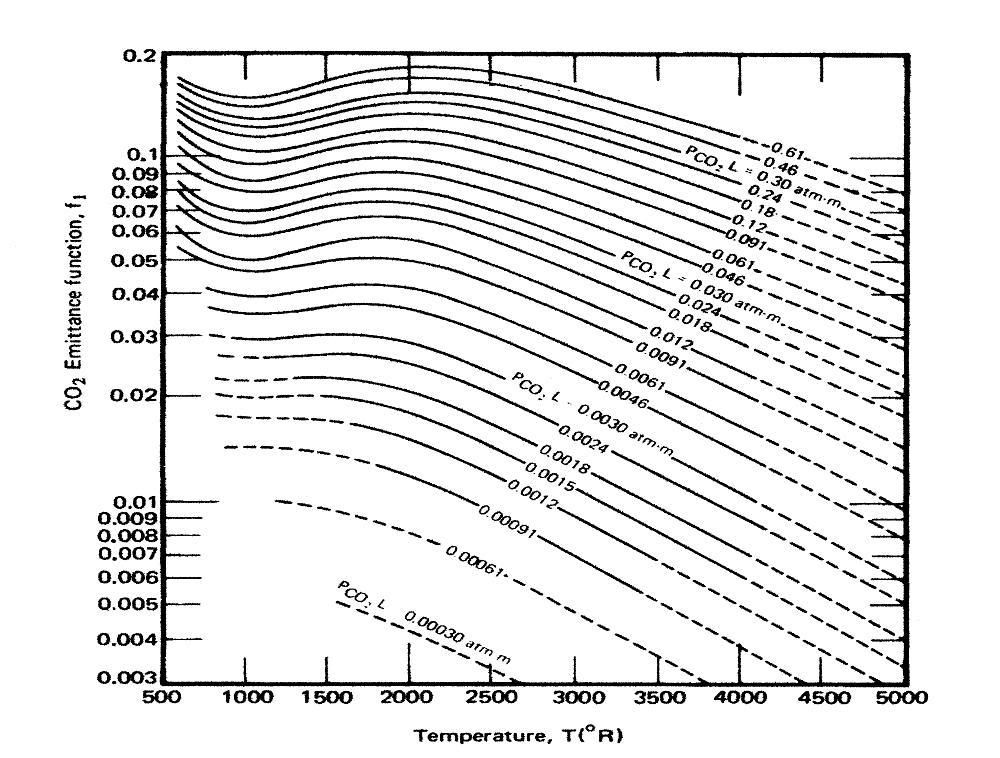
I have been unable to find graphs with metric units both for pressure-length, and temperature (or Imperial units for both). The second comes from a comment by DeWitt Payne on Science of Doom.
Elsewhere DeWitt Payne has two comments on how to interpret, and use such graphs. In the first, he attempts to clariffy a misconception about how to use the charts:
"It’s only low for a short path length. I’ve had this discussion before. If the path length is 1 m and the partial pressure is 0.00038 atmospheres then the Hottel emissivity curve to use is the one for 0.00038 atm m. If the path length is 10 km, then the mass path length is 3.8 atm m, which is well above the range of the Hottel charts I’ve seen, but puts the emissivity value for CO2 at ~0.2."
That clarrifies the relevance of the units of the curves, ie, the pressure-length, atmospheres per meter in the graph shown by DeWitt Payne (ie, the second graph above). That is, to determine the emissivity of CO2 at a given temperature, you determine the atmosphere-length by multiplying the partial pressure of the CO2 in atmospheres by the path length in meters. If the path length is 10 horizontal kilometers, and the partial pressure is 0.0004 atmospheres, the atmosphere-length is 4 atmosphere-meters (and hence well of the charts above). In an earlier post (@322) Satoh referred to "...the fact that at normal pressures and temperatures CO2′s emissivity is somewhere around 0.0019". The lowest line on the second graph above shows a atmosphere-length of 0.0003 amtmosphere meters (ie, about 300 ppmv over one meter). At 1500 Rankine (560 C), its lowest temperature value it shows an emissivity of 0.005, or about 2.5 times that quoted by Satoh. I presume the chart Satoh used had a shorter unit than a meter. Regardless he is clearly making the error DeWitt Payne attempts to correct in his discussion on SOD.
Having said that, DeWitt Payne's estimate of a 0.2 emisivity at standard pressures and temperatures for the full height of the atmospheric column is probably fairly close. That is because the emissivity is the total irradiated energy divided by the total irradiated energy of a black body with the same temperature. (See DeWitt Payne's worked example.) The consequence of this is that as temperature rises, total emission of a black body rises with the fourth power of temperature. Total emission of CO2 as a thermal emitter will also rise, but in bandwidths in which it already radiates strongly, at a far lower rate than with the fourth power of temperature. The result is a general decline in emissivity even while emissions at every wavelength in which emissions exist actually increase. The general decline is not absolute. If a potential emitting wavelength comes within the range of thermal radiation, it will initially increase its emissions at faster than the 4th power of temperature resulting a temporary rise in emissivity with temperature, as can be seen on the CO2 charts for temperatures between 1000 and 2000 Rankine (280-840 C).
The upshot of all this is that emission at a given wavelength for thermal emission always increases with increased temperature. When Satoh claims that "We all know, 200 K is very cold. If the elevation of this emitting layer of CO2 climbs higher, and therefore becomes colder, it makes the temperature closer to 200K and therefore the emission would be STRONGER, not weaker" (@320, refuted @321) he is simply wrong, and is not supported by the Hottel charts in that conclusion. On the other hand, when he says, as @334, "... the emissivity of CO2 goes up as the temperature goes down", he is (in general) correct, but it does not have the consequences he assumes. Put simply, emission is not emissivity. Satoh incorrectly assumes they are.
This diversion has not been without benefit, however. Contrary to his claim @337, his reference is a good one, showing Hotel charts for H2O alone (Figure 2) and CO2 alone (Figure 3) as well as both combined in other figures. I also claims that the Exponential Wide Band Model (EWBM) as well as Narrow Band Models (NBM) perform well, with accuracy primarilly limited only by the accuracy of the original spectral absorption lines in such databases as Hitran. Satoh, apparently, did not notice the endorsement, and that he has cited in his argument against the results of NBMs a paper that endorses them.
-
michael sweet at 09:12 AM on 16 November 2014CO2 effect is saturated
Satoh,
While I am not expert in IR spectroscopy, it flys in the face of reason for the total emmisivity to increase as the temperature decreases. The percent of emmisivity at a single wavelength could increase, but if the total emmisivity increased than a colder body would heat a nearby hotter body. That violates the first law of thermodymanics. Perhaps you need to review your posts and ensure you are not accidently claiming total emmisivity is increasing when you really mean relative emmisivity is increasing. But perhaps I misunderstand emmisivity since I am not an expert.
-
michael sweet at 09:01 AM on 16 November 2014CO2 effect is saturated
Satoh,
In general, in a scientific argument you must provide citations for any claim you make that is in dispute. If you say that Tom's claim is a "Brazen Bluster" you must provide support for your claim, which you have not done. Tom provided data to support his claims. If you fail to provide support (as you have done so far for all of your arguments), I presume that the support does not exist.
The unsupported claim of a random internet guy is not worth anything in a scientific discussion. When you finally provide a citation and it is the incorrect graph that does not make you look very well informed. I am not expert in IR spectroscopy, but I can read and understand the references. You must provide those references to support your claims to be taken seriously. It is not my job to Google all your claims.
-
Satoh at 08:28 AM on 16 November 2014CO2 effect is saturated
OK I checked my reference, those charts were for a mixture of H2O and CO2, with an emissivity 10 times higher than that of CO2 alone. I'll try to find a link to the Hottel charts. Otherwise, if you need citations, can you please tell me what information you need a citation for? I don't know what needs references and what is "widely known" and/or can easily be googled or wikipedia'd
-
Satoh at 08:06 AM on 16 November 2014CO2 effect is saturated
Michael, the classic reference that CO2 emissivity increases with decreasing temperatures is the Hottel charts, in use for at least 50 years and still the benchmark. I think this has them on page 552 of this old gem:
Moderator Response:[RH] Fixed link that was breaking page format. Please check out the link feature on the second formatting tab above the text box.
-
michael sweet at 07:56 AM on 16 November 2014CO2 effect is saturated
Satoh,
If you could provide some citations to support your claims it would be helpful. Tom has provided copius graphs and citations to support his claims. You have only your unsupported word. If you provided citations to support your claims it would be easier to judge them.
-
Satoh at 03:09 AM on 16 November 2014CO2 effect is saturated
Brazen bluster is saying that 80% transmission in the N band doesn't matter because sometimes it's cloudy, and making the straw man "when it's cloudy, transmission through the N band is essentially zero". Is there anybody who doesn't know about clouds? Since clouds cover around half the sky, that cuts it from 80% to 40% but it does the same to all other radiation. It's a complete straw man, tin man, and cowardly lion in one swell foop, and you can throw in the man behind the curtain.
Brazen bluster is claiming that CO2 is a grey body. Emissivity of a perfect black body is 1.0 (no units), so anything slightly less than that is a grey body. What shade of grey is 0.009 (no units). There are 50 shades of gray and that one wasn't in the book. Claiming CO2 acts like a bb radiator at the top of the atmosphere is brazen bluster, especially since the emissivity of CO2 goes up as the temperature goes down.
Moderator Response:[RH] Please ratchet the tone down a few notches.
-
Stephen Leahy at 02:00 AM on 16 November 2014Fact check: China pledged bigger climate action than the USA; Republican leaders wrong
Neither the US or China are global leaders on energy effeciency or carbon cuts but they could be if they wanted to.
An analysis by European climate science institutes:
Good Twins or Evil Twins? U.S., China Could Tip the Climate Balance
-
One Planet Only Forever at 00:55 AM on 16 November 2014Fact check: China pledged bigger climate action than the USA; Republican leaders wrong
wili,
The range of interpretation of the term 'low carbon' is indeed what I was highlighting. That term has traditionally been used to refer to an entire socioeconomic system implying that less carbon is emitted. Even in that context it is open to interpretation. A better use of the term is in reference to the direction of development, such as developing to a lower carbon emissions impact way of doing things.
However, I must clarify that questioning the intent of the term in relation to China's commitments is not meant to seriously diminish the significance of the commitment made by China. I just wanted to point out the need to clarify points that can be 'open to misleading claims'. China has clearly stated they will be capping their impacts by 2030 which is significant. However, in the full presentation of the details of the commitment which will be part of the 2015 formal commitments I wold want to see that the maximum per-capita level of China's impacts will be lower than the levels the USA developed to.
My main point was about the irrefutable fact that the USA and a few other countries increased their emissions after globally admitting that already well developed nations doing so was unacceptable, after agreeing hat those alreday well developed nations would be the leaders and needed to show leadership. The actions of those nations to further increase their unaccepable impacts over the for 15 years after declaring how unacceptable it would be to do such a thing provides an irrefutable basis for the likes of China and India to thumb their noses at requests for them to cap their emissions before their nations reach the level of development that the USA had reached by 1990.
The fact that the likes of the Repubican Leadership have tried to claim the USA should not be reducing its emissions unless nations like China and India also have caps set at lower per-capita emissions than the USA developed to in 2005 is incredibly galling since these are people fully aware of all the facts and very aware of the claiims they make. Their behaviour on this issue indicates that the USA has the potentially stopped being a global leader toward a better future for all, and maybe that end of USA global leadership pre-dates 1990. Maybe the USA never was leading toward the development of a sustainable better future for all. And as seen in the chart in the article China will be setting a 2030 per-capita cap on their emissions that is signficantly lower than the level the USA was at in 1990. The USA 5000 Mtonnes (6127 Mtonnes GHG equiv), for 250 million matched matched by China's current population of 1400 million would be 28,000 Mtonnes CO2 (34,000 Mtonnes GHG equiv), and China will not be near that number by 2030. As indicated in the chart in the article the BAU expected emissions in China by 2030 would be about 16,000 Mtonnes CO2 which would be 40% less than the USA per-capita impacts in 1990. So China is showing more global leadership than the USA commitment.
p.s. I have presented information on a per-capita basis which I know raises challenges that global population growth is 'the problem'. While there are many things affected by global population growth the CO2 emissions problem is caused by the people with high per-capita impacts. And what is clearly indicated is a need for a global maximum cap on total accumulated emissions in the near term with a low total global allowance per year after that time for humanity to sustainably develop a beter future for all.
-
wili at 22:08 PM on 15 November 2014Fact check: China pledged bigger climate action than the USA; Republican leaders wrong
I assumed "low carbon sources" meant essentially all non-fossil fuel sources--hydro and nukes as well as wind, solar and other renewables. But perhaps the openness of the term does leave them some wiggle room for interpretation.
-
MA Rodger at 20:11 PM on 15 November 2014More research confirming large methane leakage from shale boom
Moderator Response @21.
The document rather confusingly has the title "Introduction", it being Chapter 1 of IPCC AR5 WG1. I am at a loss as to the relevance of the point the commenter Russ R. is attempting to make. The IPCC themselves describe in that reference that estimates for as-then future CH4 emissions in AR4 were too low. Russ R. presents this as the IPCC being "wrong," saying "methane is turning out to be not as big a climate issue as we were told it would be." Yet I fail to see any "big climate issue" that has been mis-described. Whatever the point he attempts to make, the "issue" Russ R. describes can only amount to an underestimation in climate forcing of some 0.02Wm^-2 which is not what anybody would call "big" in climate terms.
Moderator Response:[JH] Thank you for identifying the document. Not all of our readers are climate science-wonks who would recognize the document by merely viewing its content.
Re Russ R's modus operandi: As noted by gws @22, he/she seems to be fishing for red herrings. Some might call that trolling which is prohibited by the SkS Comments Policy.
Prev 673 674 675 676 677 678 679 680 681 682 683 684 685 686 687 688 Next


