


 Arguments


Recent Comments
Prev 739 740 741 742 743 744 745 746 747 748 749 750 751 752 753 754 Next
Comments 37301 to 37350:
-
Rob Honeycutt at 11:24 AM on 14 March 2014A Hack By Any Other Name — Part 5
Lucia... So, the one comment you come here to make is a spoiler?
-
Timothy Chase at 10:32 AM on 14 March 2014Climate change and sensitivity: not all Watts are equal
Kevin C writes in 7:
StBarnabas: In this context, uniform heating means uniform between the northern and southern hemisphere,... Non-uniform heating involves the same total global heating, but more of it occuring in the southern hemisphere where it has less impact on temperatures.
Personally, I would still expect the northern hemisphere to warm more quickly than the south, both for the 20th century and for the period of modern global warming, from 1975 to present. There is more land than water in the northern hemisphere, and given that land has less thermal inertia, it has been able to warm more quickly. Then with the atmosphere as the intermediary, I would expect the land to drag the northern oceans along with it.
In any case, at least for the two hemispheres as a whole, the northern hemisphere warmed more quickly than the southern but was was more sensative to aerosols mid-century, with some cooling from 1940 to 1980, whereas there was only a single year of statistically significant cooling in the southern hemisphere.
Tamino states:
The cooling effect of man-made sulfates also helps explain the hemispheric asymmetry in temperature history. Most industrial activity is in the northern hemisphere, so most of the anthropogenic sulfate cooling should be there too. The northern hemisphere has warmed faster than the southern because there’s more land in the north than the south, and land has far less thermal inertia than ocean. But if sulfates are mostly in the northern hemisphere, that means that there should have been a stronger mid-century cooling effect in the north than in the south — and that’s exactly what we observe:
Anthropogenic Global Cooling
August 23, 2010
http://tamino.wordpress.com/2010/08/23/antrhopogenic-global-cooling -
Timothy Chase at 10:12 AM on 14 March 2014Climate change and sensitivity: not all Watts are equal
BaerbelW wrote in 4:
Re. RealClimate: not sure what's going on but when I try to go to realclimate.org I immediately get a "Forbidden - You don't have permission to access / on this server."
That sounds like a shutdown in response to attack, possibly due to an intrusion, similar to the Climategate upload. The details are more likely to be discussed in a less public forum.
-
Timothy Chase at 10:06 AM on 14 March 2014Climate change and sensitivity: not all Watts are equal
Wili wrote in 1:
OT question: Has anyone else had trouble getting onto RealClimate recently? Are they shut down for maintanance, or under cyber attack?
Earlier this week I had trouble but was able to get through shortly after that. My assumption was a DDoS attack by someone incompetant. If it were down due to maintanence I would expect it to remain down for a bit rather than be available only half a minute or so later. So DDoS seemed a safer bet.
-
Tom Curtis at 10:04 AM on 14 March 2014Global warming not slowing - it's speeding up
In addition to 27, Tisdales graph only plots heat gain since mid-2005. That means he only plots it over a period in which the SOI has shown a distinct, and very strong trend towards record high levels (ie, from record high El Ninos to record low La Ninas). The tongue of water that is modulated by ENSO lies, primarilly, just south of the equator. Large changes in ENSO, therefore, may well have significantly different effects in either hemisphere, so that may be another major factor in the difference.
-
Tom Curtis at 09:58 AM on 14 March 2014Global warming not slowing - it's speeding up
Rob, Scaddenp, if you actually run the numbers, then based on the trends in the graph, the NH oceans are gaining energy at a rate of 21 million Joules per meter squared per decade. In contrast the SH oceans are gaining energy at 271 million Joules per meter squared per decade. That is, the SH is gaining heat 13 times faster than the NH per unit area, which would definitely seem to support Hyperactive Hydrologist's suggestion. I suspect, however, that there are other major factors involved. One such factor could be that the Indian Ocean is almost entirely a SH ocean, with heat gained in the NH portion of the Indian Ocean being directed to the SH be geography.
-
lucia at 09:53 AM on 14 March 2014A Hack By Any Other Name — Part 5
Moderator Response:[JH] Part 6 was mistakenly posted by an SkS Administrator earlier today. When the mistake was recognized, Part 6 was replaced with Part 5.
[BL] Come on, Lucia, you can wait a few days for Part 6 to be published.
-
scaddenp at 09:20 AM on 14 March 2014Global warming not slowing - it's speeding up
Good point!
-
Chris McGrath at 09:08 AM on 14 March 2014A Hack By Any Other Name — Part 5
Thanks Bob, this is a facinating read even for a non-IT person like me. I'm on the edge of my seat to find out the riddle to how "he" got in. You are almost being cruel in keeping us hanging in suspence, except that it makes the story like a good detective novel.
By the way, you keep referring to the hacker as "him". If you don't know the hacker's identity, why assume it is a male?
-
Rob Honeycutt at 08:48 AM on 14 March 2014Global warming not slowing - it's speeding up
scaddenp... It also seems like Tisdale's chart is, to a certain extent, just telling us the southern oceans are larger than the northern oceans.
-
scaddenp at 08:25 AM on 14 March 2014Global warming not slowing - it's speeding up
Not that easy to get NH/SH data and I would guess ocean mixing would blur the signal anyway, but that "reliable" source of information, Bob Tisdale, seems to have done the work and produced this:
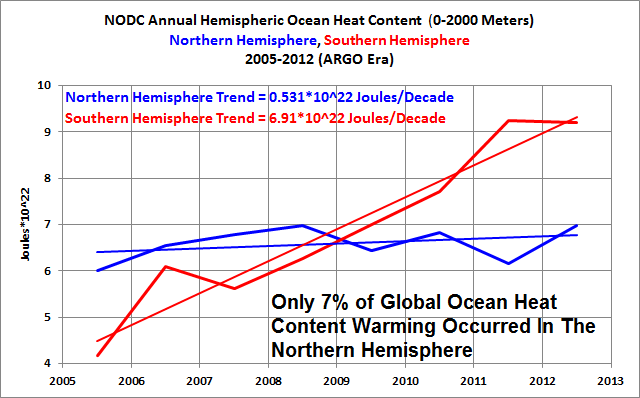
He uses this as argument against GHG warming, but assuming he has got the numbers right, then yes, SH is warming faster than NH. However, OHC rises mostly in the tropics and I dont think there is much difference between 0-10N and 0-10S.
Moderator Response:[RH] Reduced image width.
-
Hyperactive Hydrologist at 05:12 AM on 14 March 2014Global warming not slowing - it's speeding up
Is ocean heat content increasing faster in the southern hemisphere? If so would this add weight to the idea that the northern hemisphere is experiencing increased dampening due to aerosols?
-
Hyperactive Hydrologist at 05:03 AM on 14 March 2014The Extraordinary UK Winter of 2013-14: a Timeline of Watery Chaos
The worrying thing of me is that we are barely at 0.8oC and the planet is regularly experiencing extreme event that would, under staionary conditions, have a less than 1-0.1% chance of annual occurance. What happens when we reach 2, 3 or even 4oC of warming? A lot of attention is given to projected temperature changes and climate sesitivity but what happens if the most extreme weather event occur at a lower temperature increase than originally predicted.
-
Timothy Chase at 04:39 AM on 14 March 2014Global warming not slowing - it's speeding up
Last night I got the chance to read the entire article. I really enjoyed it.
The essay is essentially a review, bringing together a great deal which to some extent has may have been said before, but giving the reader an organized, more manageable overview of the topic. It does a good job of explaining the masking, the apparent slowdown and the so-called "pause"in warming, that the warming in the climate system is still taking place and why we should expect to see a great more of it in the future. The essay also does a good job of explaining how the meme of the "pause" in warming gained currency.
One question occured to me, though. Is the accelerating melt of Arctic sea ice actually evidence of accelerating warming?
Given that ice undergoes a phase transition at fixed temperature, if temperature were increasing at a constant rate, it would seem that melting would accelerate over time. If so, it would seem that observing melt accelerate over time cannot in itself be regarded as evidence of an increase rate at which the system warms.
Regarding the section title "Temporary factors are masking surface warming"...
I think that at this point there is a tension between "masking" as it might be commonly understood versus "masking" as it get technically used in climate science. Someone with a non-technical background, such as myself, may find it relatively easy to understand how temporary factors may mask warming, that is, in the sense that the warming is still taking place, but simply not visible to us but will later be unmasked. In this sense, they are understanding the term as a metaphor.
For example, during a La Nina more heat is absorbed by the deep ocean, so the warming is still taking place, just not at the surface, where we would experience it. But later on, during an El Nino, the heat is brought back to the surface, where we experience it, and after the El Nino temperatures tend to remain higher than they were before.
However, when you say "Temporary factors are masking surface warming" I believe you have already stepped beyond this common, metaphorical understanding, although at a certain level you are still relying on metaphor. As such, for someone with a non-technical background, it might make more sense to say that temporary factors are masking "future surface warming."
As the term "masking" is technically understood, including the word "future" is redundant. However, for someone with a non-technical understanding it is suggestive of how our expectations of how high or quickly temperatures will rise are built upon what we have already experienced. Yet it also suggests that appearances may be misleading due to temporary factors. These factors, including the volcanic aerosols or cooler phases of the solar cycle, where there is little warming of any part of the climate system, hide or "mask" the warming that will actually take place in the near future.
As such, while the term "future" is technically redundant, implicit for someone with a technical background, it would be helpful for the rest of us if you were to say "mask future surface warming."
One last detail: the link to Precarious Climate actually goes back to Skeptical Science.
In any case, I believe the article is quite good. I am looking forward to going back, re-reading it for my own understanding, and linking to it for other people. It brings things together on a variety of levels. I consider it a valuable addition to the Skeptical Science corpus.
-
Duncan at 02:07 AM on 14 March 2014They changed the name from 'global warming' to 'climate change'
Great article, as usual. I love your site. It is incredibly useful.
I just wrote a short and simple blog about this very topic, focusing on what "big data" (via Google Books Ngram Viewer) can tell us about this question. There are some interesting differences in the results between "American English" and "British English".
If you follow climate change/global warming, you will likely encounter people who insist that the term “global warming” was changed to “climate change” for various reasons (e.g., “global warming stopped, so they changed the name”, etc.).
One way to test this hypothesis is to tap into “big data”, in this case Google’s database of English books. Google has a cool tool called the “Ngram Viewer”, which allows you to determine the frequency of words and phrases in their database of books. What does Google’s Ngram Viewer tell us about this hypothesis?
Read more here: http://ow.ly/uy2fv
-
Cedders at 23:38 PM on 13 March 2014CO2 lags temperature
Thanks, both. I've downloaded the Ocean Acidification booklet and will work my way through it. I'm not a scientist, but to me it looks like the temperature effect (evident from the ice cores) is big enough to consider when looking at saturation of ocean carbon sinks; possibly also to investigate in reducing carbon budgets to fit a concentration pathway. If ECS is defined as equilibrium when holding pCO2 steady, then I presume it's not included there.
-
chriskoz at 22:38 PM on 13 March 2014Climate change and sensitivity: not all Watts are equal
RealClimate is up and kicking...
Recent article by gavin contains an apparent typo: "It never rains but it pause" (my emphasais) but gavin explained it to be an intentional pun. Can you guess the pun? Hint: think about rhotic british-like pronounciation (well represented by gavin himself) and what's happening in UK right now....
-
gpwayne at 22:36 PM on 13 March 2014Global warming not slowing - it's speeding up
I have to ask about this statement:
"If the trend is extended forward into the future, the Arctic Ocean will soon be entirely liquid."
My first reaction was to suggest that the statement is incomplete, and that it should continue "...in the summer months". Then again, is there any evidence that if all multi-year ice disappears, there will be no surface ice at all in winter?
Moderator Response:Fixed. - James
-
chriskoz at 21:45 PM on 13 March 2014Global warming not slowing - it's speeding up
Another typo (although trivial) in Australian record:
Hottest October day (42.6°C on 31 August)
date is incorrect. I think you mean this source: Northern Territory in October 2013. The relevant statement:
Alice Springs Airport also set a new record for highest October daily maximum temperature with 42.6 °C on the 10th, the previous record 41.7 °C set on 24 October last year.
so the correct (and perhaps sounding stronger) statement would be:
October daily maximum broken back to back: 24 October 2012 (41.7 °C) and 10 October 2013 (42.6 °C) in one location (Alice Springs)
The original statement incorrectly suggests the record is applicable to the large (Australia-wide?) context, while in fact it is only about local (Alice Springs) context.
-
Cedders at 19:46 PM on 13 March 2014How do meteorologists fit into the 97% global warming consensus?
On Tuesday in the UK House of Commons, one of the members of the select committee on Energy and Climate Change, Graham Stringer MP, asserted that "50% of the meteorologists in the United States are unhappy with the conclusions of the IPCC" (at 1h24m) which led to some disagreement with the relevant Minister as Stringer did not have any source to hand. From a web search, I think this figure may have originated here, based on a 2008 survey of TV weather forecasters and commentary in an AMS journal (available online via Heartland).
(Committee sessions are a disappointing example of the science-policy interface. Stringer and Peter Lilley MP seem to me to be successfully obstructing discussion about important topics such as carbon budgets by focussing on odd details such as p1010 of WG1 SYN. The committee had previously interviewed Richard Lindzen, giving his affiliation as Professor at MIT, whereas I believe he's now at Cato Institute and we should normally refer to him as emeritus professor. It cannot be said they aren't giving space to contrarians.)
Regarding the 2011-12 survey of AMS members, a sample of the email that appeared to come from AMS is available at the Bad Astronomy blog. (James Taylor of Heartland wrote the misinterpretation of the survey, but has not responded to challenges to comment on Heartland tactics, Cindy Baxter etc.) -
chriskoz at 19:45 PM on 13 March 2014Global warming not slowing - it's speeding up
Here's my nitpick to this excellent all round article.
Among the list of Australian records:
South Australia’s previous record warm September exceeded by 5.39°C
I stare in disbelieve: no, cannot be... that would mean some 5-sigma event, perhaps more than the recent heatwave in Moscow, which would not escape wolrd's attention. So I found & verified the source: BOM - SA in 2013. And surely, the relevant statement sais:
Spring saw another heat event, with record high daily September temperatures reported across several locations throughout pastoral districts. September as a whole for the State was extremely warm, with an anomaly of +5.39 °C, beating the previous September record by almost two degrees, and also the largest anomaly observed for any State or Territory in any month
(my emphasis)
Still very, very unusual, but unlike the article above, probable. Obviously, the article text is a misunderstanding/typo. So, please fix the typo accordingly, it could say for example:
South Australia’s previous record warm September exceeded by an unprecedented almost 2°C (5.39°C above average)
to reflect the source accurately. Thanks.
Moderator Response:Fixed. - James
-
peter prewett at 16:19 PM on 13 March 2014Global warming not slowing - it's speeding up
I think there is a repeating para under fig 5.
-
R. Gates at 15:07 PM on 13 March 2014Global warming not slowing - it's speeding up
This was an excellent post and a great resource for discussions with the few remaining honest skeptics (as opposed to the fake kind). Earth's climate system appears to be on the doorstep of undergoing a change such as it has not seen in many millions, or possibly tens of millions of years.
One key part of the climate energy puzzle integral to ocean heat content and a key driver of the climate is the Indo-Pacific Warm Pool. The IPWP has been gaining energy steadily since the 1950's. As the source energy for El Ninos, it can be thought of a spring that has been slowly compressing and is now full of potential energy. If it releases a big part of this energy all at once as it did in the mega El Niño of 97-98, the entire globe will experience the kind of past year the Australia had in 2013 with temperatures literally off the charts.
-
Glen Speering at 11:19 AM on 13 March 2014Carbon Dioxide's invisibility is what causes global warming
Thanks for taking the time to illustrate this very important point, so I don't have to!
-
Sapient Fridge at 10:52 AM on 13 March 2014Global warming not slowing - it's speeding up
Duplicate paragraph starting: "But you don’t have to trust the University of York"
Moderator Response:Fixed. - James
-
babazaroni at 09:37 AM on 13 March 2014Global warming not slowing - it's speeding up
Keithpickering at #8, thanks for the interactive link. Check out 2011. It peaked very similarly to this year, but it hung on near the peak for quite some time.
-
Tom Curtis at 08:57 AM on 13 March 2014Global warming not slowing - it's speeding up
First, an excellent post allround. I do have a slight niggle, however, about attributing Cowtan and Way to the University of York. Unless the University has endorsed Cowtan and Way as an official dataset, which would be most unusual, the data should be referred to as Cowtan and Way, ie, by the names of its publishers. In that context, I note that the dataset is hosted at Dr Cowtan's personal page at the University, rather than by the University directly. Indeed, the page links to a disclaimer (legal information), which states:
"The University does not monitor personal staff or student pages published independently of their work at the University. The views and information on such pages do not constitute official University information, and need not reflect the views of the institution. The information on personal staff and student pages is not provided by the University. Consequently, the institution does not and cannot guarantee the accuracy of such information. All authors, whether publishing official University information or unofficial personal information, are expected to follow the University's Regulations for the use of computing facilities."
(My emphasis)
For completeness, it should be noted that "HadCRUT4 krigging", Cowtan and Way, and the "University of York" data sets are all the same data set, or at most slight variations from the same authors. I am certain the different labelling is purely an accident from using existing resources in which the data was differently labelled.
-
Tom Curtis at 08:41 AM on 13 March 2014Cartoon: the climate contrarian guide to managing risk
Russ @76, that fairly represents your argument.
For my part I have shown @67 that rises in electricity prices have, and are projected to fall well below the LTEP 2010 estimates, and that ergo Fox and Gallant were in error. I have also pointed out a clear ambiguity in the statement by Smitherman which neither you nor Fox and Gallant have sought to illucidate, and which both you and Fox and Gallant have disambiguated in the least likely way.
On that second point, it is difficult to disambiguate without context, so I looked through the Ontario Hansard record of debates. I was unable to find the statement attributed by Fox and Gallant in the relevant time period. There were references to a similar statement to the press, however. Smitherman was questioned on that on March 24th, and responded in part:
"We anticipate, over three years, from 2010 to 2012, the first approximately $5 billion of incremental investment, and over time, we expect that the Green Energy Act will contribute 1% per year to the growth of electricity costs for Ontarians, with opportunities for them to use less electricity as well."
That statement makes it crystal clear that opportunity cost is mentioned, not nominal cost. That is, the growth in electricity costs under the Green Energy Act will be whatever they would have been without the Green Energy Act, plus 1%. It is clearly not a predicted growth in nominal costs as you and Fox and Gallant implausibly interpret it. That demonstrates that you, and Fox and Gallant have been making an apples and oranges comparison. You have been claiming a refutation of a statement about opportunity cost based solely on an analysis of nominal costs.
Further (and this is a new point), you have not even been making the nominal cost comparison correctly. As part of the Green Energy Act, measures were taken to reduce consumption of electricity by making energy use more efficient. That is part of the plan, and the costing of the plan must include those efficiency gains if it is to be valid. The costs assessed, however, have been for a constant 800 kWh per month bill. That is, it excludes any savings from improved efficiency of use.
In the 2010 LTEP, it is estimated that conservation (ie, reduced electricity demand due to more efficient use) will account for 14% of "production". For a true apples to apples comparison under the plan, therefore, the comparison should be between 800 kWh per month in 2010 vs 690 kWh in 2030, ie, 800 kWh less 14% conservation. Allowing for this, that yields an incremental real cost of 1.65% per annum for the average household in Ontario.
-
Andy Skuce at 07:53 AM on 13 March 2014The Editor-in-Chief of Science Magazine is wrong to endorse Keystone XL
There's a good piece in the Vancouver Observer today that skewers the logic of the people who claim that, since we can't stop the expansion of the oil sands, we may as well appear reasonable by approving the construction of massive new bitumen transportation infrastructure.
As the author, Barry Saxifrage, points out, the argument only makes sense once you concede that all of the Copenhagen targets will be missed and that we stay on a business-as usual emissions trajectory. This is self-fulfilling defeatism. Since "future generations will be roasted, toasted, fried and grilled." (that's the IMF speaking, not some crazed environmentalist), a single pipeline won't make much difference, surely?

-
Tom Curtis at 07:38 AM on 13 March 2014CO2 lags temperature
Ceddars @435, supplemental to Scaddenp @438, IF global temperatures had risen by 1 C without any anthropogenic of volcanic increase in CO2, ocean outgassing would have raised CO2 levels by about 10-20 ppmv. The increase in atmospheric concentration from anthropogenic emissions is far greater than that, so CO2 has entered the ocean rather than left it. However, it would have entered it more readilly without the temperature rise, so that if anthropogenic emissions had been the same, but temperature not risen, there would have been about 10-20 ppmv less CO2 in the atmosphere, and correspondingly more CO2 in the ocean.
The consequence is that the reduced capacity of the oceans to absorb CO2 as they warm is not included directly in transient or equilibrium climate response estimates, they are included indirectly for that effect is included in historical rises in CO2 concentration, and partially and in estimates of future rises. There is a slight kicker for simple models that use a linear retained fraction of atmospheric CO2, in that the ability to absorb CO2 will fall with further rises in temperature, but the effect will remain small relative to anthropogenic emissions. It will only result in increases of about 10-30% in CO2 concentration. That works out at about 1 W/m^2 of forcing, or the equivalent of about 0.75 C increase in eqilibrium temperature. So simple models will likely underestimate temperature rises by a small amount. I do not know to what extent GCMs already include the effect.
-
Tom Curtis at 07:22 AM on 13 March 2014CO2 lags temperature
Cedders @437, when looking for other proxies, Dana Royer's publication page is a wise place to start. In particular, his 2004 paper with others, uses a dO18 proxy to reconstruct temperatures over the last 500 million years, which is presented below along with the known forcings over that period:
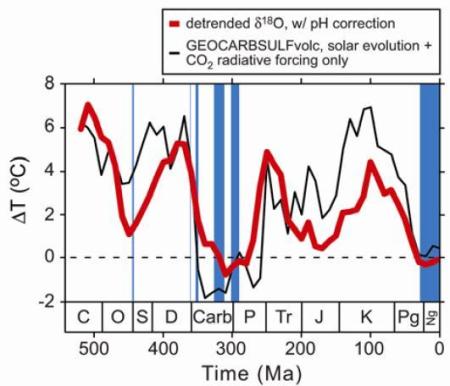
(The image is from a slide for a talk, and presented in a non-peer reviewed article in 2009, but the reconstruction is from the peer reviewed Royer et al (2004).)
That reconstruction has better time resolution than scotese's graph, but the time resolution is still restricted. Consequently Royer (2006), which looks at CO2 concentrations with reference to glacial states at a much higher time resolution is also of interest.
-
RemootSensing at 06:37 AM on 13 March 2014Global warming not slowing - it's speeding up
Sorry, I see a point that should be corrected in the article. At one point it is mentioned that "In a La Niña phase, warm water sinks, bringing cold water to the surface." That is not accurate.
During a La Niña, easterly trade winds at the equator increase causing increased upwelliing along the coast of South America and eventually spreading to the west. Due to the change in the easterly trade winds, warm water "piles up" in the western Pacific. So warm water sinking does not bring cold water to the surface. From a first prinicples perspective, we have the opposite occuring.
However, the combination of a negative phase IPO and more neutral/La Niña events since 2000, it is not suprising to see the results in figures 1 and 4. More energy is required to warm the cooler waters, so the rate of atmospheric warming will be reduced. Still warming, but at a lower rate. Much as we talk about the energy balance at the top of the atmosphere, this is an energy imbalance at the ocean/atmosphere boundary. So the result in figure 4 has a good physical explanation.
In addition, the cooler water in the Pacific is being warmed, and the warm water "piled up" in the west must go somewhere. Yes, some energy will go to the atmosphere, but I believe this is part of the mechanism for increased ocean heat content observed more recently. Not sure of the exact mechanism (some combination of conduction and convection with regards to heat transfer) but seems to fit the data correctly. So, the impact is increased ocean heat content, at a higher rate than before, as seen in figure 1.
Moderator Response:I've tried to concisely amend my original post; hopefully it's now more accurate. As an amateur I sometimes get confused about these circulation patterns, but the important point is that heat is cycling through the atmosphere and ocean. - James
-
scaddenp at 06:00 AM on 13 March 2014CO2 lags temperature
Cedders - the feedbacks that work with the Milankovich cycle are slow. With around 1000 year cycle time, the ocean's wont be outgassing anytime soon. At the moment, oceans are mopping up much of our emissions (See the OA is not okay series for detail). CMIP3 models did not include carbon cycle feedbacks. I believe that some of the CMIP5 model are "earth system" models with these feedbacks included, but they have little impact on what happens in the next 100 years.
As to measurable - Ocean pH and isotopic composition of CO2 in atmosphere would both constrain estimates of outgassing.
-
dana1981 at 05:57 AM on 13 March 2014Global warming not slowing - it's speeding up
Links should be fixed now. Apologies for the delay.
-
rlandolt at 05:03 AM on 13 March 2014Global warming not slowing - it's speeding up
article with live links:
http://precariousclimate.com/2014/02/11/global-warming-not-slowing-its-speeding-up/
-
StBarnabas at 04:57 AM on 13 March 2014Global warming not slowing - it's speeding up
Nice post
I have argued for years that the IPCC are too cautious and the reality is likely to be a lot worse. Good to see Kevin C's paper getting such a prominent mention. Most scientists are not that media savvy, unlike the right wing press who know how to brainwash the gullible. I have no clue here but many like to live in a comfortable alternative reality
-
keithpickering at 04:00 AM on 13 March 2014Global warming not slowing - it's speeding up
One more point about Arctic sea ice this year: according to the interactive chart on Cryosphere Today, ice area peaked on Day 53 at 13.08 million km². Not only is this the earliest peak on record (I believe), but last year area didn't drop that low until Day 104, a whopping 51 days later. So in effect we've gained an additional 7 weeks of melt season this year compared to last year.
-
keithpickering at 03:39 AM on 13 March 2014Global warming not slowing - it's speeding up
Nice post, Jim, but from here it appears that all the "(Source)" links just point back to SkS main page. Fixable, I hope.
-
Rob Honeycutt at 03:16 AM on 13 March 2014GWPF optimism on climate sensitivity is ill-founded
But Dana, facts can be a very mean thing when they don't conform to one's predetermined outcome. They rattle the bars of the cognitive dissonance cage.
-
DSL at 03:16 AM on 13 March 2014Global warming not slowing - it's speeding up
After September's "recovery," Arctic sea ice area is now at a record low for the date and has possibly hit winter max. If so, it would be a record low winter max for area.
-
John Mason at 03:10 AM on 13 March 2014Global warming not slowing - it's speeding up
The guys are onto it....
-
dana1981 at 02:34 AM on 13 March 2014GWPF optimism on climate sensitivity is ill-founded
Re Tom @44, what bothered me the most about our exchange with Pielke Sr. was that the comments were perfectly polite but challenged him on the science, and he would then run back to his blog and write a post about how mean we were being to him. Similarly, contrarian commenters will often blatantly violate commenting guidelines, then cry censorship when those comments are deleted. Classic victim complex.
But now I'm getting off topic and verging on violating the commenting guidelines myself! So I'll bring it back on topic by noting that ATTP has a good post on Shindell and Lewis.
-
Composer99 at 02:30 AM on 13 March 2014Global warming not slowing - it's speeding up
Want to echo KeenOn350's comment: lots and lots of broken/dead links in the OP.
-
wili at 02:20 AM on 13 March 2014Global warming not slowing - it's speeding up
Yes, the "beyond our capacity to adapt" link doesn't work for me, and I'd be interested to look. Does it link to an article on wet bulb temperatures, or to something else?
-
Esop at 01:57 AM on 13 March 2014Global warming not slowing - it's speeding up
Most excellent article. The deniers carefully ignore the oceans, but just wait till the next Nino and a likely new surface record. Then the ''skeptics'' will be all over the ''missing rapid increase'' in ocean heat content in that Nino year.
However, it will be hard for them to spin away a new surface record and likely record low Arctic sea ice in the same year. They will try, though, be sure of that.
-
KeenOn350 at 01:14 AM on 13 March 2014Global warming not slowing - it's speeding up
excellent post -
seem to be some broken links, where href comes out as
http://www.skepticalscience.com/%5C
Moderator Response:The links problem was my fault. Sorry about that, but it's fixed now. - James
-
Russ R. at 00:11 AM on 13 March 2014Cartoon: the climate contrarian guide to managing risk
Tom Curtis,
My apologies to both you and the moderators for my earlier inappropriate comment. Please know that it was in no way intended to be either insulting or inflammatory.
I was going to walk away from this particular debate because I feel that the discussion has dug too deep into the weeds to be relevant to the purpose of the thread, and was no longer worth the time and effort. Instead, I will continue.
"...the actual facts with regard to Ontario show that the opportunity cost of switching to carbon reduced (not quite carbon free as there will still be some gas generation) is low, possibly even negative (ie, a positive benefit); and that they were initially overstated in the formal document presenting the plan. My question is, are you prepared to acknowledge that fact...."
No, but only because I don't believe that you've presented a convincing case.... yet. Perhaps you will, and I'm open to that possibility. If the numbers do support your argument, then I will gladly accept it, and adopt it going forward.
So before we continue, let's recap, with direct quotations to avoid ambiguity:
- I argued that the insurance analogy in the cartoon was inappropriate for a few reasons, but the one we're focused on is that "they don't tell you the cost of your premiums in advance".
- When challenged on this, I offered to provide if requested, "evidence of the public having been misled about the costs of mitigating global warming, only to discover the true costs once the policy was enacted."
- As requested, I presented Ontario's Green Energy Act as an example showing evidence of what was promised to the public before the law was passed: ("One percent per year, incremental on the cost of a person’s electricity bill, with corresponding capability through investments in conservation for people to lessen their use of electricity").
- I also presented evidence that after the law was passed the government announced electricity price increases that were materially higher than what was promised: ("The consumer rate will increase by about 3.5% annually over the length of the long-term plan. Over the next five years, however, residential electricity prices are expected to rise by about 7.9% annually (or 46% over five years)."
- Lastly, I linked to an additional study that argued that estimates underlying the government's announcement omitted a number of costs, which "would raise power bills by 40% above the government’s forecast.".
Would you agree that the above points accurately summarize my argument prior to your challenge @47?
-
gpwayne at 23:32 PM on 12 March 2014Climate change and sensitivity: not all Watts are equal
Just a quick addition to John's summary; Shindell's paper also noted an interesting thing, which is that any reductions in aerosols in the future would also have a warming effect, but while the RCPs do model aerosol trajectories, most of the attempts to minimise potential TCR or ECP do not (another function of the cherry picking involved, I guess).
-
Cedders at 22:40 PM on 12 March 2014CO2 lags temperature
Thanks, Tom. I'll think of that temperature plateau as an artefact, and look for other proxies.
My other question remains. Does it make sense? Is effect of degassed CO₂ released from warming oceans (a) measurable; (b) a substantial feedback; (c) already included in models?
-
Cedders at 22:23 PM on 12 March 2014IPCC overestimate temperature rise
BTW a later article by Monckton (2012) does another odd thing with IPCC projections, based purely on arithmetic. The final comment there is mine and intended to be read side-by-side with the article. It took some time to work out what Monckton was doing, which was back-projecting the same figures from the projections to obtain estimates for warming in 1960-2008, first assuming the CO₂-temp relationship was logarithmic, secondly that it was linear. Unsurprisingly he finds a discrepancy between those two results, but he assumes that is a flaw in the models (!).
I didn't start from an ad hominem premise, but can't help trying to understand what was driving Monckton in that article. In the Meet the Sceptics (2011) documentary, he claims to have cured himself of Graves' disease. As I understand it, mental confusion is an occasional symptom of hyperthyroidism. I don't mean that gives additional reason to dismiss his varied claims, but it might invite a more sympathetic response.
Prev 739 740 741 742 743 744 745 746 747 748 749 750 751 752 753 754 Next


