


 Arguments


Recent Comments
Prev 791 792 793 794 795 796 797 798 799 800 801 802 803 804 805 806 Next
Comments 39901 to 39950:
-
Michael Whittemore at 00:50 AM on 8 February 20142013 was the second-hottest year on record without an El Niño
My comment at 22 is wrong Dana is spot on as usual. :)
-
Michael Whittemore at 00:48 AM on 8 February 20142013 was the second-hottest year on record without an El Niño
Markoh, I personally think that El Nino's are natural and knowing they will happen soon and help the public see that the Earth is getting warmer is a good thing. Like what was stated before, we can feel fine about them because they don't last very long, unlike man made CO2.
-
Michael Whittemore at 00:39 AM on 8 February 2014How Increasing Carbon Dioxide Heats The Ocean
Geoengineering might work well if the sun was blocked from hitting the oceans in areas where there is not much life. Also reducing sun light from hitting the Arctic might help sea ice stay in summer and increase its volume.
-
Michael Whittemore at 00:21 AM on 8 February 20142013 was the second-hottest year on record without an El Niño
"Climate scientists didn't panic and decide the short-term acceleration in rising surface temperatures (didn't mean)? that climate models were underestimating global warming"
-
bruiser at 00:04 AM on 8 February 2014Australia’s hottest year was no freak event: humans caused it
@Barry
Hi Barry, not sure if you are still monitoring this article but ...
that while solar exposure is (very convincingly) the primary reason why 2013 was hot relative to 1990-2013, it is not the reason why 1990-2013 was hot relative to 1910-1939.
If you check bom sites that have temperature records that go back to the late 19th century, the hottest year is usually 1888 or early 20th century. One perticularly interesting location is the Cape Otway lighthouse where records go back to 1865. All the top 95 percentile are pre 1890.
-
Markoh at 23:45 PM on 7 February 20142013 was the second-hottest year on record without an El Niño
Esop, you must be the only person that I have heard of that is hoping and wanting a bad El Niño In 2015. You sure?
-
bjchip at 23:38 PM on 7 February 2014There's no tropospheric hot spot
Wouldn't the fact that the warming is in fact concentrated at the poles this past decade or so, and the low latitude ocean surface temps being dominated by a quiet ENSO so having not had a lot of warming lately (owing to the heat being carried into the deep ocean), make it reasonable that an effect that is ascribed to warming of the area SHOULD weaken when the area is not warming that much?
Just sayin... If one is looking for this in the tropical troposphere as something that is happening ALL the time one may be ignoring what is actually happening SOME of the time. -
mgardner at 22:59 PM on 7 February 20142013 was the second-hottest year on record without an El Niño
topal @18
You are making a really elementary mistake.
The MST (mean surface temp) is computed from all the different areas of the planet. So, ENSO causes the temp to rise or fall in one part of the planet, and that is reflected in the value of MST.
What you have to do is stop using the ambiguous verb "warm" and replace it with the correct language specific to the context:
Greenhouse gases "increase the energy" of the entire system.
ENSO "increases or decreases the temperature" measured as MST.
Hope that helps.
-
Klaus Flemløse at 22:02 PM on 7 February 2014Google Earth: how much has global warming raised temperatures near you?

Hi Tom Curtis
Here is the Google Map picture of the double counted Vestervig weather station. There is only one Vestervig weather station.
-
michael sweet at 21:54 PM on 7 February 20142013 was the second-hottest year on record without an El Niño
Topal,
Obviously the energy that is added comes from AGW. Before AGW, the energy would be radiated into space. The argument that El Nino creates enough energy to heat the globe does not stand up to any examination because there is no energy source available except AGW.
-
topal at 21:40 PM on 7 February 20142013 was the second-hottest year on record without an El Niño
@One Planet ...
"The main point made by the article was that even without the significant temporary bump of global average temperatures that occur due to a strong El Nino is acting, 2013 was a very warm year compared to others"
So we can conclude that an El Nino increases the temperature. But El Nino just displaces energy that was accumulated in the ocean, it doesn't generate any warming, so the energy added to the energy budget of the globe must come from another source. What is it?
You seem to assume that after an El Nino the global temperature returns to the precedent level before another El Nino occurs. This is not the case, since there is no opposite forcing that can remove energy from the globe, other than by natural processes, independant of ENSO. Hence energy can accumulate and higher temperature can persist when the next El Nino hits.
-
michael sweet at 21:40 PM on 7 February 20142013 was the second-hottest year on record without an El Niño
Topal,
Your claim that it was cold in the USA the last two months is simply false. According to the NOAA record table here, since January 1 there have been 121 monthly hot records set and 71 monthly cold records set. The monthly records are more extreme records than the daily records so they reflect more extreme records (there are more dailly cold records). This data set does not show 2 month data, but December was not as cold as January. How could there have been more record hot temperatures set if it was cold?
The yearly data show 258 all time hot records set and only 39 all time cold records. Obviously all time hot records cannot be set in the winter so we have to use the yearly data. There is no comparison between the recent mildly cold weather and the scorching hot summers we have suffered through recently. If we looked at the all time record hot 2012 data there were many more hot records.
What you really mean is: while the West Coast and Alaska suffered historic record high temperatures, the Midwest and East coasts had a winter that was typical fifty years ago. Since AGW made it so hot for the past 30 years, people who refuse to read the historic records think it is cold.
It was only cold in 1/2 of the CONUS. You have to discard the Alaska data and half the CONUS to claim it was cold. That reduces the affected area of the globe to about 0.8% of the globe that had a typical winter for 50 years ago.
-
Tom Curtis at 21:28 PM on 7 February 2014Google Earth: how much has global warming raised temperatures near you?
Klaus Flemlose @8, I have read some of your evidence and I am not convinced that BEST have in fact double counted. There is enough difference between similarly located stations, specifically with respect to latitude, longitude and elevation data, that they may represent differnt but closely located stations (of which there is an extensive history in climatology). Nor am I convinced that you are wrong. I do think, based on the data to hand, BEST should look very closely at the stations that you have identified to ensure that they are not double counting stations. Likewise, however, you should qualify your claims unless you get some more extensive data.
As a further, and very tentative point, from what I know of the BEST algorithm, double counting a few stations in a region with very many stations will not appreciably effect their temperature record. I would, however, like to see that intuition confirmed or denierd by somebody like Kevin C, who has a real grasp of the intricacies involved.
-
Klaus Flemløse at 20:43 PM on 7 February 2014Google Earth: how much has global warming raised temperatures near you?
- BEST and CRU are both using Google Map to document they results. That’s very positive.
- BEST has made a few double counting of Danish Weather stations and the data deviates with a small margin from the official Danish temperatures.
- The double counted weather stations are: Vestervig, Nordby, Hammer Odde Fyr and a Norwegian weather station Floro.
- These double counted stations may not have a significant impact. However, it is a flaw.
- CRU does not make any double counting of Danish weather stations and there data equals the official Danish temperatures as reported from DMI.
BEST writes about the raw data:
“The Berkeley Earth Surface Temperature Study has created a preliminary merged data set by combining 1.6 billion temperature reports from 16 preexisting data archives….. After eliminating duplicate records, the current archive contains over 39,000 unique stations”
The BEST double counting problem originates from reading 16 different archives with different metadata and data.
As I understand, BEST is not writing directly that there is a flaw in respect of double counting. One could read this as a warming flag.
For more details about the double counting of Danish weather station please look here:
http://www.climate-debate.com/forum/berkley-earth-temperature-analysis-possible-flaws--d11-e291.php
and here about BEST:
http://berkeleyearth.org/about-data-set
-
topal at 19:11 PM on 7 February 20142013 was the second-hottest year on record without an El Niño
I'm well aware that the USA surface is only a small part of the total surface, but it shows that a significant part of the world population is exposed to cold conditions despite global warming. On a considerably larger scale, there has not been a substantial increase in the subsurface temperatures of the Pacific Ocean and the North Atlantic to depths of 2000 meters over the past decade. Why is the warming of the global oceans (0-2000 meters) limited to the Indian and South Atlantic Oceans, when carbon dioxide is said to be a well-mixed greenhouse gas, meaning all ocean basins should be warming? The obvious answer is that a regionally limited force must be responsible for acting on the heat content. Let's try ENSO.
Moderator Response:(Rob P) All ocean basins are undergoing long-term warming - see the attached image from Balmaseda (2013) below. That there is an exchange of water masses between ocean basins, and large short-term variation in ocean circulation, may come as a surprise to you, but it shouldn't.
We will have a lot more on ocean warming and the basics of the wind-driven ocean circulation in the coming months - it's a key component in understanding why so much heat has been going into the ocean of late. There is also a great post by Dana Nuccitelli coming out in a couple of days on the latest research into to this recent unprecedented ocean warming.

-
Tom Curtis at 17:27 PM on 7 February 20142013 was the second-hottest year on record without an El Niño
FYI, I have expanded my on my comment @13 on my blog, including additional information and sources, for anybody who wants more data.
-
Tom Curtis at 16:19 PM on 7 February 20142013 was the second-hottest year on record without an El Niño
topal @3 reports Spencer's claim, but not its context. First, Spencer is not reporting official USHCN figures, but his own figures which use a larger Urban Heat Island (UHI) adjustment than do the official figures. Second, he is only reporting on two winter months. Indivicual months are always more variable than annual figures, which have some of the variations cancelled out be averaging. Consequently it is not surprising that a two month period should be unusually cold, even with the background of a warming trend. It makes such comparisons mere curiosities, having no bearing on the long term change in temperatures.
Spencer shows a graph of his adjusted ISH figures compared to the official USHCN figures:
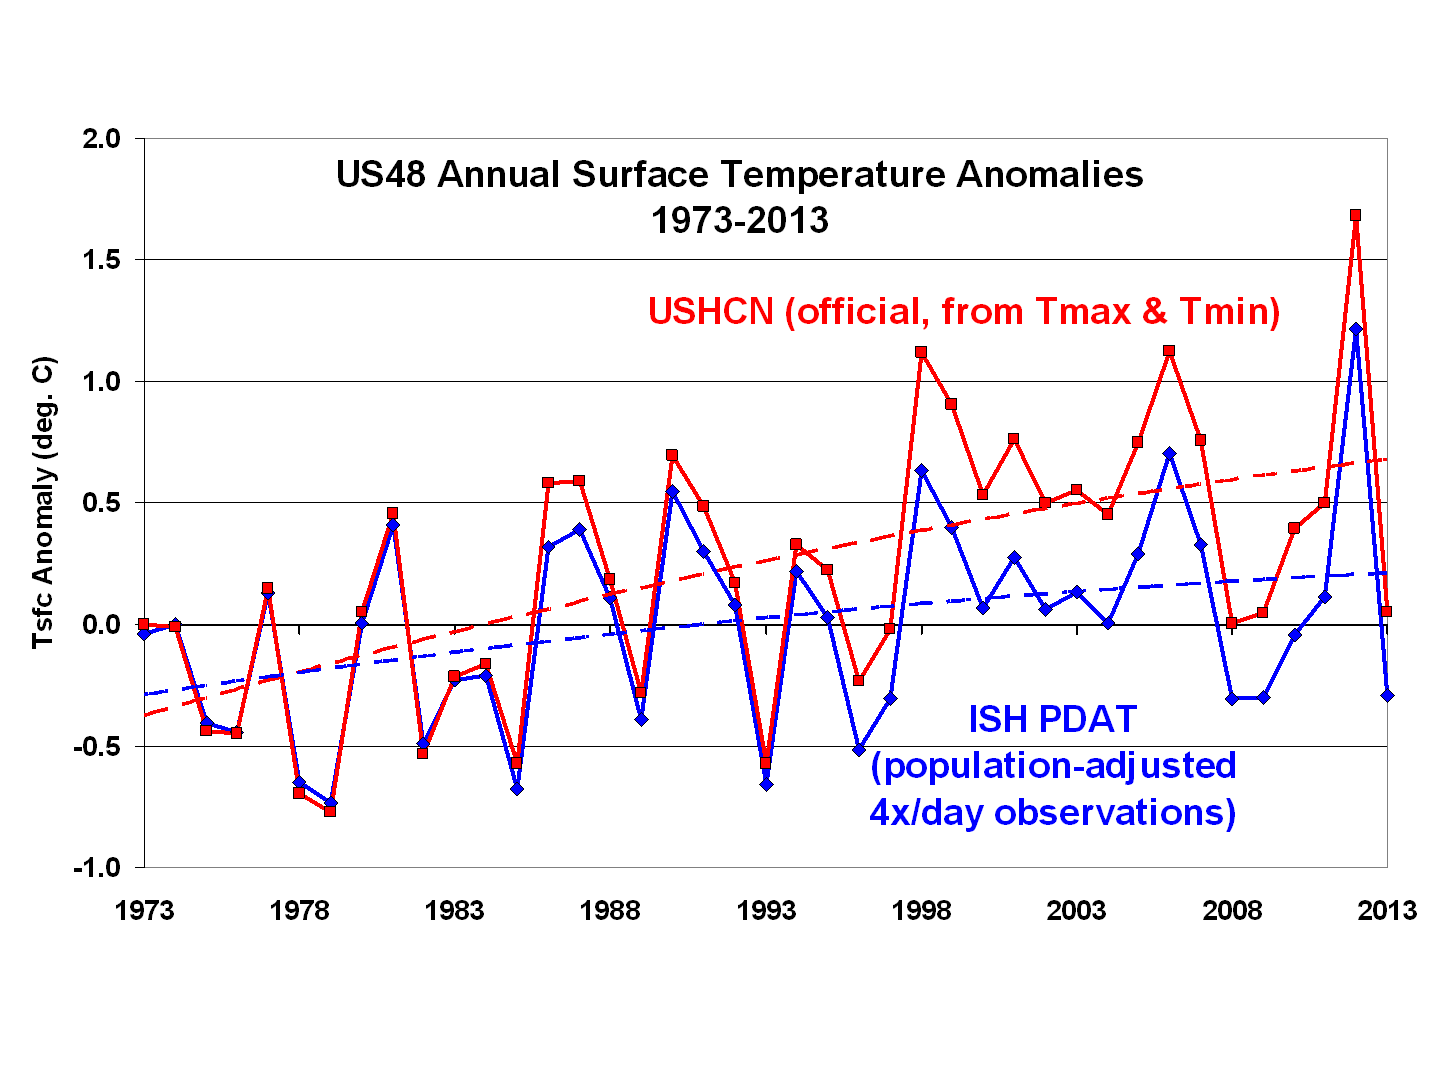
It can be seen clearly that Spencer's adjustment significantly cools later years relative to earlier years. Indeed, by 2013, it cools it by 0.35 C. As it turns out, that does not make a large difference in the ranking of 2013, which is the 13th coldest of 41 years in his adjusted figures, wheras it is tied for 15th and 16th coldest in the official USHCN data over that 41 years. Of course, the USHCN has many more years on record than just 41, and most of them much colder. Further, the early years of the 41 Spencer shows are obviously colder than the later years. Indeed, 8 of the first 15 years shown are colder than 2013. That brings to mind a recent comic by xkcd:

Which brings us to the December/January figures ;)
In those figures, Spencer shows that Dec/Jan of 2013/2014 have indeed been cold relative to the last 41 years, being the 6th coldest out of 41 years data. And it was indeed cold, at a chilly -0.55 C average for the CONUS. Of course, relatively warm relative to the -2.1 C in 78/79. And the years before that were colder still. What was commonplace has simply become note-wothy. XKCD has it right.
-
Markoh at 16:14 PM on 7 February 2014Corals are resilient to bleaching
Vonnegut, have you seen the company Sustainable Oceans Pty Ltd www.sustsainableoceans.com.au? They specialise in relocating coral. Currently its usually relocated because of development we don't need or want. But in future they hope to use their technology for relocating coral to more temperate waters if climate change causes further ocean temperature rises and threatens coral survival.
-
One Planet Only Forever at 15:51 PM on 7 February 20142013 was the second-hottest year on record without an El Niño
Topal @ 5,
Learning is all about becoming more fully informed. I hope you continue to strive to learn by following and asking questions on a 'helpful site' like this one.
The main point made by the article was that even without the significant temporary bump of global average temperatures that occur due to a strong El Nino is acting, 2013 was a very warm year compared to others. It was as warm as 1998 when one of the strongest El Nino events occurred.
-
DSL at 14:53 PM on 7 February 2014Earth's five mass extinction events
Vonnegut, why did you post the comment from Goreau if not to suggest something? Why did you think SkS readers would find it interesting? Why did you pick that particular quote from all of Goreau's comments in the thread? There comes a time when one no longer receives the benefit of the doubt, even from the most generous.
-
scaddenp at 12:17 PM on 7 February 20142013 was the second-hottest year on record without an El Niño
okay, 5% of the total land area.
-
Rob Honeycutt at 12:00 PM on 7 February 20142013 was the second-hottest year on record without an El Niño
Thanks, Tom!
-
Tom Curtis at 11:41 AM on 7 February 20142013 was the second-hottest year on record without an El Niño
Seeing there is apparent disagreement, I ran the figures and the CONtiguous United States (CONUS) is just 1.6% of the Earth's surface.
-
Rob Honeycutt at 10:45 AM on 7 February 20142013 was the second-hottest year on record without an El Niño
topal @5... The answer is, CO2 does not heat the oceans. Radiative processes heat the ocean. Incoming short wave radiation penetrates into the upper layers of the ocean and produces heating. The ocean is also heated through conduction and back radiation.
http://eesc.columbia.edu/courses/ees/climate/lectures/o_atm.html
Heat moves in and out of the oceans at different rates at different places. Oceans are moving bodies of water where the thermohaline circulation is actively transporting heat from the tropics to the poles.
The long and short is, it's a dynamic system. Thus, it's not going to warm evenly.
-
scaddenp at 10:42 AM on 7 February 20142013 was the second-hottest year on record without an El Niño
topal - as to cold winter in USA, note USA is 4% surface of earth. Picking on specific area is cherry-picking. As to why there are cold winters lately, perhaps start here.
Ocean heating (and global energy imbalance) is due to an enhanced greenhouse effect but the detail is complicated. A look at NOAA data for all basins would show all of them heating although you expect a very uneven distribution of temperature since there is very significant horizontal and vertical movements of water. (Look up thermohaline circulation). Which basin do you believe is not getting warmer?
-
Rob Honeycutt at 10:38 AM on 7 February 20142013 was the second-hottest year on record without an El Niño
topal @3... Yes, the lower 48 states (less that 3% of the Earth's surface) was the third coldest 3 month period, while Alaska and northern Canada were breaking all kinds of record warm temps.
Surely you can see this as the rather ridiculous cherry pick that it is.
-
topal at 10:04 AM on 7 February 20142013 was the second-hottest year on record without an El Niño
The question is: where does this excess heat in the ocean come from and how does it get in there? Does CO2 heat the oceans? If yes, how come not all of the oceans are getting warmer; is the influence of CO2 regional rather than global?
-
Synapsid at 09:58 AM on 7 February 20142013 was the second-hottest year on record without an El Niño
Two points:
It's called the Pacific Decadal Oscillation for a reason. To refer to it as a cycle is to call it something it Isn't. I've seen deniers criticized on this very point; we shouldn't be doing it either.
I can't help thinking that it would be useful to empasize the pattern we see in the temperature curve that deniers keep pointing at as indicating a cessation of warming--there was a big jump in temperatue associated with the 1998 El Nino (the strongest on record) and since then temperatures HAVEN'T GONE BACK DOWN. Shift the discussion away from Is there a heating trend or not; the record is too short to spot a trend anyway. Emphasize that temperatures have stayed up there.
-
topal at 09:52 AM on 7 February 20142013 was the second-hottest year on record without an El Niño
"The winter months of December 2013 and January 2014 averaged over the contiguous 48 United States were the 3rd coldest Dec/Jan in the last 30 years."
http://www.drroyspencer.com/2014/02/u-s-decjan-temperatures-3rd-coldest-in-30-years/
-
Vonnegut at 08:32 AM on 7 February 2014Ocean Acidification Is Fatal To Fish
Im suggesting nothing, I admire his enthusiasm and wish him all the luck in the world.
After countless mass extinctions and how many billion years of evolution and a few nukes thrown at them, You have to hand it to corals they are persistant creatures. I could cite but I think its common knowledge isnt it?
I found it interesting too that life in the colder waters will suffer first as the ph will be lowered sooner.
Moderator Response:[PS] Enough on coral here. To discuss profound effect of previous events on corals (eg the ocean acidification in the PETM) , please take the discussion to here.
-
DSL at 08:20 AM on 7 February 2014Ocean Acidification Is Fatal To Fish
And let's look at some of Goreau's other comments on that thread:
"What I take violent exception to is the claim that acidification is a major threat to tropical coral reefs NOW. It is not: corals will die of high temperaturesdecades to centuries before the dead reefs dissolve! Claiming this is a major problem is a deliberate straw man designed to avoid dealing with the immediate impacts of global warming. No wonder the US and Australian governments and their research agencies love acidification, and act like they invented it!"
"The fact is that if we solve the CO2 problem in time to save reefs from global warming, the acidification problem will automatically be taken care of. If we focus on acidification as the major threat to reefs, we guarantee their extinction."So, Vonnegut, are you suggesting that your quote is evidence that Goreau--a recognized expert--is saying that research on ocean acidification is garbage? Is that what your quote says to you? Or do you recognize that Goreau thinks that acidification is a problem, but it's a long-term problem that pales in comparison to the problem of rapidly warming oceans (via anthropogenic global warming)?
Moderator Response:[PS] please note that the article of this thread is not about corals but about more risk to fish and this discussion is close to offtopic.
-
Esop at 07:58 AM on 7 February 20142013 was the second-hottest year on record without an El Niño
Things are looking good for a late 2014 El Nino, and about time that is.
This means that 2015 could very likely set a new record in at least some of the datasets. UAH placed 2013 in 4th place, so I've got a feeling that unless there are adjustments done (often happens in record warm years for some reason) we will see a record in the UAH data for this coming year I can't even imagine the amount of backpeddlin' and spinning among the ''skeptics'' if UAH sets the record as the only dataset, as I have a hunch that GISS, etc won't beat the record until 2015. Interesting times ahead.
-
Vonnegut at 07:33 AM on 7 February 2014Ocean Acidification Is Fatal To Fish
This maybe my last post here but I thought you may like to see this link to a yahoogroups scientists study group.
groups.yahoo.com/neo/groups/coralreef-freeforall/conversations/topics/75
"What I find most appalling is that this nonsense about corals dying from acidification is published at all, because it indicates wholesale incompetence in the "peer" "review" system! One reason people are jumping on this red herring is to avoiddiscussing the fact that global warming has already killed most of the corals in the world, and will kill most of what is left in the next decade"
Thom Goreau
-
Tom Curtis at 07:25 AM on 7 February 2014We're coming out of the Little Ice Age
TD47 @63, the poster uses just three temperature poxies for the holocene. Two (Agassiz/Renland and GISP2, ie, Alley et al, 2000) are from the north Atlantic region. The former is a composite of four ice cores from the Agassize Ice Cap on Ellesmere Island (just west of the northern end of Greenland) and one ice core from Renland (on the south east coast of Greenland, more or less north of Iceland). They represent the regional signal, therefore, of just one region on Earth, and one of the most variable temperature wise. The author mis-cites the source of the Agassiz/Renland data as Vinther et al (2009), whereas it is in fact Vinther et al (2008).
The third core is the Vostock core from Petit et al (2001). That means all three cores are from polar regions, and exhibit polar amplification. They are therefore not representative of global temperatures. In addition, they represent just two regions, and consequently show the typically large regional fluctuations in temperature which cancel out when averaged across the globe. As a result, they significantly overstate temperature change when compared to global figures.
To compound this problem, there are two errors in the presentation of the proxies. First (unsurprisingly), the GISP2 data is plotted to end in 1905 (determined by pixel count). In fact it terminated in 1855, as discussed here. You should note that Richard Alley has confirmed that the that 1855 is the correct termination of the data. More troubling is the extended, uniform plateau at the end of the Vostok period. Checking the data, I find the last data point is for a gas age of 724 BP (=774 B2K), or 1226 AD. The extended plateau at the end of the data shown in the poster must be samples taken from the firn, ie, the upper region of the ice core where pressure has not yet sealed air gaps, allowing free exhange with the atmosphere. The consequence is that it represents an average temperature over the last few centuries rather than modern temperatures, and completely conceals all variation over that period. Coupling these facts with the fact that the final data point for the Agassiz/Renland composite core is 1960, and there are no proxy data points that actually show recent temperatures.
These flaws (regional, polar amplified proxies PLUS incorrect terminations of ice cores with no modern, regional comparisons) tend to reinforce Andy May's false claim that "...we have not seen unusual warming in the present warm period, relative to other warming events in the last 18,000 years...". In fact recent warming is unusual relative to the past 18,000 years, as is shown by Marcott et al (see second link by the moderator); and may be unprecedented in that period.
I also note that May has relied on the very obsolete, and obvsiously schematic temperature reconstruction by Scotese rather than an actual, modern reconstruction of temperatures over the Phanerozoic, such as this one by Dana Royer:
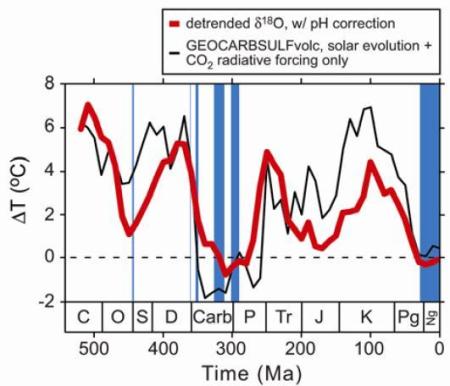
The preference May shows for obsolete data, inaccurately presented suggests the poster is of dubious value as an information source.
-
Alpinist at 05:40 AM on 7 February 20142013 was the second-hottest year on record without an El Niño
Excellent post. Thanks again to Kevin and Robert for their work. Tamino has a post on this as well.
-
william5331 at 05:37 AM on 7 February 2014New Video: Climate, Jetstream, Polar Vortex
The jet stream doesn't actually direct these storm systems around the globe. It is a useful metaphor just as the solar model of the atom was a useful metaphor as far as it went. It was an improvement over the plum pudding model but not as good as the modern model. The jet stream marks the border between The Polar Hadley cell and the Ferrel cell and the rising air at this location both creates the jet stream and pushes weather systems around the globe. Here is another equally flawed but possibly useful metaphor. The jet stream is like a top that as it slows down begins to wobble until as it continues to slow down it falls over. In this case the slowing down is due to the Arctic heating up. Previously, the air over the Arctic radiated heat, became heavy and sunk giving great force to the Polar Hadley cell. As the Arctic gets warmer, this heavy air is less heavy and the polar Hadley cell slows. Without this force, the progress of the Rosby waves slows and the waves get deeper (wobble). Eventually, especially in the fall when the land cools off quickly while the ocean still is giving off its huge accumulation of heat from the summer open ocean, the Polar Hadley cell should reverse as air rises over the Arctic. At some point in this progression, the northern most jet stream should disappear and we will have a two cell system in the northern hemisphere. By by wheat crops plus corn soya and so forth if it occurs before these crops have ripened. On average, each year, with the usual ups and downs from year to year, this will become more extreme until we lock in to the new climate regime and trees are growing again right up to the shores of the Arctic ocean.
-
desertphile at 01:22 AM on 7 February 2014Debunking climate myths: two contrasting case studies
I used the anomalous cat energy metaphone in one of my YouTube videos about 15 months ago, because a few people objected to the atomic bomb metaphore. Instead of sneezing, I used the caloric requirements of an average cat.
-
martin3818 at 01:13 AM on 7 February 2014Debunking climate myths: two contrasting case studies
How do you measure the success of your campaigns?
Besides surveys that are conducted by others, do you have any way of (automatically?) collecting data on the internet with respect to how often certain words, phrases or memes popup?
CB Dunkerson says that he(she?) never sees "skeptics pushing the 'no consensus' myth any more".
Is it possible to quantify such statements?
-
TD47 at 01:05 AM on 7 February 2014We're coming out of the Little Ice Age
There seems to be some very comprehensive collation of historical records here:
climate-and-human-civilization-over-the-last-18000-years
The large graphic image does expand to be very readable and informative. Hopefully the very interesting references will not be taken to be too off-topic (as they go back 18000 years).
Moderator Response:[TD] It is pretty much off topic, for the reason you gave. And not especially interesting or informative, because it uses only a very few very small geographic regions' temperature proxies with rather low resolutions. How about posting your comment in one of these instead:
-
Dikran Marsupial at 01:01 AM on 7 February 2014OA not OK part 20: SUMMARY 2/2
JH Feel free to prune back any of my posts you deem to be now unnecessary.
-
John Hartz at 00:45 AM on 7 February 2014OA not OK part 20: SUMMARY 2/2
All: Vonnegut's most recent comment was off-topic and was therefore deleted. It also bordered on being a moderation complaint which is also banned by the SkS Comments Policy.
-
John Hartz at 00:30 AM on 7 February 2014OA not OK part 20: SUMMARY 2/2
All: The three most recent comments by Vonnegut were nothing more than argumentative sloganeering and were therefore deleted.
-
DSL at 00:11 AM on 7 February 2014OA not OK part 20: SUMMARY 2/2
Vonnegut, I'd say you're close to being permanently bore-holed. Wading through your na-na-boo-boo rhetoric to try to address whatever point you're trying to make or understand whatever question you're trying to ask is difficult, even more so since when the point or question arrives, it's more than likely irrelevant or based on a simple misunderstanding of the physics/chemistry involved.
Your understanding of the science is made plain in your last comment: "Especially as co2 is supposed to be adding to the warming of the planet by its excess."
Perhaps you'd better start at a more basic level and demonstrate why you doubt that CO2 absorbs/emits radiation at various pressure-broadened bands in the thermal infrared range, the range within which the sun-warmed Earth emits.
You're attempting to kill a tiger by pulling out (or attempting to) the hairs in its tail, one by one, and doing it with blinkers on.
-
CBDunkerson at 23:42 PM on 6 February 2014Debunking climate myths: two contrasting case studies
It will be interesting to see if there are measurable shifts in public attitudes from these efforts.
I think the consensus project has been very successful... I never see 'skeptics' pushing the 'no consensus' myth any more. The more hard core deniers still dispute the 97% figure when it comes up, but even then it seems clear that most people can see they are grasping at imaginary straws.
However, the 'no warming for time period too short to show statistical significance' myth still seems to be the 'go to' disinformation for the vast majority of skeptics... maybe temporarily supplanted as #1 by, 'Look! Snow! Where is your global warming now, huh?', but still cited on a routine basis. The heat widget is a good counter to this, but I don't think the message has gotten out to the general public yet.
-
Dikran Marsupial at 23:20 PM on 6 February 2014OA not OK part 20: SUMMARY 2/2
vonnegut wrote "Especially as co2 is such a bad guy."
Please keep the discussion factual and avoid this sort of rhetorical quip. All you will achieve is irritating people who would otherwise be only too keen to have a civil discussion of the science with you. Please give it a rest, we've all seen it before, and it does you no credit whatsoever.
-
michael sweet at 21:02 PM on 6 February 2014Why rainbows and oil slicks help to show the greenhouse effect
Joeygoze,
It is not clear what you are trying to argue. You seem to be saying that we need to compare only those who you consider to be mainstream deniers to mainstream climate scientists. You claim that US Senators, popular denier blogs and the Prime Minister of Australia do not represent denier opinion.
You have misquoted Al Gore, found an expreme post from a low level scientist, and an instance where a non scientist made stronger claims than are justified scientificly. You have insisted on claiming Gore said that the ice would melt in 2013 when your quote does not support that claim, so you provide an instance as bad as Kerry. Claiming a blog post by Paul Beckwith is as important as public statements from Tony Abbott is absurd.
Deniers say that the greenhouse effect does not exist all the time. It is a waste of time to debate with someone who claims that is not a common argument when several examples have been provided.
-
scaddenp at 17:46 PM on 6 February 2014OA not OK part 20: SUMMARY 2/2
The interactive is correct as far as it goes - it is only concerned with the chemical processes for shell formation. It doesnt go on to show what happens next to seawater chemistry as result. When I first looked at this, I thought shellfish farming gave a way to doing CO2 sequestration, but sadly no.
2 HCO3- < --> CO3-- + CO2 + H2O
gets pushed to the right.
-
chriskoz at 17:45 PM on 6 February 2014Debunking climate myths: two contrasting case studies
In the original article introducing the widget on 25 November 2013, the HB count (in the snapshot down the page, not the embedded object on the top) was 2,037M.
After just a little over 2 mounts elapsed (a very short timespan, at least for me), the count went up to over 2,063M. An increase by 26HB (1.3%) in just 2 months!
-
jja at 15:17 PM on 6 February 2014Warming oceans consistent with rising sea level & global energy imbalance
between 1978 and 2008
R^2 is 0.939
Standard Error is 1.556E+22
-
chriskoz at 13:03 PM on 6 February 2014Why rainbows and oil slicks help to show the greenhouse effect
joeygoze@27,@29
You haven't answered my questions @24.
Instead, you're now making incorrect claims that this article equates those who deny FGE with those who deny that humans are responsible for AGW (it does not, debunked by grindupBaker@30).
Further, you're now redefining your objections to this article because it "does not represent mainstream thinking in the science community". I disagree. The purpose of his blog is not to follow "mainstream thinking in the science community" (as you would prefer), but to "Explaining climate change science & rebutting global warming misinformation" as you can read in the home page.
So I renew my question: what's the purpose of your objection? Reasonable and responsible people, do explain all basic aspects of life to their descendants (e.g. children), despite the fact that those basics are not "mainstream thinking in the science community". By analogy, this blog explains the basics of climate science to the bloggers who have not learnt them or have learnet them wrong from denialosphere. Why are you denying the very reason for SkS existence? What is the ethical reason behind that denial of yours?
Prev 791 792 793 794 795 796 797 798 799 800 801 802 803 804 805 806 Next


