


 Arguments


Recent Comments
Prev 840 841 842 843 844 845 846 847 848 849 850 851 852 853 854 855 Next
Comments 42351 to 42400:
-
0^0 at 20:34 PM on 5 September 2013The 97% consensus on human-caused global warming is a robust result
It looks like the Legates paper is part of an ongoing "discussion" on the pages of that journal....There has been a recent article by Bedford & Cook
http://link.springer.com/article/10.1007%2Fs11191-013-9608-3
and I trust the "discussion" continues in this journal -- and perhaps elsewhere as well http://www.earth-syst-dynam-discuss.net/4/451/2013/esdd-4-451-2013.html
-
michael sweet at 19:59 PM on 5 September 2013The 97% consensus on human-caused global warming is a robust result
The article OO referred to is in an education journal, not a climate or science journal. I ma a teacher and read those journals occasionally. The standard to get a paper in is very low. Does anyone have expewrience with this particular journal?
-
Tom Curtis at 17:01 PM on 5 September 2013The 97% consensus on human-caused global warming is a robust result
0^0 @1, I ran some calculations on the detailed results as released on this site. They show that to obtain a 0.3% "consensus rating", Legates et al had to only count papers rated 1, and then also exclude any papers categorized as "impacts" and "mitigation".
The first step not only excludes every paper that endorses the consensus without explicitly quantifying the contribution of humans, or only implicitly endorses the consensus - it actually counts them and neutral (rating 4) papers as disendorsing the consensus. That follows because they are not rejecting the 32.6% of all abstracts rated as endorsing the consensus in Cook et al, but the 97.1% "among abstracts with AGW position". So, either it is a deliberate strawman by quantifying something they know to belong to a different category (% among all abstracts) or they are tacitly asserting that all abstracts have a position on AGW, and that overwhelmingly that position is a refusal to endorse AGW. Curiously they are willing to assert this without any sign that they themselves have rated the abstracts. They are insisting that their a priori rating is better than Cook et al's empirical rating.
Excluding "impacts" and "mitigation" papers is even more dubious. First, it confuses "endorses" with "is evidence of". A paper about marigolds could "endorse" AGW by simply noting that they think AGW is true. That is not evidence of AGW, and nobody pretends otherwise. It merely indicates the opinion of the authors about AGW (ie, they think it is true). And, of course, Cook et al is not trying to measure the level of evidence, but the distribution of opinions. In fact, it is one of the main arguments of the pseudo-skeptics that a consensus is not evidence, but here they ignore that distinction and pretend that Cook et al by trying to measure consensus is actually trying to measure evidence, the only basis on which excluding "mitigation" papers would be relevant.
It is worse than that, however, for a large portion of "impacts" papers are about the climatological impacts of increasing CO2 levels. They make findings about such things as the likely temperature increase from a doubling of CO2, or from historical and projected CO2 emissions. These are exactly the sort of papers that do provide evidence about whether or not anthropogenic emissions have caused >50% of recent temperature increases. Yet Legates et al want to exclude them as irrelevant (while counting them among "abstracts with [an] AGW position".
The contortion of reasoning involved in their claim is, as you can see, beyond belief.
-
0^0 at 16:18 PM on 5 September 2013The 97% consensus on human-caused global warming is a robust result
Oops.. Sorry about the text snippet in the end due to poor proof reading.. Yes, that paper is now widely celebrated in WUWT and other places...
-
0^0 at 16:15 PM on 5 September 2013The 97% consensus on human-caused global warming is a robust result
Appears there is a new paper http://link.springer.com/article/10.1007/s11191-013-9647-9 by the team David R. Legates, Willie Soon, William M. Briggs and Christopher Monckton of Brenchley "Climate Consensus and ‘Misinformation’: A Rejoinder to Agnotology, Scientific Consensus, and the Teaching and Learning of Climate Change" claiming that the consensus is at 0.3% level.
Unfortunately that is hidden behind paywalls so I have not been able to read the details. However, it seems like they must be using some sematic "tricks" to reach their conclusions as self rating of the authors should be proof enough to clarify any doubts.
celebrated in WUWT etc challenging the consensus paper
-
Albatross at 14:38 PM on 5 September 2013Why I Resigned from the Editorial Board of Climate over its Akasofu Publication
Dr. Brierley,
Thank you for sharing. It is a pity that it had to come to this, but you made a principled and very courageous decision. In my opinion, you also made the correct decision.
All of the best.
Albatross
-
DSL at 12:39 PM on 5 September 2013It's the sun
Cruzn, that's a really wierd argument. You're implying that solar is responsible for the fifty year trend, yet the 11-year cycle is not well-represented in the GMST trend. For a forcing to be that dominant, one would expect the trend of that forcing to be writ large in the long-term trend. It's not. The long-term trend is rather steady in its advance. Surely you're not arguing from the long-term solar trend--clearly flat or falling since 1960. We just had the deepest 11-year cycle minimum in the instrumental period (trough bottomed out through 2009-2010). That trough spent a year below the minima of previous cycles. The 12-month period between mid 2009 and mid 2010 was the warmest 12-month period in the instrumental record.
If you were truly basing your theory on solid evidence, you'd have absolutely no need or motivation for the bitter tone and reluctance to share your math. Your past history smells like troll. Is that the extent of your contribution?
-
davidnewell at 12:27 PM on 5 September 2013The Pacific Ocean fills in another piece of the global warming puzzle, and puzzles Curry
One Planet Only Forever @ 14.
Thank you for that summary explanation. Very thoughtful.
-
cruzn246 at 11:08 AM on 5 September 2013Models are unreliable
(-snip-).
Moderator Response:[DB] Please comport yourself with this site's Comments Policy. In it you will note under the Sloganeering section that if you wish to differ with established science, you will need to bring reputable evidence to support that chosen differing. Mere assertion, as has been your wont, fails to rise to that burden of proof.
Sloganeering snipped.
-
Roger D at 10:51 AM on 5 September 2013Models are unreliable
cruzn246:
"Tell me why it has essentially stopped warming just when the solar torch let up?"
See the SkS climate myth #2 "it's the sun". The first graph does not support your statement above. Also, what do you mean, specifically in @628 when you say "it has stopped warming". Specifically what do you mean when you say "it".
Finally, I think it is a strech to imply that the modelers and those that utilize them to aid in understanding climate change "think they have it all figured out". However, you sound like that. And in my opinon have much less of a leg to stand on in your assertions.
Moderator Response:[DB] Please note that cruzn246 has an extensive history of sloganeering and trolling in this venue.
-
Rob Honeycutt at 10:44 AM on 5 September 2013Models are unreliable
cruzn... Please look again at the chart I linked to before. It clearly shows that there is a low LOSU (level of scientific understanding) related to solar. But that doesn't mean it could be absolutely anything. Still the likely range solar forcing is a fraction of GHG forcing, which has a high LOSU.
You do realize, of course, we have satellites which are measuring solar variation, and you were even quoting radiative forcing figures, data that comes from those satellites.
-
Rob Honeycutt at 10:15 AM on 5 September 2013It's the sun
cruzn246... Yes, you are clearly wrong on this one. My suggestion would be for you to read all three levels of the scientific response to the myth you're presenting. The relative forcing you're presenting is small compared to GHG forcing.
Moderator Response:[DB] Please note that cruzn246 has an extensive history of sloganeering and trolling in this venue.
-
Rob Honeycutt at 10:05 AM on 5 September 2013Models are unreliable
The image from the link above:

-
Rob Honeycutt at 10:03 AM on 5 September 2013Models are unreliable
cruzn246... What you say might be interesting if it were based on any facts.
Do you think for even two seconds that the many thousands of scientists who work on climate issues have not considered the relative forcing of solar vs GHG's?
-
Tom Curtis at 09:39 AM on 5 September 2013The Pacific Ocean fills in another piece of the global warming puzzle, and puzzles Curry
MA Rodger @18, the biggest change in the early twentieth century would have been from coal fired to oil fired boilers in shipping.
-
cruzn246 at 09:13 AM on 5 September 2013Models are unreliable
The thing about the models that is screwing it up now is the divergence with solar and CO2, which had always been closely linked. No the solar is backing off, and the mistaken notion that a high solar level isn't enough (it is), an ever incresing one being needed (false), is showing the pundits they hooked their cart to the wrong horse. The solar has been and still is the driver. All those folks who put CO2 in charge are just waiting for the trend to go up again. Good luck folks. When the solar activity returns to warming levels it will go up again. Til then you are out of luck. The math of the models is flawed and the flaw is showing. It did great when solar and CO2 were in lockstep (the past), but picked the wrong driver and is now showing the error big time.
-
cruzn246 at 08:08 AM on 5 September 2013It's the sun
Ho hum. Call me wrong. I really thought the ocean cycles would have to flip to get the cooling thing going, but it seems the solar backing down is doing it all on it's own. I said it once and I'll say it again. When the solar output drops below 1365.7, and it has, the warming stops. If it drops into area below 1365 get ready for major cooling. It looks to be going there.
-
StBarnabas at 07:37 AM on 5 September 2013Why I Resigned from the Editorial Board of Climate over its Akasofu Publication
Chris
I am a professor in Physics and Electrical Engineering in Northumbria and have been heavily involved in MSc programmes (for a time programme director postgraduate) and your dissertation/project criteria are similar to ours and indeed are I suspect very similar to most good universities in the UK and Ireland.
We have an 80%+ category (the externs complain about us not using a full range of marks) for work of sufficient quality it is publishable in a reputable international journal and indeed provide the option for the best students to write a paper rather than a dissertation.
I am an astroparticle physicist by training and know how difficult real science is. I have great regard for my climate change colleagues and am bewildered by why scientists trained in other fields think they know the subject and can possibly use reputation to get amaturish work published.
I have not published in the area of climate science but was periferally involved with the Sloan and Wolfendale rebuttal of "causal link between cosmic rays and cloud cover" (T Sloan and A W Wolfendale 2008 Environ. Res. Lett. 3 024001). Shame Sir Arnold Wolfendale, (former astronomer royal) is now in his 80's as he is a grat science commnicaor and a passionate believer in truth, but is slowing sown a lot. Anyway I digreess.
Congratulations on a principled decision. Like most working academics I regularly peer review papers in my area and with the upcomin REF have soft pressure put on me to become a member of an editorial board (though these days if it not in Q1 of Thomson Reuter's Web of knowledge not considered best quality)
You have made the right decision
Sean
-
tcflood at 07:07 AM on 5 September 2013Greenhouse Effect Basics: Warm Earth, Cold Atmosphere
MThompson at 93;
The rate of emission of IR photons from the excited bending mode of CO2* in the atmosphere is a property of the bulk steady-state concentration of that state regardless of the lifetime of the state for any single molecule. By my calculation using the Boltzmann equation, at 80 F about 4% of the CO2 molecules are excited in the bending mode. The rate of spontaneous emission from the sample depends on that number.
-
william5331 at 06:42 AM on 5 September 20132013 SkS Weekly News Roundup #36A
Convincing the American people to go with a carbon tax (first article) would be painfully easy. Convincing the antidiluvian senate and congress would be another thing all together. Simply put in the second half of Hansen's solution and give the dividend. The side benefits (besides reducing carbon emissions) would be great. So many American families are on the bones of their backsides. They would immedeately put every cent they received back into the economy just to put food on the table. Taxes to the government at all levels. What is so hard to undersand about this.
-
MA Rodger at 05:38 AM on 5 September 2013The Pacific Ocean fills in another piece of the global warming puzzle, and puzzles Curry
K.a.r.S.t.e.N@17.
My ten peneth down the wishing well on early 20th century forcings is to wonder how quickly electric power was adopted during those decades. We have good data for how much coal was burnt but I have been unable to find information on the proportion burnt in power stations as opposed to factory boilers and domestic grates. Any significant drop in coal use in boilers and grates would have made a big difference to pollution even if coal use in power stations was increasing and resulting in greater total coal use - my hypothesis being that power stations burn more consistently and more cleanly. Unfortunately quantitive data on the rise of the power station has so far eluded me.
-
Yvan Dutil at 05:07 AM on 5 September 2013Why I Resigned from the Editorial Board of Climate over its Akasofu Publication
Well I have published in Sustainability (a MDPI journal). The reviewer were good. But I did trust the editorial staff because I knew many of them by reputation.
The problem those days is that some «open access» journals tend to accept anything. But, MDPI is far from beeign the worst case.
-
K.a.r.S.t.e.N at 04:34 AM on 5 September 2013Study offers clues on 20th century global warming wobbles
Tom, there was an interesting paper published earlier this year by Daniel Murphy, argueing that the recent redistribution of anthropogenic aerosols towards the equator didn't change the overall forcing picture much (under the assumption that the aerosol loading and composition remains constant). Locally things do change, but globally there is surprisingly little change. Seems to be consistent with another paper just published by Xie et al., showing that spatial patterns of GHG and aerosol response are similar, despite the heterogeneous aerosol forcing pattern.
While it might be a valid assumption for most purposes, that doesn't mean that it is safe to assume that their global effect will be the same regardless of where emitted. I absolutely agree with you here. Aerosols in formerly pristine regions have a considerable stronger effect, and indeed, the NH forcing should be very sensitive to the North Atlantic (and perhaps even ENSO), while this might not be such serious an issue elsewhere.
Re my first comment (#2), it might be worth adding Fig. 15 from Shindell et al. 2013, showing how strong an effect the indirect aerosol effect (mainly cloud albedo effect) has over the oceans (at least in the model world ;-)):

-
K.a.r.S.t.e.N at 04:10 AM on 5 September 2013The Pacific Ocean fills in another piece of the global warming puzzle, and puzzles Curry
Kevin, for the "forcing function" in my 2-box EBM I used a quick land response (1 year) and a slow ocean response (60 years) ONLY for volcanic eruptions. The latter combines the fast and the slow ocean response in that the exponential decay is faster. Essentially, I merely tried to fit the Stenchikov et al. 2009 (S09) model results as good as I possibly can. You may check what I exactly did: Pinatubo S09 vs Pinatubo EBM, and Tambora S09 vs Tambora EBM. That would be my test! It's hard to come by more of these data. So this would certainly be the starting point if one were to dig deeper.
Apart from volcanes, solar variability and aerosol forcing is unlikely to be "delayed", while I accommodated the WMGHG response using OHC data (which isn't perfectly accurate, but only an issue in the last 50 years or so). It does reproduce the principal climate variability in a quite convincing fashion, which - after all - was the whole purpose of this exercise for me. However, it is by no means robust with regard to the ultimate climate sensitivity (though mainstream numbers do the job quite well), since I was trying to get the NH response right (due to the limited number of reliable global paleo-reconstructions).
You are right, the slow response won't have a measurable effect on TCR. It merely controls ECS in the long run (which is one reason why I consider all these supposedly observation-based ECS estimates useless). So yes, TCR might be lower. BUT, it is only lower because part of the initially forced temperature response is now treated as stochastic internal variability (mainly PDO). What is commonly believed to be purely chaotic is in fact partly driven by former external forcing. What is changing as a results of this, is the ratio between TCR and ECS. TCR might be lower, but ECS remains entirely unaffected. So I am not sure there is much that can be done here. For example, there is simply no way to reproduce the strong SST increase post-Novarupta (1912) until 1940. In the simplest case, it is just the immediate recovery from Krakatoa, Santa Maria and Novarupta, which went on uninterrupted with its climax during the strong 1942 El Nino (supported by early GHG forcing).
Another potential "solution" to the volcano-puzzle: As we are lacking precise knowledge of the strength of some volcanic eruptions, we might have to revise the volcanic forcing estimates (despite some recent more sophisticated attempts to fill the gaps). Novarupta is one such example, an eruption which might have led to much more intense NH cooling. At least, it causes the strongest bias in the CMIP5-GISS comparison (corrected for ENSO following FR11).
Re solar response: I'm not sure in how far this has to do with a delayed volcanic response? I might have missed sth here. The solar UV response has implications for the (north) polar region in the NH winter. Via considerably changing solar fluxes in the UV range, the coupling between polar stratosphere and troposphere is "facilitated" under low solar activity conditions (due to changing stratospheric heating rates IIRC) which in turn increases the chance for polar vortex splitting and subsequent cooling in Eurasia. The net effect is a slightly amplified cooling. We saw many of these events in recent years, with 2012 being a particularly drastic example. As you surely know, it might as well be a response to the shrinking Arctic sea ice. Hard to know, but there is some evidence for the solar link. Models with a so-called high-top stratosphere reproduce the observed patterns nicely (Adam Scaife and Sarah Ineson have good publications on that issue).
By the way, when I am using the Potsdam forcing in your toy model, I noticed that the volcanic temperature response seems to have an offset. Don't know whether this is just a graphic issue. If not, it may introduce an unintended error when it comes to the computation of the correlation coefficient.
-
rockytom at 03:53 AM on 5 September 2013The Pacific Ocean fills in another piece of the global warming puzzle, and puzzles Curry
There is still Earth's basic energy imbalance of +0.58 W/m2calculated by Hansen and his teams during the last decade. Warming will continue apace no matter where it goes (deep ocean, atmosphere, etc.) until the system reaches equilibrium again, if ever. If I'm missing something, please let me know.
-
VictorVenema at 02:31 AM on 5 September 2013Why I Resigned from the Editorial Board of Climate over its Akasofu Publication
(Can a moderator remove the first version of my comment with all the link errors)
I was afraid this would happen, but am surprised it happened that fast.
Some time ago, I came across the article A Multidisciplinary, Science-Based Approach to the Economics of Climate Change by Alan Carlin.
This paper should never have been published in a peer-reviewed journal. It is a collection of weird figures taken off of climate ostrich blogs.
Furthermore Mr. Carlin (a well-known climate "sceptic") was guest editor of the special issue in which his paper was published in record time. Thus I asked the published IJERPH how they handle such cases. How they make sure that the reviews are independent and a reviewer can be sure that his anonymity is kept. And I asked who selected Alan Carlin to be guest editor?
I got no real answer from the managing editor Dr. Ophelia Han, just empty words about their great peer-review. I found this very unsatisfactory and made a note never to publish with MDPI.
The publisher has more issues.
The second scandal is another erroneous climate paper in the journal Remote Sensing by Roy Spencer and Danny Braswell, which led to resignation of the editor.
Furthermore, A paper in the journal Life solving the puzzle of the origin and evolution of cellular life in the universe led several editors to resign, but not to its retraction. That such a paper can be published is unbelievable. I do encourage people to read this article, it is great fun.
I can only conclude that I will never risk my reputation by publishing in a MDPI journal and that I will advice my colleagues not to publish anything in the new journal Climate.
-
Kevin C at 20:41 PM on 4 September 2013The Pacific Ocean fills in another piece of the global warming puzzle, and puzzles Curry
K.a.r.S.t.e.N: That is very interesting indeed, thanks for the explanation.
One of my biggest problems with the short volcanic response is that it demands a TCR which is much lower than the rest of the temperature record requires. However, a very slow response would address that in part (although some of the response would then fall out of the TCR window and contribute only to ECS). But a more complex interaction between volcanoes and ENSO (on which there is certainly plenty of literature) or even ENSO and PDO (on which there is some) would change the picture a lot.
Can you suggest any tests we could do to look at this? Allowing a separate volcanic response still seems worth a try, but I wonder if there is anything else.
Also, do you have any views on the solar response, which has a strong interaction with the delayed volcanic response on the satellite era? My other correspondent has noted recent work on UV which may affect the scale of the solar response.
However if we allow all the terms to vary separately I am still convinced that the problem suffers from overfitting, so I'm looking for any constraints I can use.
-
One Planet Only Forever at 13:27 PM on 4 September 2013The Pacific Ocean fills in another piece of the global warming puzzle, and puzzles Curry
Replying to davidnewell @ 12.
The best explanation I have developed so far for the "significant lack of concern about potential future consequences" is that some people allow their personal desire for more profit, pleasure, comfort or convenience to trump concerns about what might happen to other people in the future. The real problem in this case is that the ones benefiting most aren’t expecting to be the ones suffering the consequences.
As tragic as that sounds it seems to be the best explanation for the ease with which the delayers have been able to maintain support for their efforts to "do nothing that would spare the future from negative consequences".
There are even people arguing things as absurd as "the total lost benefit of today's most fortunate reducing their creation of future problems is greater than the problem being created". To add insult to the injury of that absurd evaluation they over-state the lost benefit and under-state the future costs by only caring about the costs to the most fortunate and then reduce those costs because they would happen in the future.
The creation of a sustainable better future for all life on our one and only planet should be the first requirement of the acceptability of any action. That, however, is not the motivation in societies that are immersed in the mass-consumption market with its pursuers of maximum short-term benefit.
That may not ease your frustration, but it may explain why so many people seem unwilling to actually understand the details and significance of this issue (the inconvenient truths). More details, presented effectively, make it more difficult for them to believe what they would prefer to believe. However, it is very challenging to "make someone believe something that requires them to give up their potential benefit just to help someone else”. It is difficult to make the case when “responsibility to create a better future for all” is not part of our culture. We can’t even convince people to focus exclusively on driving when they are driving even though they are putting themselves personally at risk when they allow themselves to be distracted from that important responsibility.
-
Tom Curtis at 11:16 AM on 4 September 2013Study offers clues on 20th century global warming wobbles
For what it is worth, I think the location at which the aerosols are emitted may matter a lot. We know, for example, that the Earth is particularly sensitive to fluctuations in temperature in the Eastern Tropical Pacific. That being the case, if the aerosol emissions had come from the Galapagos Island, it is likely that they would have had a stronger effect than equivalent emissions in Australia. As it happens, the Northern Hemisphere in particular, is also sensitive to events in the North Atlantic. That suggests that aerosol emissions in the Eastern US, and Europe may have a stronger effect than emissions in India or China. Given the highly regional nature of the effect of aerosol emissions, it is at least unsafe to assume that their global effect will be the same regardless of where emited.
Of course, I am aware of no papers along this line, so this is just rampant speculation.
-
K.a.r.S.t.e.N at 10:52 AM on 4 September 2013Study offers clues on 20th century global warming wobbles
@CBDunkerson:
The ocean is responsible for that what is happening right now. Anthropogenic aerosols play a minor role in the last 10-30 years. No contradiction here. Some volcanic (stratospheric) background aerosol played a role in the last decade, but that's about it (apart from solar variability of course).
With respect to the mid-century hiatus, I am not aware of any paper which managed to minimize the aerosol impact in a convincing fashion. The paper in question here is certainly argueing for bit lower an effect, but the problem what I see is that models do produce stronger aerosol effects even in the absence of a strongly reduced DTR. Models with better aerosol representation get closer to the observed DTR, but still, the global temperature response is stronger than suggested in this paper. Given the potential limitations of their study, this isn't enough to reject the current wisdom.
Cloud lifetime effects are believed to be small indeed. However, the cloud albedo effect is fairly significant and commonly believed to be stronger than the direct effect. While it also reduces the incoming solar radiation, I am not sure whether the DTR effect would be the same. Zhou et al. 2010 elaborated on that. Apart from that, a huge amount of aerosol papers kept coming in, without indications of a strongly reduced aerosol effect. The most compelling effort was published by Wilcox et al. 2013 earlier this year. Ellie Highwood has a neat blog post about it: elliehighwood.wordpress.com
Highly recommended read ;). Otherwise, please keep that image in mind:

The sulfate aerosol forcing might have triggered some ocean response which acted to amplify the initial forcing (e.g. enhanced interhemispheric heat transport) - there is indeed some evidence for that - but the main culprit can be seen above ... as far as my opinion is concerned ;)
-
K.a.r.S.t.e.N at 10:17 AM on 4 September 2013The Pacific Ocean fills in another piece of the global warming puzzle, and puzzles Curry
Kevin, let's see whether I get the message across to you.
I've already realized that all forcings have the same response function. Could indeed be a problem, particularly for anthropogenic aerosols as they've mainly been counterbalancing forcing to the GHG forcing. Apart from a short period in the 1960s when they might have been strong enough to produce a net negative forcing, they have ever been "working" in a positive forcing regime which is suggestive of an immediate effect. In my opinion, they should therefore always be treated as an instantaneous forcing.
However, I do believe that the default response time for volcanic eruptions (30 years) is also not appropriate. I set the response time of the 2nd time constant (tau_2) to 5 years and are still obtaining reasonable results. In fact, if I only test the correlation for the period past 1950 (when the longer term effects are increasingly irrelevant), the correlation coefficient peaks at 5 years response time and again at very long response times > 40 years. For me, this is indicative of two "real" response time scales involved. Well, three in fact: The very quick land surface response (1 year), the fast ocean response (3-5 years) and the very slow ocean response (>100 years).
I think I raised this issue when you took down the FR11 video. I argued, that I don't see any problem with the video and the FR11 method as it fully takes the land and the fast ocean response into account. My point is, that the remaining imbalance does not have a measurable effect on the surface temperature anymore (see Stenchikov et al. 2009). Rather, the forcing signal it is stored in the deep ocean for a very long time (see Gleckler et al. 2006).
And now comes the trick: This "lost" signal reemerges to the surface in the form of stronger La Nina events in the decades after the eruption. You may think of ENSO as a mediator for the remaining energy imbalance of the system. My suspicion is, that volcanic eruptions result in a preponderance of La Nina like conditions once the post-volcanic El Nino phase fades away (there is more than anecdotal evidence that strong eruptions tend to trigger an El Nino event). Alternatively, the magnitude of the La Nina and/or El Nino events may change according to the remaining energy imbalance in the system (i.e. in deeper ocean layers). The preponderance of La Nina like conditions which we are encountering right now might be some sign of a delayed response to the Pinatubo eruption. With respect to the timing of such system restoration processes, I think there is no rule whatsoever. It remains a stochastic problem. However, in the long-term, the system does equilibrate at some stage (apart from the fact that "true" equilibrium might never be reached due to the never ceasing volcanic activity).
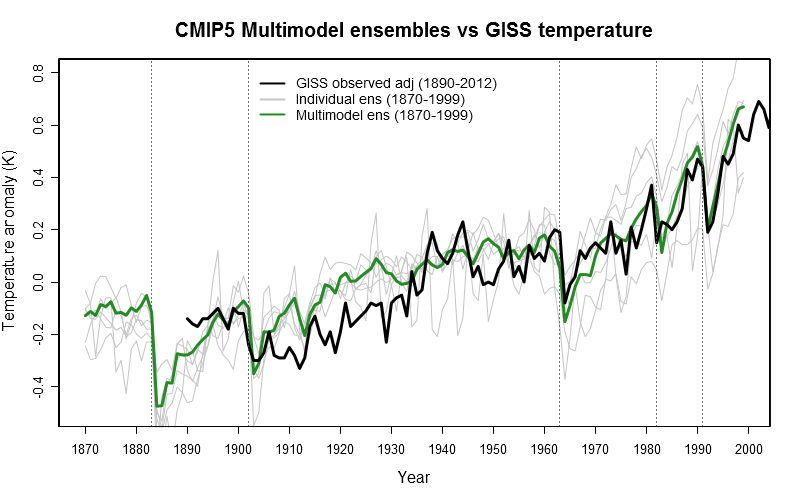
Why do I think that this is the case? Because we can reproduce the NH temperature of the past 500 years by means of all known external forcing factors as previously shown:
www.skepticalscience.comNote that the slow volcanic ocean response in this example is mimicking the ENSO response such that it lowers the surface temperature for almost a century (following an e-folding restoration curve). In the "real world" however, the remaining surface temperature signal after 5 years is so small, you would never be able to pull it out of any observational data. Rather, it is camouflaged as ENSO ;). No contradiction here! That's why FR11 is still working. Whether their identified ENSO-related trend is purely stochastic or whether it contains a volcanic footprint ... not sure we will ever know for sure. However, in my opinion, it doesn't change or undermine their conclusions.
Sounds weird? Well, that's the way I think the whole system works. It seems to be an elegant way to combine the different external forcing factors and interval variability likewise. It consistently solves the big picture, but leaves room for stochastic processes.
-
davidnewell at 06:56 AM on 4 September 2013The Pacific Ocean fills in another piece of the global warming puzzle, and puzzles Curry
As ."One Planet" @ 8 asserts, 'delay" appears to be the motive behind politician's yammering about the "lack of absolute certitude" incessently. And yet, even with "Rush Limbaugh" having 1/2 of his brain tied behind him, he and I and thou and thee and all things whatsoever appear to have a "common cause" here, motivated by a desire to avoid the end of evolution on this planet.
Therefore then, there has to be at least one psychotic in the room, or the matter must not yet be well communicated, as regards the dire-ness of the scenario.
"Relative benefit" is difficult to discern when all parties are reduced to ash, or dessicated proteins.
I don't get how it is that I am extremely motivated, and so many others appear to not give a flying whit.
I did give myself the out of "psychosis", above, please pass the Clozapine.
-
Kevin C at 06:45 AM on 4 September 2013The Pacific Ocean fills in another piece of the global warming puzzle, and puzzles Curry
Yes, it's the Meishausen RCP data.
If we accept the lower AIE and still demand a fit to the warm last decade, then that does indeed suggest a misfit of the response time. Which could suggest something else is misfit and pulling in the wrong direction. I'm currently involved in another discussion on the volcanic response - do you have anything to add on that?
One line of attack would be to release the constraint that all the forcings have the same response function, which might give a clue to where the problem lies. However overfitting is going to be a big problem.
-
MThompson at 06:33 AM on 4 September 2013Greenhouse Effect Basics: Warm Earth, Cold Atmosphere
tcflood @89
So if I understand correctly, the CO2 bending mode is continuously populated by the earth's blackbody radiation in the range of 13-18 microns (770 to 560 cm-1) plus, to a lesser extent, collisions with other atmospheric gasses that have sufficient kinetic energy to activate the bending mode. Of course the most probable speed of the atmospheric gasses does not have enough energy to excite the bending mode, but some small number of atmospheric gas molecules do because of the Maxwell-Boltzmann tail.
Once the CO2 bending mode is activated (by either mechanism) it will relax primarily through collisions with N2, O2 and Ar, thus raising their kinetic energy. The probability of CO2* emitting a photon in the range of 13-18 microns (770 to 560 cm-1) is very small because of the high collision frequency of atmospheric air molecules in the troposphere.
-
CBDunkerson at 05:21 AM on 4 September 2013Study offers clues on 20th century global warming wobbles
K.a.r.S.t.e.N, I agree that one paper doesn't change things, but I have been seeing a lot of papers pushing ocean cycles lately and nothing on aerosols for quite some time. Hence my perception of a shift in the balance of thought on the subject. It is possible that the shift has just been in the papers I have happened to encounter, but that would be a rather odd series of coincidences.
On cloud feedbacks... it wouldn't surprise me if aerosols play a greater role there than ocean cycles, but the general trend of the research I've seen has suggested that cloud feedbacks are likely small (unless that too is an incomplete picture).
-
K.a.r.S.t.e.N at 03:39 AM on 4 September 2013Study offers clues on 20th century global warming wobbles
@CBDunkerson:
I'm afraid I have to disagree ;). While this paper is a promising attempt to narrow down the attributable temperature range (of individual forcers/internal variability), I would be cautious to draw definite conclusion regarding the total aerosol effect. Their proposed direct DTR-solar radiation link works well if only one forcing agent is involved, but other forcing agents do contribute as well, particularly when it comes to cloud feedbacks. Aerosols are certainly the major player, but the results are far from robust enough to overturn the huge amount of literature which points to stronger aerosol effcts. In fact, the "ocean cycle school" has been considerably challenged in recent years by the "external forcing school". One paper won't change that trend ;)
-
K.a.r.S.t.e.N at 02:52 AM on 4 September 2013The Pacific Ocean fills in another piece of the global warming puzzle, and puzzles Curry
@Kevin C:
While TCR is indeed a bit lower (1.4K), the current warming seems to be slightly underestimated which leaves wiggle room for upward adjustments. So not much of a difference. The problem I see with the GISS forcing is that it can't be reconciled with the sulfate emission inventories at all. As sulfate aerosols are the most efficient cooling agent, a linear (negative) aerosol forcing ramp up appears extremely unlikely. Apart from Skeie et al. 2011, also Meinshausen et al. 2011 and Forster et al. 2013 seem to confirm this point of view. The fact that it reduces the correlation coefficient in the 2-box model is an interesting one, but nothing to be worried about. Plenty of options as to why that's the case. I might elaborate on that at the next opportunity (it's primarily a response time issue).
Just to make sure: What you refer to as "Potsdam forcing" is based on Meinshausen et al. 2011, or did I get that wrong? I guess, the Forster et al. 2013 forcing wouldn't actually be that much different. I am not aware of a readily accessible source for the forcing data. Apart from Piers, you may contact Alexander Otto (he used to work from home, so I can't ask him directly).
-
Chris G at 01:50 AM on 4 September 2013The Pacific Ocean fills in another piece of the global warming puzzle, and puzzles Curry
My guess is that Curry got too close to something that made her "terrified beyond the capacity for rational thought", probably at a subconscious level. She has a pattern of invoking the half of uncertainty that does not go there, or only seeing the half of the cycle that takes her farther from there. The simplest explanation I can think of for her illogical thinking is a subconscious filter on what she is able to incorporate into her world model.
No, I'm not a clinical psychologist; yes, I have a degree in the field. I know about enough to get myself into trouble. It fits what I learned in school, but I'm not qualified to do more than guess. -
One Planet Only Forever at 00:22 AM on 4 September 2013The Pacific Ocean fills in another piece of the global warming puzzle, and puzzles Curry
The discussion or presentation of average global surface temperature in terms of "decadal" values may not be the most effective way of communicating the issue. "Decade-by-decade" presentations can play into the scams of those wanting to "delay” action that would reduce their ability to get more profit, pleasure, comfort, or convenience from burning fossil fuels (a practice that is not only creating costs future generations will face without having benefited from the burning but that is simply not sustainable by future generations because the fossil fuels become harder and harder to obtain and eventually would run-out).
“Scientific denial” is not the real problem. The real problem is the success of political efforts to “delay” popular support for actions that would limit the ability of people to get benefits from burning fossil fuels. Those efforts can continue to succeed by arguing that we need to wait for more proof. Claiming that 2000-2010 was the warmest decade to date only allows them to argue that though that may be the case the temperatures so far since 2010 are not higher so we need to wait until after 2020 before we can know more about the need to “start debating” how to reduce the burning of fossil fuels. And a person tending to want more personal benefit will easily consider that to be a reasonable claim, to delay the action that would reduce their potential for benefit.
Presenting the likely magnitude of variability of global average surface temperature due to the ENSO cycle along with the level of the ENSO at the time of a global average would reduce the ability to claim the “need to wait for more proof”. Another way to argue with the delayers would be to point out that until an El Nino event occurs that is as significant as the 1997-98 event they can make no claim regarding “any slowing or stopping that appears to have occurred since the last major El Nino”.
-
Kevin C at 23:48 PM on 3 September 2013The Pacific Ocean fills in another piece of the global warming puzzle, and puzzles Curry
K.a.r.S.t.e.N: That's interesting. The lower aerosol indirect contribution supports a slightly lower TCR, and leaves a little room for a long period oscillation such as the PDO.
Do you know if Piers Forster's forcings from the Otto et al paper are available? I'd like to compare them as well if possible, as it might shed some light on the different TCR estimates we are seeing at the moment.
(If not I guess I'll write to him) -
CBDunkerson at 22:07 PM on 3 September 2013The Pacific Ocean fills in another piece of the global warming puzzle, and puzzles Curry
"Curry incorrectly argued that the study supports the position that global warming is mostly natural."
At a certain point it becomes difficult to believe that deniers are deluded enough to really mean the things they say.
The model incorporates warming from greenhouse gases. It finds that, to date, the overall impact of natural variations has been to mute the atmospheric warming from greenhouse gases by a very small amount. That directly contradicts the position Curry is taking. Or to quote the abstract;
"Although similar decadal hiatus events may occur in the future, the multi-decadal warming trend is very likely to continue with greenhouse gas increase."
How can Curry not know that her stated position on this is nonsense? It's like watching a video from space of the Earth spinning through the course of the day and then saying, 'This supports my position that the Earth is flat.' No... it really really doesn't, and anyone with even basic reading comprehension and reasoning skills can see that. So... what the hell?
-
K.a.r.S.t.e.N at 21:57 PM on 3 September 2013The Pacific Ocean fills in another piece of the global warming puzzle, and puzzles Curry
@Kevin C:
While the Potsdam forcing might exclude the 2nd AIE (cloud lifetime effect), there is no strong evidence that it really matters. The Potsdam-AIE with default weighting corresponds almost perfectly with the current best estimate of the total AIE. What keeps puzzling me is why GISS assumes this rather constant aerosol forcing ramp up. That's very unlikely to be the case (see Skeie et al. 2011). I therefore strongly recommend to use the Potsdam forcing.
-
CBDunkerson at 21:38 PM on 3 September 2013Study offers clues on 20th century global warming wobbles
Seems like there is a growing consensus for ocean cycles being the dominant factor in atmospheric warming "wobbles" rather than aerosols or (even further out of the running) solar variation. What's ironic is that the same deniers who long insisted that global warming itself was simply the result of these ocean cycles now refuse to believe that they could possibly be responsible for decreased atmospheric warming.
-
JasonB at 20:47 PM on 3 September 2013Greenhouse Effect Basics: Warm Earth, Cold Atmosphere
spoonieduck,
As Michael suggested, you should identify the appropriate thread for each of your varied comments so that they can be addressed individually in the correct place. For your questions about Consensus, for example, you could go to the top-left of the page, where the thermometer graphic lies under the heading "MOST USED Climate Myths and what the science really says...", and you'll see that number 4 is "There is no consensus". Click on that link and it will take you to a post with Basic, Intermediate, and Advanced levels that answer your questions before you even asked them.
For the question about whether it was a lot warmer in the far North "way back then", you could start with number 1, "Climate's changed before", and learn how it's precisely that which helps us predict what the consequences will be this time. (Note that being warmer "hundreds of thousands of years ago" is not inconsistent with it being warmer now than since the last interglacial.) You might also want to read the series of posts starting with The Last Interglacial - An Analogue for the Future?
-
michael sweet at 20:09 PM on 3 September 2013Greenhouse Effect Basics: Warm Earth, Cold Atmosphere
Spoonie,
At this site we like people to post on topic to the thread. Since you have so many points you are off topic on most threads. Pick the one ot two you feel most strongly about and ask about that.
I noticed your high school math teacher was way off base. The atmosphere is currently 400 ppm CO2 and went up 3 ppm last year. That is about a 1% per year increase at current rates of emission. About half the emitted CO2 is absorbed so about 2% per year is emitted. There are several hundred years of supply at current rates of emission. You are off by about a factor of 1,000,000. I suspect the rest of your information is about as current as your CO2 emissions. Ask questions about what you do not understand and people will try to help you. If you get your information from the denier blogs you will stay a million times off.
-
michael sweet at 19:55 PM on 3 September 2013The Pacific Ocean fills in another piece of the global warming puzzle, and puzzles Curry
Tamino has a post on this article wit ha little more technical detail.
-
Matt Fitzpatrick at 17:29 PM on 3 September 2013The Pacific Ocean fills in another piece of the global warming puzzle, and puzzles Curry
Yeah, there's quote mine gold here. I'm surprised "... the decrease in tropical Pacific sea surface temperature has lowered the global temperature by about 0.15 degrees Celsius compared to the 1990s" hasn't gotten ripped out of context and reposted on a bazillion blogs. Yet.
But as to the substance of the paper, climate contrarian Marcel Crok asked Xie for a response to Curry's analysis, which is now posted on Crok's blog "Staat van het Klimaat", which appears to be Dutch for "Look How Cold It Is!".
Short version, Xie agrees with Curry that recent warming was modulated by natural variability, but cautions that natural variability's ups and downs average out over long periods, and did not play the primary role in the century-scale warming trend.
-
Kevin C at 17:04 PM on 3 September 2013The Pacific Ocean fills in another piece of the global warming puzzle, and puzzles Curry
Hmm. That graph looks familiar. Where have I seen it before?
Oh yes. Here:
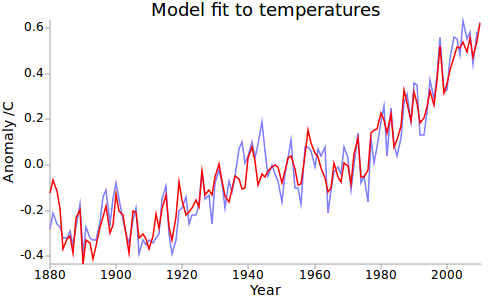
Their result is a good match for my toy 2-box+ENSO model from last year, but far more rigorous. Tamino has produced a very similar model.
You can play with it online here. It produces a good match for IPCC TCR estimates, but the results are of course totally controlled by the uncertainties in the forcings, so that doesn't prove anything. I think the Potsdam forcings omit 2nd AIE (is that in the glossary?), so you have to upweight AIE by 50%. What it does show is that curent forcing estimates can explain 20thC climate very well.
-
spoonieduck at 15:58 PM on 3 September 2013Greenhouse Effect Basics: Warm Earth, Cold Atmosphere
tcflood,
You are Way over my head. I'm but an interested dilettante in this man-made global warming stuff. Still, I have some observations which may or may not be pertinent to anything. Consensus: Who was polled to establish the so-called Consensus? Climatologists? Weathermen? Physicists? Sociologists? Petroleum Engineers? Volcanologists? Ecologists? Paleontologists? Archaeologists? Pathologists? Dentists? For sure, nobody polled me.
Also, science isn't about consensus. Science is the effort--sometimes the painful effort--to get at something approaching the truth. At one time "consensus" had it that the four humors were responsible for health and disease. At one time "consensus" had it that the sun revolved around the earth. At one time "Consensus" had it that most cancers started with one great mutational 'hit'. "Consensus" is a misleading term if there ever was one.
So much for my soap box. The other day I was watching a TV show--the source of most of my scientific information. The Journalist was interviewing scientific types. One was a young woman digging away in the melting Alaska permafrost. They filmed impressive looking sink-holes caused by melting ice. She climbed down into a sink-hole [looked risky to me] and showed melting frozen earth, 2-4 feet deep, containing clusters of roots from "plants that died hundreds or thousands of years ago."
Hmmm. Either these were the roots of plants that could grow in solid ice OR climate was a lot warmer in the far North way back then. [Little Climatic Optimum?]. How could it have been warmer 'hundreds of thousands of years ago, when it's supposed to be warmer NOW than since, if not before, the last interglacial? What do you think?
I know. The exception proves the rule. Still, they went on to claim that, at the present rate, by the end of the century, atmospheric CO2 would be twice that of today and the fish would boil in the sea [that's a joke]. Anyway, I googled it and did some high school arithmetic. Maybe I made a couple of systematic errors but, looks like, if we burned All petroleum and natural gas tomorrow, we would increase the tonnage of CO2 in the atmosphere by .001%. Note, this isn't saying that the % in the earth's atmosphere would go up that much. It means that atmospheric CO2 would go up a tiny fraction--IF--we burned it all at one time. Of course, all that petroleum-produced CO2 might hug the ground and heat up the surface a lot because, as we know, manmade CO2 is a lot different from 'natural' CO2.
Also, I worry a lot about carbonates. I live on a hill loaded with sea shells, ammonites, snails etc. that died tens of millions of years ago. The 'turn-over' rate is pretty slow and my guess is that they'll be locked in the rock another 65 million years. It occurs to me that the same thing is happening in the sea today. Sea life--especially those with shells--must be locking up plenty, plenty of carbonates. Once locked, they are generally fixed unless cooked and vaporized by volcanoes.
Moderator Response:[DB] In addition to the sage advice already given you below, please read The Big Picture thread for background...and familiarize yourself with this site's Comments Policy.
-
Bernard J. at 15:40 PM on 3 September 2013The Pacific Ocean fills in another piece of the global warming puzzle, and puzzles Curry
As I noted last week at Hot Whopper the authors did no favours for themselves or the interpretation of their paper by using the term "hiatus" without any prefacing modifiers.
It's important to emphasise that there is no hiatus in overall global heat accumulation - only a redistibution such that the surface of the planet manifests less of the overall heat accumulation. This is of course what Kosaka and Xie are describing, but the Denialati have run with the ambiguous phrasing and released their own twisted meme to the world whilst Precision stands waiting for Truth to finish lacing its boots so that the former personage can pull on its own footwear.
Prev 840 841 842 843 844 845 846 847 848 849 850 851 852 853 854 855 Next


