


 Arguments


Recent Comments
Prev 849 850 851 852 853 854 855 856 857 858 859 860 861 862 863 864 Next
Comments 42801 to 42850:
-
michael sweet at 21:30 PM on 11 August 20132013 SkS Weekly News Roundup #32B
The state of California released a report that describes the measured effects of climate change in California. The linked page has a link to the press release, the report summary and the entire report. This is an update to a report originally written in 2009. The report summary includes a list of the effects that had been updated or were new. I found it interesting to see what the new effects were relative to what was known in 2009 (black carbon and ocean acidification were among the new sections).
-
chriskoz at 21:24 PM on 11 August 2013Reflections on a changing Arctic: Less ice means faster warming
BC@13,
Thanks for the pointer to the excellent post by Tamino, of which I am aware. Note that Tamino (as well as Hudson 2011 in large part) estimate the forcing from just the sea ice extent data. They model the resulting albedo change between sea ice and open ocean as 0.2 and calculate the resulting extra amount of isolation penetrating water. They asume no changes in other parameters. In particular, the type of ice and the clouds stay the same.
Riihela et al., (2013) however went beyond that, and have derived the albedo from satelite observations and shown that the type of ice has also changed, quote from the abrstract:
...we present an analysis of observed changes in the mean albedo of the Arctic sea-ice zone using a data set consisting of 28 years of homogenized satellite data4. Along with the albedo reduction resulting from the well-known loss of late-summer sea-ice cover5, 6, we show that the mean albedo of the remaining Arctic sea-ice zone is decreasing.
I don't have access to the full text so I am not sure if my understanding is correct, but I think their sea-ice zone albedo of −0.029±0.011/decade is just the result of change in quality of the remaining ice: i.e. ice becoming darker. Therefore, the resulting climate forcing should be calculated and added on top of Hudson/Tamino forcing. Having reread the former, ignoring the math, I do not feel the extra forcing from Riihela et al., (2013) will increase the perceived .1-.13W/m2. In any case, without unknown methane feedbacks, it is not signifficant (yet) compared to the primary CO2 forcing.
I guess "dark snow" project by Jason Box may shed additional light on the decreasing albedo in Arctic. So I'm looking for its results... -
jja at 17:12 PM on 11 August 2013How much will sea levels rise in the 21st Century?
After crafting a lengthy response and then having it lost due to time out of login status I will summarize.
@davidnewell I am sorry, the 180 GTco2 was not 2100 it was 2050 here: figure 38 China LBL 2050 emission
MA Rogers @30
Thank you for showing me that, I do not exactly grasp the difference between the measured energy imbalance and the RF value, they should be the same in my mind. What am I missing?
The value I used was indeed RF values not energy imbalance. If I use your math and Hansen & Sotos value of .75 (they adjust for the solar minimum) I get a value of (7.5 * .75/.58) * 1.2 which is equal to 11.6 ZJ p.a. this will make a total earth cumulative energy imbalance of 1,000 ZJ by 2100 (86 years) If even a few of the non-linear feedbacks are taken into account and a higher (more realistic) emission scenario is used then the value of energy imbalance by 2100 could easily be 4-6X the current value. Therefore the total cumulative energy by 2100 will be closer to 3,000 +2,000/-1,000 ZJ . This will increase if I used the slightly higher values of Balmaseda, Trenberth & Kallen
In addition, if the ECS value is 4.3 then surface warming will be greater and the proportion of heat transferred by convection to land-based ice will increase.The AF is discussed in Terenzi & Khatiwala here:
We believe that the increase in AF can be explained simply by a decrease in the capacity of both the ocean and land-biosphere to absorb anthropogenic carbon, as evinced by decreases in both OF and LF (not shown). This is likely due to saturation effects such as changes in the oceanic Revelle buffer factor (e.g., Keeling, 2005). Indeed, when we linearize the chemistry, which in effect holds the buffer factor fixed, the upward trend disappears (not shown). Thus, even with a fixed emission growth rate, our model, with no carbon-climate feedbacks, predicts future increases in AF because of the nonlinearity of the carbon cycle.
Yes, with a more rapid loss of arctic sea ice, the increase in boreal emissions and the potential for collapse of natural carbon sinks will incrase the AF even greater, couple this with a more realistic emissions scenario and 5 or even 21 M of SLR by 2100 will be barely noticed by a loose group of remnant humanity living hand to mouth for basic survival.
-
Riduna at 17:01 PM on 11 August 2013Reflections on a changing Arctic: Less ice means faster warming
Faster Warming Means Less Ice
-
Tom Curtis at 07:10 AM on 11 August 2013Reflections on a changing Arctic: Less ice means faster warming
rockytom @15, whatever his other vices, Spencer cannot have lied simply by saying that Antarctic sea ice was increasing while Arctic sea ice was declining:
(Tamino)
Tamino had this to say in his most recent comment on Antarctic sea ice (of which I am aware):
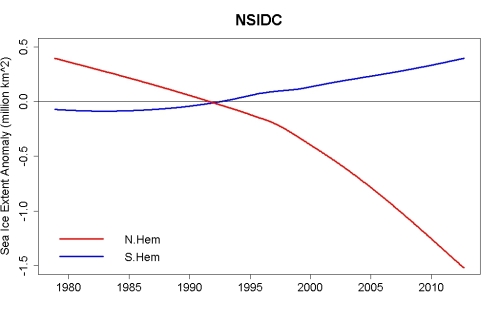
"Both [Antarctic sea ice area and extent] have shown increase over time which is statistically significant. The smoothed values for extent have increased by about 0.57 million km^2, area by about 0.51 million km^2. The reason for its increase is uncertain, but two possibilities which have been suggested are: 1, increased precipitation (snowfall) due to warming near the tropics; 2, intensification of the “polar vortex” perhaps due to changes in stratospheric ozone concentration.
Despite the fact that the southern ice pack is larger overall than the northern, its increases are much smaller than the decreases noted for the northern hemisphere, 1.96 million km^2 in extent and 1.92 million km^2 of area. This puts the lie to claims (oft repeated) that southern gain even “almost” balances northern loss — the northern extent loss is 3.4 times as great as the southern extent gain while northern area loss is 3.8 times as great as southern area gain. When one is nearly 4 times as big as another, they are certainly not “balanced” and anyone who claims so is either a fool or an outright liar."
(Original emphasis)
I don't have much to add to that except to note that the extended satellite record from 1973 shows a declining trend in Antarctic sea ice due to an initial sharp decline from 1973 to 1978 (PDF). Further, while Manabe et al (1991) predicted a thickening of Antarctic sea ice, and some more recent models (3 of 12 assessed by Stroeve et al (2007) also show a declining trend - the models are not consistent enough on this point to say that either increasing or decreasing Antarctic sea ice in the short term are prediction of climate science. Sea ice dynamics are not captured well in climate models either in the Arctic (where the decline is massively under predicted) nor the Antarctic (where the predictions are inconsistent between models).
-
william5331 at 06:10 AM on 11 August 2013Reflections on a changing Arctic: Less ice means faster warming
If the sea releases heat into the atmosphere, this cools, not warms, the ocean. It also releases more water vapour into the atmosphere which can cause low pressure weater systems with accompanying clouds. This increases Albedo. This is clearly seen this year (2013) and while it will only delay the ultimate melt, it is interesting to see Gaia fighting back.
-
CBDunkerson at 04:09 AM on 11 August 2013Reflections on a changing Arctic: Less ice means faster warming
dwr, the DMI page states that it uses 15% sea ice extent. There is also a red note at the bottom which says they recently changed their methodology to adjust for coastal zones. A link in that red text goes to the version prior to the adjustment... which seems more in line with the other sources.
http://ocean.dmi.dk/arctic/icecover.uk.php
Thus, the higher ice extent DMI is showing compared to the other sources is apparently due to the fact that they are now measuring the ice extent over a larger total area.
-
rockytom at 03:28 AM on 11 August 2013Reflections on a changing Arctic: Less ice means faster warming
I recently watched Roy Spencer lie to congress ( a U. S. Senate committee) by stating that although sea ice was declining in the Arctic, it was increasing in the Antarctic and concluding that other testimony to the same committee on Arctic sea ice was only part of the story. It was Spencer who told only part of the story as he did not mention that the polar ice in the Antarctic is land based while that in the Arctic is sea ice (adjacent to Greenland which is land ice) and that all areas are losing ice as the planet warms. There is solid evidence that ice shelves tied to land ice in Antarctica are losing ice by being undercut by warming seas, therefure speeding Antarctic glaciers movement to the sea. Spencer's testimony was astoundingly simplistic, but not unexpected from such an "expert."
-
keitho at 01:44 AM on 11 August 2013Reflections on a changing Arctic: Less ice means faster warming
Thank you for posting this fascinating article. The effects of reduced albedo, even at very high latitudes and hence low angle of incidence of the sun's rays , are obviously very important.
The other effect of reduced sea ice must be the reduction in insulation of the Arctic ocean water. Presumably open sea water must be able to release heat to the cold atmosphere, without the inhibiting effect of a blanket of ice covering it, more readily. Does anyone have any thoughts on this?
-
StealthAircraftSoftwareModeler at 22:36 PM on 10 August 2013CO2 effect is saturated
Moderator [DB] post to my comment @266: I cover several things in my post, but they covered the three items in Tom Curtis’ post at @263. He was not called out for “being all over the map.”
He claims in 263:1 that I do not seem to understand what models are, and I show that I build software models for a living. I may not know a lot about LBL models, but I know a lot about software, physics based models, testing models, and so on.
Then Tom Curtis covers lots of excellent data in 263:2 and the Dessler 2008 paper. This shows that LBL models are accurate in computing reduced IR flux for CO2. This is directly related to whether not CO2 is fully saturated, is it not? I was questioning this because I was concerned about the accuracy of models because Myhre 1998 use models to arrive at the 5.35 coeffcient in the generally accepted CO2 forcing function (ΔF = 5.35*ln(C/C0) W/m2). TC showed support that models (including MODTRAN) are pretty accurate. I believe that now, for the most part.
In 263:3 he jumped on Lindzen with valid comments, so I with drew my usage of his comment about the effects of CO2.
Then my longest part is a lot of data about MODTRAN and the reduction of IR flux. MODTRAN has been shown to be accurate by Tom Curtis in 263:2 and Dessler 2008, so I am using its data. My ultimate point is that both Myhre and MODTRAN cannot be correct. The entire topic is about whether no CO2 is fully saturated. This is all about the CO2 forcing function (ΔF = 5.35*ln(C/C0) W/m2) from Myrhe 1998 and the coefficient of 5.35. I run MODTRAN and I get 4.58 in clear skies. In cloudy skies I get a value of 3.61. Most of the planet is cloudy, so the 3.61 value, if MODTRAN is correct, is probably more accurate. These values from MODTRAN disagree with Myrhe 1998. I am not claiming incorrectness on anyone’s part – only showing that they are inconsistent. You guys cannot claim that CO2 is not fully saturated and it has a large effect because of the 5.35 coefficient, then claim that MODTRAN is accurate.
Does this help clear up my point? And does it show that I am actually on topic?
-
Reflections on a changing Arctic: Less ice means faster warming
Chriskoz at 1. There was a post by Tamino 6 October analysing the forcing due to Arctic albedo changes
http://www.skepticalscience.com/arctic-antarctic-sea-ice-insolation.html
Here's an extract from the article -
In fact Hudson states that
"Results show that the globally and annually averaged radiative forcing caused by the observed loss of sea ice in the Arctic between 1979 and 2007 is approximately 0.1 W m-2"
-
dwr at 22:09 PM on 10 August 2013Reflections on a changing Arctic: Less ice means faster warming
I've been pondering over the sea ice extent data recently. In particular I'm struck by the disparity between DMI's extent and that of JAXA, NSIDC, ROOS... in fact, *all* of the others.
As of 9th August, DMI indicates cover of 8.5 m/km^2; the others are around the 6.5 m/km^2.
I know that DMI use 30%, whereas most of the others use 15%; but then I'd have thought this would have made DMI extent smaller rather than larger than the others? Surely there are more cells with 15% ice than 30% ice?
And even accounting for the percentage difference, surely 2 m/km^2 is too large an extent difference to be explained by different counting methods?
Can anyone offer an explanation or tell me where I'm going wrong?
Thanks.
-
chriskoz at 18:38 PM on 10 August 2013Reflections on a changing Arctic: Less ice means faster warming
Russ@5,
I don't know what your "different picture of global ice" means because mod has snipped you (no doubt rightly so) but I agree the picture of antarctic ice is quite different. That's why this article about Arctic does not consider Antarctic, not because, as if, according to you, "the Earth had only one pole".
Other commenters already hinted the differences. I'd like to add, that the different response of antarctic ice is consistent with the global warming we are experiencing. Notably, the recent studies have linked the increased antarctic winter iceshelves with the decreased salinity of surface waters due to the melt of antarctic icesheet. So, that phenomenon should not be seen as a "sceptic"-proclaimed "recovery" but as another bad news, that we are loosing the antarctic icesheet - at increasing speed.
-
TonyW at 17:35 PM on 10 August 2013It's methane
Methane levels started to increase again, about 6 or 7 years ago, so this explanation needs updating.
-
scaddenp at 14:06 PM on 10 August 2013CO2 effect is saturated
Sorry looking further up, I see you have answered the question about the distinction in models.
-
scaddenp at 14:04 PM on 10 August 2013CO2 effect is saturated
Please can we make sure that you are not confusing models in the sense of GCM (which would have a complexity considerably larger than say CFD models for airplane simulation) and LBL models which would be at least an order of magnitude simpler, mathematically and computationally. I cant see why you think the accuracy of 5.35 is so important - how much difference does it make whether it is 5.1 or 5.8? To my mind, this part of the equation pales to insignificance compared to uncertainities in feedback.
It also puzzling how you can read and Dessler (read the more recent papers) and yet make a statements about effect of cloud uncertainties. The best we have would put the net effect of clouds about approximately zero. If you have a substantial criticism then perhaps follow up here or here. Note that clouds are both positive and negative.
It would also be interesting to know what your alternative hypothesis is. If the obviously change in net forcings is not cause of observed climate, what do you propose instead and what is your case for this making physical sense.
-
Klapper at 13:57 PM on 10 August 20132013 SkS Weekly News Roundup #32A
@Klapper #3:"Moderator Response:[DB] Assertions lacking evidence get disregarded quickly."
Using data downloaded today from the NOAA/NCDC (ftp://ftp.ncdc.noaa.gov/pub/data/anomalies/monthly.land_ocean.90S.90N.df_1901-2000mean.dat) show the following annual averages by global temperature anomaly rank for the calender year:
Rank Year Global SAT anomaly 1 2010 .658 2 2005 .651 3 1998 .633 4 2003 .623 5 2002 .612 6 2006 .597 7 2009 .595 8 2007 .589 9 2004 .578 10 2012 .575 As you can see the assertion that the rank range is 8 to 9 is incorrect. The RSS global TLT anomaly is 11th.
-
StealthAircraftSoftwareModeler at 13:23 PM on 10 August 2013CO2 effect is saturated
Tom Curtis @263:
It has been a little while for me. Sorry for responding slowly and appearing to drag out a topic, but I read what you guys send, I do some research, and I think about things a bit. I’m trying not to jump to conclusions and I am really trying to dig into things to get a better understanding.
1) I think I have a pretty good idea of what models are, why they are built, how they are used, and what many of their weakness are: I have a physics degree and computer science degree and have been software building models for 30 years for aircraft, threats, radars, missiles, various aircraft sensor and weapons, and earth components such as terrain and weather (not climate, but weather as it impacts these systems). I test my models for aircraft with other models, measurement data in labs and anechoic chambers (http://www.tdk.co.jp/tfl_e/chamber/chamber01/5.html), tests from poll models (http://www.thehowlandcompany.com/radar_stealth/Bluefire_Helendale.htm) and actual flight tests. I know from first hand experience that testing is critical and that models and lab tests do not always match very well to what happens in the real world.
My question @261 was more related to verification and validation of the various LBL models as they relate to the atmosphere. My concern was for the accuracy of the 5.35 coefficient in the CO2 forcing equation. If this value was derived from models without any real world measurements to back it up, then I would be highly suspicious of it.
I would not dispute Newtonian mechanics for orbital prediction since that is easy physics. The climate, however, is very complex and making accurate predictions is hard. Think more along the lines of trying to predict where a gold ball will land after being hit with a golf club. Let’s say we need 1% or 2% accuracy too. That is wicked hard even if you know the exact initial conditions of the ball when it leaves the club face. You will have to run a complex and iterative numerical-methods simulation that considers many things: winds, ball drag (which is a function of many things), spin on the ball, lift induced by rotating body, and so on -- hard stuff to be accurate. Think about why we have GPS and laser guided bombs (which I know a lot about) – we do not use dumb unguided bombs because they are very inaccurate -- we can model the physics with extreme precision but still cannot hit anything with a dumb bomb. There simply is too much uncertainty in the environment, even on a very small scale. Therefore, we install guidance and targeting systems to compensate for errors and drift as it develops during the bomb delivery. (I also think the iterative growth in errors within GCM is a huge problem, but I’ll get into that over on the models topic).
2) I dug into Dessler et al 2008 in JOGR, and that was an impressive study and test. That helps me gain confidence that the models are at least in the ball park in terms of accuracy with respect to the real world. Excellent charts, data, and a great study on Dessler’s part.
3) I was wondering if the Lindzen reference was the same guy at MIT. I wasn’t sure and I wasn’t claiming or supporting it at all. It was just a data point in a list of points about the effects of CO2 and how they varied a lot. Granted, Lindzen was an extreme outlier and I withdraw his data point from my previous point @261.
I spent a bit of time playing with MODTRAN running numbers on the reduced IR flux from CO2 and cloud effects. Since the chart you reference above shows that MODTRAN matches fairly close to IRIS Satellite data, I think my analysis below should be accurate.
I found that for no clouds and CO2 at 294.3 ppm the IR flux is 288.97 W/m2. At 800 ppm CO the IR flux is 284.39 W/m2. The ratio of 800 to 294.3 is approximately e, so the natural log of this is very close to1. Using this I compute that coefficient for the CO2 forcing function is 4.58. This is 15% less than Myhre 1998, and his value of 5.35 is 15% less than the previous IPCC value of 6.3. I am sure that Myhre is a good scientist, but it seems that MODTRAN has been shown to be accurate, yet its output disagrees with Myhre. I find the wide range of values from MODTRAN, Myhre, and IPCC over the last decade not very reassuring in that scientists have a solid grip on these values. I know and fully accept that it is a very noisy world, so I fully expect that this value is hard to determine.
Furthermore, when I run similar numbers using clouds in MODTRAN, I get an IR flux of 261.78 W/m2 for 294.3 ppm CO2, and 258.11 W/m2 at 800 ppm CO2. This yields a CO2 forcing function coefficient of 3.61, which is 21% less than MODTRAN with no clouds, and a full 33% less than Myhre. So while CO2 is not technically fully saturated, its effect is small relative to clouds. The reduced IR flux just from clouds alone is 27 W/m2 when compared to clear sly. Since 60% to 70% of the earth is covered with clouds, it seems logically correct to me that clouds are a major player in IR flux. If doubling CO2 reduces IR flux by 3.7 W/m2, but clouds reduce it by 27 W/m2, then clouds are over 7 times stronger than CO2. A small change in cloud coverage could easily overwhelm the effect of CO2, making the issue of whether or not CO2 is fully saturated really a moot point. Is this not correct?
Given the magnitude of the effect of clouds, how has climate science determined that most of the global warming since 1950 is most likely due to CO2? That seems like an impossible thing to determine. In 1950 CO2 was about 310 ppm and today it is 400 ppm. Even using Myhre’s CO2 forcing coefficient of 5.35, CO2 has only blocked 1.36 W/m2 in the clear sky portion of the atmosphere. Where there are clouds the effect is even less. Isolating CO2 when so many other moving parts of the earth’s energy balance are also changing seems impossible, especially given we do not have very good data on clouds since before satellites (about 1970). How can the IPCC claim that it is very confident that CO2 has caused most of the recent warming?
KR @265. The devil is always in the details. The horse is never dead. There is nothing that is *true*. Science can only falsify things and cannot prove something to be true. Some scientific theories are accepted as true only because they have withstood the test of time and have not been shown to be false. I seriously doubt that climate science is any where near achieving this status.
Moderator Response:[DB] You are all over the map here, with much of your comment off-topic for this thread. Please direct comments towards models to one of the model thread. Your question about attributions is discussed on a number of threads, summarized here.
Assuming scientists do not know what they are doing because it disagrees with your preconceptions is simply arguing from your personal ignorance. Much of what you claim is unknown is actually fairly well-understood by science.
It would be helpful to adopt a more streamlined approach to both your comment construction, the threads on which you place them and operate with less of a presumption that the science must be wrong.
-
DSL at 13:10 PM on 10 August 2013Fox News found to be a major driving force behind global warming denial
Change, the best recent piece I've seen on that observation is from Michael Fumento, a Reaganite, and it includes commentary on AGW.
-
A Change in the Weather at 12:24 PM on 10 August 2013Fox News found to be a major driving force behind global warming denial
I don't think "conservative" is the most accurate descriptor for Fox News. Limits, moderation, and restraint are conservative ideas. Respect for the truth is a conservative idea. The scientific method is the epitome of a conservative idea. Fox exhibits these rarely. More often, they loudly express radical, reactionary, antisocial ideas that deny science and disrespect the truth.
-
michael sweet at 12:00 PM on 10 August 2013Understanding the long-term carbon-cycle: weathering of rocks - a vitally important carbon-sink
David,
How much energy will it take to pump that much water from the Pacific up to the Great Basin? Where will that energy come from? Is that really the best use of that much energy? What will you do with the left over salt?
-
Klapper at 11:51 AM on 10 August 20132013 SkS Weekly News Roundup #32A
From the 2012 NOAA climate report:
"Four major independent datasets show 2012 was among the 10 warmest years on record, ranking either 8th or 9th, depending upon the dataset used."
That's not quite true according to my most recent analysis of RSS, UAH, GISS, NCDC and HADCRUT4 datasets. The range is from 9th to 11th (not 8th to 9th).
Moderator Response:[DB] Assertions lacking evidence get disregarded quickly.
-
Riduna at 09:23 AM on 10 August 2013How much will sea levels rise in the 21st Century?
MA Rodger – Thank you for your comment @ 28 in which you note that … “The paleoclimate evidence does show very convincingly that small increases in global temperature will result in very large SLR”.
It does indeed – but that very large SLR is likely to come from rapid loss of land based ice so it would seem that heat does get to polar ice causing mass loss, or the ice sheets are much more responsive to polar amplified temperature than hitherto thought is this a wrong assumption?
-
deweaver at 08:57 AM on 10 August 2013Ocean Acidification: Eating Away at Life in the Southern Ocean
Iana,
Considering that the discharges of Calcium from the rivers of the world are from weathering, where do you have any data showing volcanic emissions are a dominant source of Calcium for the oceans. The acid gas emissions from volcanic sources are real.http://pubs.usgs.gov/circ/circ1133/chemsetting.html Notice the hardness (as CaCO3) is a fair fraction of seawater (50%) and often near saturation, whereas the concentrations of soluble salts (NaCl) is a small fraction of seawater.
-
CBDunkerson at 08:32 AM on 10 August 2013Reflections on a changing Arctic: Less ice means faster warming
Russ wrote: "A more comprehensive view would consider global sea ice area..."
Ok. The third graph you posted shows global sea ice area... and a clearly declining trend.
Comprehensive view considered. Now back to the specifics of what is going on in the Arctic.
-
shoyemore at 07:47 AM on 10 August 2013Reflections on a changing Arctic: Less ice means faster warming
Russ R.,
mbryson is right. Nothing wrong with a discussion of Antarctic Sea Ice, but once you get to the nitty-gritties, the Arctic is mainly ocean, Antarctica is mainly land ice.
Though I hope you are not arguing that there is some "compensatory" mechanism ensuring that Arctic + Antarctic Sea Ice is roughly constant. That is about the same as the "Jesus is just moving the ice from the Northern to the Southern Hemisphere" argument I have heard some deniers make.
Even a cursory look at your bottom chart shows that on a global scale, sea ice is declining, as is land ice and summer snowpack in the "cryosphere" generally.
This site has some good threads on Antarctic ice. The topic of this thread is the effect on albedo of Arctic ice decline, and the Arctic is indeed warming faster than anywhere on the planet.
www.skepticalscience.com/antarctica-gaining-ice-intermediate.htm
-
DSL at 07:41 AM on 10 August 2013Reflections on a changing Arctic: Less ice means faster warming
Ugh - "significant" > "insignificant"
Doh -
DSL at 07:40 AM on 10 August 2013Reflections on a changing Arctic: Less ice means faster warming
Russ, if you want to be taken seriously as someone who's interested in scientific progress, avoid doing what you have done. You accuse others of ignoring data, but you fail to point out why the data are meaningful. The same logic is used with "GMST trend is statistically significant over the last 15 years!" So what? No one talks about Antarctic sea ice. Why should they? I'm not saying it can't be relevant; I'm asking you to tell me why it is.
-
mbryson at 07:31 AM on 10 August 2013Reflections on a changing Arctic: Less ice means faster warming
Russ: Conditions in the arctic and antarctic are very different, so combining the data doesn't clarify what's going on, it obscures it. Antarctic sea ice is strictly a winter phenomenon, so its greater extent (apparently due to a strengthened antarctic gyre and possibly fresher surface water from increased melting of land ice) has no significant effect on albedo. Meanwhile, warmer, saltier subsurface water is undermining large glaciers.
In the arctic, on the other hand, the increased melt/ decreased area happens during summer and makes a big difference to albedo (even when ice extent remains high, meltwater on the surface reduces albedo). The trend there is running well ahead of models, and trying to make it 'go away' by combining it with antarctic sea ice measures is a fool's errand.
-
Russ R. at 05:42 AM on 10 August 2013Reflections on a changing Arctic: Less ice means faster warming
Notably absent from this analysis and discussion is any mention whatsoever of Antarctic sea ice. One might easily get the impression that our planet has only one pole.
A more comprehensive view would consider global sea ice area, not just the northern hemisphere. And that perspective would show a somewhat different picture:

(-snip-)
(-snip-)
Moderator Response:[DB] The topic of this thread is The Arctic, not the Antarctic. As others have helpfully noted for you, take your attempted discussion of things Antarctic to one of the more appropriate thread.
Further, please familiarize yourself with this site's Comments Policy before posting any further comments. Please also ensure that all future comments comply with the Comments Policy. Subsequent off-topic comments similar to this will be simply deleted.
Off-topic snipped.
-
iana at 02:58 AM on 10 August 2013Ocean Acidification: Eating Away at Life in the Southern Ocean
"A quick analysis indicates that weathering is probably the main factor and volcanic activity, especially sulfur and CO2 emissions make the OA problem worse."
Complete and utter rubbish. Peer reviewed or I call BS.
-
kkennett09 at 01:04 AM on 10 August 2013There is no consensus
Jg2013
I am glad you brought up this point. As a public school teacher I can attest to the notion that the disinformation swirling around global warming and climate change is happening at my high school in Michigan. A science teacher at my school shows his students “The Great Global Warming Swindle” and not for the purposes of demonstrating the use of propaganda. Although I do not teach in the science curriculum, I do teach U.S. Government and Politics and I am privy to the forces unleashed upon teachers regarding these issues. The “teach the controversy” phenomenon, pushed by the Heartland Institute, et al, is alive and well and is straight out of the tobacco industry playbook to “deny the science” and manufacture doubt”. I am sure you are aware of the book Merchants of Doubt by Naomi Oreskes which does a nice job of explaining the tobacco industry's playbook which is currently in use by the fossil fuel industry.
-
Physicist-retired at 22:48 PM on 9 August 2013Reflections on a changing Arctic: Less ice means faster warming
Trends in Arctic sea ice loss are easier to spot when considering volume (as opposed to area or extent). See, for example, this:
http://iwantsomeproof.com/extimg/siv_annual_polar_graph.png
More here:
https://sites.google.com/site/pettitclimategraphs/
And I agree, Glenn - watching daily events/data coming from the Arctic this year has been nothing short of stunning.
-
Glenn Tamblyn at 22:15 PM on 9 August 2013Reflections on a changing Arctic: Less ice means faster warming
franklefki
Agree with what you say with one proviso. Year to year variability can swamp the trend briefly. But the long term trend, using a several year average for example, is clear cut.
This year in the Arctic is stunning. Stunningly strange. Huge cracking events through Feb-April, Significantly colder and cloudier this year. Several cyclones that have (are as I speak) smashing the thin ice up. The possibility of an ice free Pole this year, maybe an ice free Eastern Hemisphere. But much reduced ice loss in the Beaufort & Chukchi seas. Smoke from forest fires in Russia moving out over the arctic. Jet Stream doing weird stuff. Record highs in parts of northern Canada and Greenland. Then freezing the next day. The Kara sea taking forever to melt out. And ice transport out through the Fram Strait almost shut down.
Hold onto your hats.
-
franklefkin at 21:49 PM on 9 August 2013Reflections on a changing Arctic: Less ice means faster warming
Given everything that is stated in the article, it seems unlikely that a recovery is possible.
There is more CO2 in the atmosphere - so there is more TOA forcing,
There was less ice last year - so there should be less this year
This positive feedback loop is tantamount to a runaway heating loop - bounded only by the fact that once the ice is gone - its gone. Of all the postulated theories, this one seems the most likely to be tested the earliest. It seems likely that there will be some kind of a rebound (at least for this year) in the quantity of artic ice. The next few years will be very telling.
-
MA Rodger at 21:28 PM on 9 August 2013How much will sea levels rise in the 21st Century?
davidnewell @31 & grindupBaker @32.
The CDIAC estimates for China's 2011 CO2 emissions is 2.48 GtC. Such a rate of emissions would total 217 GtC over the period 2014-2100 although its impact on atmospheric levels would have to be reduced by the Af (which wasn't employed @32). CDIAC put China not neck-and-neck with USA but head-and-shoulders ahead (US 2011 estimate is 1.47 GtC), although these two remain the big beasts with a big gap down to the next biggest - India 3rd (0.62 GtC) & Russia 4th (0.46 GtC). -
Tom Curtis at 21:05 PM on 9 August 2013Nils-Axel Mörner is Wrong About Sea Level Rise
Tamino now has a post analyzing Morner's use of the Fremantle data mentioned in point 5 of my post @51 above.
-
chriskoz at 20:55 PM on 9 August 2013Reflections on a changing Arctic: Less ice means faster warming
Given albedo change numbers, the obvious next step is to integrate the function delta energy absorbed over the arctic during summer months (may thru september) and average the energy over the whole year and the global surface. It would be interesting to compare the resulting forcing with the existing imbalance of 0.6W/m2 and the delta forcing the human increase of 2ppm/y brings.
Has anyone done that? Which delta forcing would be higher? It would be interesting to predict arctic albedo delta forcing until 2100. Of course not on IPCC estimates (which we know are completely wrong in arctic with respect to any parameter) but e.g. on Maslowski's estimates which are right on track. I guess IPCC did not even take arctic albedo changes into their scenarios in AR5.
So, with delta albedo established at about -10% since satelite records, can anyone come with ballpark forcing figure I am asking?
-
grindupBaker at 14:49 PM on 9 August 2013How much will sea levels rise in the 21st Century?
@davidnewell #31 That would be the total carbon emissions of China projected at 2100. 1 ppmv CO2 = 2.13263 Gt carbon (I compute) so that would be 84 ppmv CO2 as China's contribution. I seem to recall China is now neck & neck with USA at ~1.6 Gt carbon p.a., but that's a hazy memory I have.
-
davidnewell at 13:11 PM on 9 August 2013How much will sea levels rise in the 21st Century?
jja, you stated "Current projections hold China to emit 180 GT of carbon by 2100"..
Is that annually,? Do you have a reference??
It ain't gonna happen, but I'd like to see where it came from: that number is both atrocious
and .... totally beyond the capacity of the biosphere to deal with.
.
-
davidnewell at 13:01 PM on 9 August 2013Understanding the long-term carbon-cycle: weathering of rocks - a vitally important carbon-sink
Greetings. A wonderfully informative site.
Currently, I am proposiing that the weathering products of Granite, assembled conveniently in depths of over 8,000 feet thickness in "dry lake playas" located in the "Great Basin" of Nevada, be utilized to sequester CO2 in gigatonne quantities, through the importation of Pacific Ocean water; and through the simple expedient of spraying the water above the playas, whose supernatant water ranges from pH approx. 8.5 to approx. ph 10 .
in fact, i have "patent pending" staus on a patent entitled "Carbon Dioxide Direct Air Capture and Sequestration utilizing Endorheic Basin Alkaline Deposits to effect Mineral Carbonation"
excerpt:
Presuming then a 150 foot radius spray fan, and an average wind speed of 10 MPH, the volume of CO2 which will pass through the plane of the fan half-circle, per year, is ~ 400,000 metric tonnes. This is for one "spray rig", and, ultimately, thousands are envisaged. (See note __)
==
Tests are being designed to see how much of that 400,000 tonnes of CO2 can be captured.
i GUESS that between 8% and 15% can be 'caught": but this is a guess.
Obviously there is more to it than this, but I would invite consideration, questions, rebuttle, arguments, or any input whatsoever.
We are all in this together.
Thank you.
DavidNewell
-
MA Rodger at 07:33 AM on 9 August 2013How much will sea levels rise in the 21st Century?
jja @29.
I gave up on my arithmetic decades ago. However I use the following conversion between global energy imbalance in ZJ pa & W/m^2:- 1 ZJ pa = 0.062 W/m^2. So with one exception, I am in accordance with your calculation in the second paragraph @29.
I do take exeption to your value for the TOA imbalance. It looks like you have used the figure (or more correctly 'a figure' as it is not well defined) for the "present" net anthropogenic forcing, that is the change in such forcing since pre-industrial times. As that forcing has now resulted in significant warming (thus increasing outgoing radiation), the remaining imbalance is a smaller value. That value is given by Hansen & Sato as 0.58 W/m^2 for 2005-10 (although this is another figure that is not well defined) which would thus equal 9 ZJ pa. (The annual change in OHC would comprise the majority of this figure and can be used to add a certain robustness to the value. Adding 10% to the 0-2000m figure to account for warming below 2000m and a further 10% for surface/atmospheric warming, and so using Levitus (graphed here) over the last half decade, that yields 7.5 * 1.2 = 9ZJ pa. That's spooky!)
From the bottom paragraph of the PIOMAS page, the energy required to melt 1 cu km of ice can be obtained and so to melt 360 cu km & produce 1mm SLR requires 0.109 ZJ. THus energy to melt ice for 50mm SLR = 5.5 ZJ significantly more than half the global imbalance derived above.I'm afraid that the numbers you present within the following paragraphs @29 are not at all to my liking. The 80%AF by 2100 which you appear to take from fig 5 of Terenzi& Khatiwala 2009 is entirely bizarre. I don't even recognise the AF data prior to 2005 in that graph and given the other 2100 values derived within the paper, explanation is surely required for such a high value. And within the paper, the derivation of the 80% remains undiscussed outside section 4.2 which tends to rather deflate its usefulness.
The "TOA" numbers (again) look like forcing not imbalance. ECS (4.3 and 2.3 are both currently valid estimates) is not required for the calculation of future global imbalance. Imbalance is a matter of how much of the forcing is equalised by increasing temperatures, not per se the actual temperature required to achieve equalisation. Factoring in fast feedbacks (reduced arctic albedo) extend the life of the imbalance rather than increase the imbalance. Slow feedbacks which would include CO2 emissions from melting permafrost and hydrate methane ("Slow feedbacks?" some might ask.) are less easily accounted for but being themselves subject to speculation perhaps take this far enough off to make such lengthy discussion off topic.Heaping worst case upon worst case does have its limits. If anthropogenic forcings are increased high enough, we will surely reach a point where 5m SLR pa is possible. But I would suggest that with such a level of forcing/imbalance, SLR would not be a primary bringer of doom.
The one caviat here is the mass launching of ice bergs (your final factor) which do not need to melt to create SLR, but that 'speculation' should revolve around potential sources of such a launching.
-
deweaver at 07:21 AM on 9 August 2013Ocean Acidification: Eating Away at Life in the Southern Ocean
Rob,
From OA not OK: "The concentration of calcium in seawater doesn't change much with depth or location. This is because it has only one main source (the weathering of carbonate rocks) and, because weathering is slow, the ocean is well mixed in terms of the time scale for supply of calcium by weathering. But, as we have said, the relative concentration of carbonate species and the concentration of total carbonate species does change with depth. This is true even without a human influence".
However you say: "Significant global-scale alterations (in Ca) depend on the rate at which calcium is expelled by volcanic activity and, therefore, vary substantially only at million-year time scales (Montañez [2002], Stanley [2006])".
A quick analysis indicates that weathering is probably the main factor and volcanic activity, especially sulfur and CO2 emissions make the OA problem worse. Nothing like a little H2SO4 to decrease the alkalinity of the seawater.
You are correct, a true description of the problem is boring, but if you don't want to operate at the level of a “true believer” such as religious fundamentalist (with invincible ignorance), we have to utilize the boring and make it interesting. The scaling of pipes and fizzing of soda in the mouth are my, clearly limited and inadequate, attempts to tie a boring subject to the common observable world and make it interesting.
-
Rob Painting at 06:12 AM on 9 August 2013Ocean Acidification: Eating Away at Life in the Southern Ocean
John Bruno - even within the scientific literature the term 'keystone species' has taken on a broader definition than described by earlier work. It can include prey species, such as the Antarctic pteropod, under this broader definition. I don't doubt for a minute that ecologists/biologists still commonly use term in the way described by zoologist Robert T Paine. Picking nits here I reckon.
Joel Huberman - See the Royal Society Report (2005) hyper-linked in the blog post. Experience tells me that including equations is a major turn-off for readers. The Royal Society Report is a very easy read for those wanting to delve into this a bit deeper.
Deweaver - If I wrote as you have suggested I would simply bore readers to tears. The OA not OK series (button near top left of page) deals with this topic in more detail, and is written by experts on ocean chemistry. Readers wanting a bit more depth can simply read through the enitre series.
Rockytom - the brackets denote that the shells are made of chalk, not that all calcium carbonate is chalk. Will look at tweaking that.
-
scaddenp at 05:58 AM on 9 August 2013Ocean Acidification: Eating Away at Life in the Southern Ocean
deweaver - see the very large series on "OA is Not OK" (button on top left under the thermometer) or here for the first article in the series. It certainly deals with the physical chemistry aspects.
-
Leland Palmer at 05:52 AM on 9 August 2013Toward Improved Discussions of Methane & Climate
Even if there are a series of past mass extinctions associated with carbon isotope excursions suggestive of massive methane release from the hydrates, there is still the question of rate- how rapidly did these events occur?
Here's a paper from a location in China, which has a particularly high resolution stratigraphic record of the PETM.
Their calculated duration of the first large probable methane release during the PETM?
Less than 210 years:
The δ13C record from the Nanyang Basin thus represents the highest resolution PETM record available to date, thus facilitating detailed investigations into the PETM event. In the Nanyang record, the PETM was triggered within a 2 cm interval, indicating that its onset occurred in less than 210 years. This favors the hypothesis that the PETM was caused by a massive release of methane hydrate (δ13C =–60‰) from the continental slope. Other hypotheses for carbon release, such as decomposition of rich organic sediments, burning of peat land and tectonic processes, would have led to a slow carbon release rather than a rapid emission.
The authors go on to discuss various explanations for the initial carbon isotope spike triggering the PETM, including global warming, but conclude that a catastrophic event such as a massive earthquake and submarine landslide must have been responsible for the initial massive release. Magmatic intrusion from flood basalt eruptions might also qualify as a catastrophic event. They do discuss the subsequent further slow decline in C13 ratios, and say that that slower decline may be due to subsequent methane release from the hydrates stimulated by positive feedback.
But, there were a subsequent series of hyperthermal events, after the PETM, as discussed by Hansen. Those events apparently associate with orbital changes and so with orbital driven global warming.
Were those subsequent hyperthermal events also due to catastrophic events? This does not seem very likely, to me- that a series of catastrophic events timed to orbital cycles would occur.
This subsequent decreasing series of smaller hyperthermal events appears to be tied to orbital changes in insolation, and so to global warming.
So why did orbital variations in insolation trigger this declining series of probable methane hydrate releases?
Perhaps there was a shallow region of permafrost bound hydrates near one of the poles, capable of being triggered by global warming... perhaps like our own East Siberian Arctic Shelf (ESAS).
-
jg2013 at 05:32 AM on 9 August 2013There is no consensus
My wife's good friend teaches 6th grade in San Diego, California. A few days ago she told me she covers "global warming" in her class but emphasizes there's no scientific consensus and explained to me her understanding of the issue, which basically mimics the fox news disinfo. She's otherwise a liberal-minded person.
She's actually teaching the disinfo to her 6th grade classes and has been for years.
I rebutted her misconceptions but she had read a lot of bad info on the subject and wasn't receptive to my points over dinner. She let me install the Skeptical Science app on her iPhone, though.
My point in posting here is that I'm alarmed that school teachers are spreading misconceptions in the guise of preaching "both sides of the issue because every issue has two sides," as if both sides are correct or unprovable or convincing. Some global climate change group needs talk to teachers in the san diego public school system.
-
jja at 04:43 AM on 9 August 2013How much will sea levels rise in the 21st Century?
MA Rodger @24
my comments @23 was a restatement of 16 and in response to you @19 when you said, "To melt enough ice to achieve 50mm SLR p.a. would require roughly 5 ZJ p.a. which is not far from the entire energy imbalance today at the TOA"question: (are you sure your math is right here?) There are approximately 2,712,096,000 seconds between now and 2100 and the TOA is about 1.7W/m^2 at the tropopause (5.14E14m^2) which yields about 2.35 X 10^24 joules of total extra energy between now and 2100 at current TOA) or 2,350 Zj at todays imbalance.
in my scenario above I was showing that even without carbon feedbacks, the expected AF was going to go to .8 which means that additional increases in emissions will contribute significantly more to the atmospheric burden than the same incremental emissions in past years. Even without the feedbacks that I had mentioned in 23.
With the feedbacks that I am mentioning in 23 the TOA will be closer to 5 W/m^2 by 2100 and may be as high as 7.5. This is without a potentially catastrophic arctic methane release. In addition, the arctic albedo change will produce a direct heating of the greenland ice sheet. Finally, using the correct ECS value of 4.3 not 2.3 we will find an atmospheric warming effect that will produce average global temperatures of closer to 8 C by 2100. This is, still, without arctic catastrophic methane release.In this enviornment we can easily see 5M of sea level rise, or even 21 meters if ice shelf collapse occurs.
-
heb0 at 04:28 AM on 9 August 2013Fox News found to be a major driving force behind global warming denial
I suggest that, if Volponoca wants to engage in worthwhile covnersation related to the topic at hand, he obtain more of a focused approach and less of one that resembles a drive-by attempt to inflame discussion.
Moderator Response:[JH] Your observation is spot on. All of Volponoca's posts have been deleted because they violated three activites prohibited by the SKS Comments Policy, i.e., trolling, sloganeering, and excessive repetition.
-
rockytom at 04:02 AM on 9 August 2013Ocean Acidification: Eating Away at Life in the Southern Ocean
Rob,
In the second bullet of your post you say "...make their shells of calcium carbonate (chalk)..."
Most readers of SKS are sophisticated enough to know that all calcium carbonate is not chalk, but some may not be. Therefore, the use of chalk in the second bullet may be misleading. Also, it could be made clear that pteropods are small gastropods (being really nitpicking).
Otherwise, thanks for an informative post. I need to brush up on my kinetics and non-equilibrium chemistry.
Tom
Prev 849 850 851 852 853 854 855 856 857 858 859 860 861 862 863 864 Next


