


 Arguments


Recent Comments
Prev 855 856 857 858 859 860 861 862 863 864 865 866 867 868 869 870 Next
Comments 43101 to 43150:
-
Dikran Marsupial at 02:43 AM on 30 July 2013An accurately informed public is necessary for climate policy
Barry Woods, just of out of interest, how should the tweet have been worded (keeping to 140 characters or less and including the link to the article)?
As SkS has discussed the various misinterpretations of the 97%, while Obama's tweet may not have been explicitly discussed, I don't think it is fair to say that anybody reading the discussion on SkS (with a reasonably open mind) would say that the error itself had not been addressed.
Life is too short for pedantry and nit-picking, especially if it is only a means to avoid acceptance of what the TCP does actually show, i.e. that there is a broad concensus amongst scientists working on climate-related science that the majority of climate change is anthropogenic.
-
ralbin at 02:39 AM on 30 July 2013An accurately informed public is necessary for climate policy
Hulme's comments are, well, naive, at least from the point of view of someone living in the USA. The nature of our political system makes it relatively easy for relatively small interest groups to obstruct reform efforts. Building substantial, and not merely majority, support for reform efforts is often necessary to overcome special interest group lobbying. On an issue like this, where the opposition has considerable financial resources and is supported by the leadership of one of our major political parties, public opinion has to shift a lot to have a measureable effect. Unlike Prof. Hulme, the professional politicians and conservative media who constitute the shock troops of denialism in the USA recognize this fact clearly and devote quite a bit of effort to obfuscating the truth to prevent a public opinion shift of this type. He should spend a few days in the USA watching TV ads from fossil fuel companies.
-
DSL at 02:36 AM on 30 July 2013An accurately informed public is necessary for climate policy
Actually, I'd support Barry's suggestion for a correction, but only for the sake of not giving the intentional misinformers something to use. The President's twitter only misinforms the public where that paper is concerned. The overwhelming majority of those who follow BO's twitter will never read the paper and may not even realize that the consensus is associated with a particular paper. I'd argue that the twitter was read by most as a representation of the science rather than an extremely short summary of a single study. As a takeaway representation of science, the tweet is accurate: rapid global warming is creating conditions which are dangerous to conditions that support human prosperity at its current standard. Yes, the term "dangerous" needs defining, but that's twitter -- it's only a progressive tool when those engaged have the time, energy, training, and/or motivation to follow up and think critically about the issue.
-
Barry Woods at 02:18 AM on 30 July 2013An accurately informed public is necessary for climate policy
actually - the authors celebrated the tweet rather than correct the 'misinformation' made in to the public aboutthe papers findings, which was widely further reported to the media. Something I would hope all scientist would be concerned about (Prof Richard Betts was..)
a big 'nit'
-
Bob Lacatena at 02:10 AM on 30 July 2013An accurately informed public is necessary for climate policy
Barry,
So your particular nit is that the paper's authors didn't correct the President of the United States (or, rather, those who manage his twitter feed) for the exact wording of a tweet?
And for that you need a page long diatribe?
Sort of sums it up. You don't care about the consensus, or the state of climate science, what we know, and what scientists really think.
You only care about playing word games.
Welcome to the world of denial.
-
Barry Woods at 01:49 AM on 30 July 2013An accurately informed public is necessary for climate policy
I would like to thank Nottingham University's Making science Public project for running some very interesting articles, the comments there are I think worth a read. But perhaps this is the best place to raise this question?
Lets look at the media coverage that Skeptical Science is so proud of: http://www.skepticalscience.com/republishers.php?a=tcpmedia
especially this one:
Barack Obama
@BarackObama Ninety-seven percent of scientists agree: #climate change is real, man-made and dangerous. Read more: http://OFA.BO/gJsdFp
Now whatever the paper did, it made zero reference to impact, or any consensus on impacts and there is no justification at all - based on this paper - for a 97% consensus of ‘dangerous’ to be declared a finding of it, did the authors seek to correct this in anyway, no they celebrated it by listing it on their blog, with a link to President Barack Obama.
Professor Richard Betts (Head of Climate Impacts, Met Office and IPCC lead author AR4 & AR5) sought to correct it, by tweeting back:
Richardabetts
@BarackObama Actually that paper didn’t say ‘dangerous’. NB I *do* think #climate change poses risks – I just care about accurate reporting!
Maybe John Cook was not aware of President Barack Obama misrepresenting and overstating this paper, when he said (or his official account did) 97% of scientists agree climate change is real man made and dangerous?
Sadly no. It appear that John Cook was surprised at all the attention and made no effort (nor the other authors) to correct this Barack Obama tweet (to 30 million people, or how it was widely reported else where in the media
Sydney Morning Herald: Obama gives Aussie researcher 31,541,507 reasons to celebrate
Read more: http://www.smh.com.au/environment/climate-change/obama-gives-aussie-researcher-31541507-reasons-to-celebrate-20130517-2jqrh.html#ixzz2aRpr8JPX
“Australian researcher John Cook, an expert in climate change communication, was inundated with requests for interviews by US media outlets after Obama took to Twitter to endorse his project’s final report.
“It was pretty cool news,” said Mr Cook, a fellow at the University of Queensland’s Global Change Institute and founder of the website skepticalscience.com. “It was out of our expectations.”
A survey of scientific papers by a team led by Mr Cook and published by Fairfax Media this week found more than 97 per cent of researchers endorsed the view that humans are to blame for global warming. The peer-reviewed outcome flies in the face of public perception in countries such as the US or Australia that scientists are divided on the issue.
“One of the highest predictors of how important people think climate change is, is cues from political leaders,” Mr Cook said. “So if the leaders don’t seem to care, people don’t care either.
“A cue from Obama is a big step,” he said. “The fact it goes to more than 31 million followers, it just raises the awareness of consensus.”
———————-
Awareness, a false awareness (courtsey of Obama) of a 97% consensus on 'dangerous', misinformation that is now in the public domain about this paper by the President of the United States of America , not corrected by the authors of the paper. An irony is that Prof Lewandowsky and John Cook have a paper published on how hard it is to correct misinformation.. !!! http://psi.sagepub.com/content/13/3/106.full?ijkey=FNCpLYuivUOHE&keytype=ref&siteid=sppsi
President Obama is now going after Deniers in Congress…. (thus this ishighly political, v dangerous for the public perception of scientists if 'misinformation' is uncorrected by scientists)
www. BarackObama.com
“Call out a climate denier
Check out our list of known climate deniers in Congress-elected officials who refuse to even acknowledge the science behind climate change—and call them out on Twitter.” http://www.barackobama.com/climate-deniers
So Dana, will you or any of your co-authors, tell the President, that your paper says nothing about a consensus on ‘dangerous’?
-
Dikran Marsupial at 22:00 PM on 29 July 2013Each degree of global warming might ultimately raise global sea levels by more than 2 meters
Earthling, the question asked in your first paragraph is essentially answered in the second paragraph of the article (the use of the word "ultimately" in the title of the post should also be a hint). The oceans have a massive thermal inertia, which means that it takes a long time for the oceans to warm sufficiently to come back into equilibrium with the surface. Thus the full sea level rise due to thermal expansion of the oceans will only been fully evidient after a delay of many decades.
The second of your paragraphs is just pedantry. "business as usual" is just the terminology used for the course of progress where no real attempt is made to curb fossil fuel use and instead exploit fossil fuels in the interests of rapid economic growth. "business as usual" seems as good a name for that as any.
-
Tom Curtis at 21:50 PM on 29 July 20132013 SkS Weekly News Roundup #29B
JvD @42, no they don't. (See, you're not the only one who can argue by mere assertion.)
If you want to actually argue the case, however, start by explaining why we should accept the assumption of EnergyNautics that demand shifting is limited to 10% of power. Continue on by showing why you are using a study on the infrastructure costs of interconnecting Europe for renewables arising from peak energy demand in the middle latitudes (Germany, France) with peak energy production at the limits of the system (Norway for wind, Spain for solar) when your initial argument was renewables require unrealistic grid costs due to intermittency (a different issue entirely).
-
JvD at 20:15 PM on 29 July 20132013 SkS Weekly News Roundup #29B
Tom Curtis wrote:
If electrical cars become common, use of the same tarrif structure to encourage recharging from intermittent power would almost eliminate the need for substantially increased levels of renewable supply. Altering feed in tarifs so the gave a greater financial reward for using power in site at time of production rather than minimizing daytime usage (as the current feed-in tarif does) would also reduce the costs.
Please study the Poyry and EnergyNautics studies linked to above, which lay waste to your claims.
-
JvD at 20:10 PM on 29 July 20132013 SkS Weekly News Roundup #29B
For your benefit, here is the important, Greenpeace-commissioned, study by EnergyNautics, which explains very clearly that most of the claims put forward by pro-intermittent renewables proponents are pure bunkum:
www.energynautics.com/downloads/competences/energynautics_EUROPEAN-GRID-STUDY-2030-2050.pdf
Here are the important conclusions. Note that these conclusions will not be found anywhere on SkS. In the past, I have urged SkS administrators to do justice to these crucial conclusions, but to date nothing has happened on this front. Here are the main points:
On the need for dramatic increase in spending on electricity transmission (spending which is totally ignored by all pro-intermittent renewables proponents):
The grid will need to transfer large quantities of mainly solar energy from southern countries such as Spain, Portugal and Italy, and simultaneously bring wind energy southwards, requiring a North Sea offshore grid.
On the usefullness of Demand Side Management and EV batteries for improving the performance of an intermittent renewables energy system (which is an utterly false claim put forward by all intermittent renewables proponents):
The DSM levels did not create significant differences to the grid infrastructure required in 2030, or the amount of CO2 emissions mitigated. With the implementation of storage mediums and EVs, the impact in reducing the amount of curtailed energy was minimal, unless unrealistically large quantities of storage are placed at unique points within the system.
Intermittent renewables proponents frequently claim that distribution infrastructure does not need to be upgraded in order to accommodate intermittent renewables, and therefore, distribution costs - let alone new investments - should not be calculated or included in the cost of intermittent energy generation. EnergyNautics makes mincemeat of this egregious nonsense:
The distribution network. Distribution is not explicitly assessed in this study. However, it will need to be upgraded to provide an adequate interface between the new, decentralised renewable generation and the transmission system, as well as the consumption.
On the cost of grid upgrades in Europe, required to meet 97% of electricity with renewables, Energynautics shows that these cost are not 'negligeable' as all pro-intermittent renewables would maintain:
The 2050 grid to meet the Energy [R]evolution scenario compared to the current grid in 2010 requires between 1421 and 2951 GW of network upgrades. The costs fall between 149 and 679 billion euros, corresponding to the regional scenario and import scenario evaluated in this section. It should be kept in mind that the regional scenario relies on a heavy increase in installed capacity of new generators such as solar PV, wind and biomass within Europe. Of course, the costs of installing extra generation capacity may be far beyond the discrepancy between the two grid costs evaluated here.
So even excluding the severe costs of building the PV and wind generating stations themselves, europe will need to spend hundreds of billions of euro's on grid upgrades alone.
Anyway, I urge everyone to read and understand this report. It wasa commissioned by Greenpeace itself, so it is not possible to dismiss this report as non-Greenpeace propaganda. It is a serious matter. These costs will arrive out of the blue for european citizens, since no proponent of intermittent renewables is warning them in advance. To the contrary. In my work, when I present these results, I frequently get told that we can pay for these costs by reducing the 'subsidies' on fossil fuels! And thusly, the story comes full circle! By (falsely) thinking that there are billions of dollars of 'fossil fuel subsidies' in Europe, decision-makers in europe think that there is billions of dollars of cash waiting to be 're-allocated away' from fossil fuels to renewables! This is nothing but excruciating nonsense, and it pervades thinking about sustainability on all levels. We have a lot of work to do to dispell such nonsense. I hope some who read this will join in and help remove it.
Specifically, I hope SkS will devote some space to addressing these important questions, whereas today it does nothing. To the contrary, the pages on SkS that address 100% renewable scenario development gloss over and marginalise these serious issues. In the past, I have tried unsuccessfully to correct this. I notice some of the same commentators in this thread were active at that time, also to deny my evidence and conclusions then. I hope this will stop someday, so we can work together to stop fossil fuel hegemony and climate change once and for all. Thank you.
-
Tom Curtis at 19:34 PM on 29 July 20132013 SkS Weekly News Roundup #29B
JvD @38, one engineering solution to the problem of intermittency requires massive increases in transmission infrastructure. Others do not. In particular solar thermal plants solve the intermittency problem for solar with no requirement of extra transmission infrastructure at all. Other means of storing energy for later use (eg, pumped hydro) also restrict the need for increased infrastructure. Further, simple changes of social habits or building designs can exploit energy at the time of its production rather than later, again obviating the need for increased expenditure of transmission. In Qld and the moment, for example, there is a special rate for power in appliances that only use them in off peak (ie, night) time. This is used primarilly for heating water. Switching that to a special rate for power to heat water that is only provided when there is excess capacity from intermittent sources would significantly reduce the need for expanded tranmission infrastructure in Qld. If electrical cars become common, use of the same tarrif structure to encourage recharging from intermittent power would almost eliminate the need for substantially increased levels of renewable supply. Altering feed in tarifs so the gave a greater financial reward for using power in site at time of production rather than minimizing daytime usage (as the current feed-in tarif does) would also reduce the costs.
It is your tendency to portray engineering issues as IRRESOLVIBLE PROBLEMS (in capital letters) that makes it hard for me to take you seriously.
-
Earthling at 19:24 PM on 29 July 2013Each degree of global warming might ultimately raise global sea levels by more than 2 meters
If each degree of global warming is likely to raise sea level by more than 2 metres in the future, why did the 0.75º C global temperature rise of the last 100 years only cause 21 centimetres of sea level rise, less than one tenth of 2 metres?
And why do so many people mention "Business as usual," when no such thing has ever existed in the history of our ever changing human society?
-
JvD at 19:21 PM on 29 July 20132013 SkS Weekly News Roundup #29B
scaddenp wrote
You are avoiding the main question here. I assume that you do in fact agree that removing price support will result in energy cost of FF fuel go up? And that this will make renewables cheaper? And that higher cost of FF will result in less consumption? If you agree with this, then removing these forms of price support will be an effective means of reducing CO2 emissions.
There is no 'price support' in Saudi Arabia, or other oil producting countries. Since the oil age began, they have been supplying their populations with energy at the cost of production. Should they now choose to add 600% domestic taxes to that energy, - in order to equal the international market price of energy - this will reduce co2 emissions only to the degree that their citizens become unable to obtain energy. Whatever the percieved benefits of this for the Saudi population or the world, such a move will do nothing to improve the competitiveness of intermittent renewables across the wider space of UN member countries. Absolutely nothing. (-snip-).
Now, you are free to call it a 'mistake' on the part of Dr. Romani if you would choose to do so. But I know better, since the issue of countries like Saudi Arabia supplying their own citizens with energy priced at cost is not a new phenomenon. In fact, the most important study on this issue - the joint OECD/World Bank,OPEC,IEA report I linked to above - clear lays out this situation. (-snip-).
(-snip-). Whether Saudi Arabia raises taxes on domestic energy will have no impact at all on the competitiveness of intermittent renewables within UN member nations. It is a purely a domestic tax issue for Saudi Arabia. It has no wider international significance.
Moderator Response:[DB] Multiple inflammatory snipped.
-
JvD at 19:00 PM on 29 July 20132013 SkS Weekly News Roundup #29B
CBDunkerson wrote:
Granted, transmission distance is generally going to be much less for rooftop solar than traditional centralized grid power and the transmission infrastructure is already in place so there isn't really any significant additional cost to transmit rooftop solar power over it. However, the more rooftop solar power is generated the less money the power companies make. At a certain point this would impact their ability to maintain the power grid and thus impact costs to people receiving transmitted solar generated power. You can't go 100% solar (or even 50%) without adding in some cost for distribution and/or storage.
You are almost correct. What is missing here is the understanding that switching to 100% intermittent renewables will always add very strongly to transmission and distribution cost. We can look at Germany and Denmark for a real-life example. Both countries are about 20% switchted to intermittent renewables, and already they are forced to invest billions in additional transmission and distribution infrastructure that would not be needed if they maintained baseload power generation. As these countries move further to achieve the required 95% reduction in co2 intensity of power generation, the additional cost of transmission and distribution will balloon exponentially.
Why? It has to do with the much hyped 'feature' of intermittent energy sources that their intermittency is said (by their proponents) to "even-out" as they are spread geographically. In other words: if there is a lot of wind in the north of Europe while there is little wind in the south of Europe, the excess wind generation in the north can be transmitted to the south, and vice versa. Obviously, in order to benefit from this geographical spread, you need many GW's of additional grid infrastructure that would otherwise not be necessary. This cost is not paid for by the wind farm owners.
(-snip-).
(-snip-).
(-snip-).
http://www.poyry.com/sites/default/files/imce/files/intermittency_-_march_2011_-_energy.pdf
For example, poyry concludes difinitively (page 4):
Wind and solar output will be highly variable and will not ‘average out’
(-snip-).
Moderator Response:[DB] Inflammatory snipped.
-
Riduna at 10:21 AM on 29 July 2013Each degree of global warming might ultimately raise global sea levels by more than 2 meters
The Potsdam press release is full of generalities and too imprecise for critical review but it may be worth noting that it refers to global warming – average or surface is unstated – rather than Arctic amplification combined with increasing penetration of warm ocean currents. Both have an effect on the rate of mass loss from ice sheets, the degradation of permafrost and, in the Arctic, the release of carbon from onshore and continental shelf deposits. Obviously the latter will increase temperature amplification, speeding up the loss of land based ice in the Arctic.
That effect is not likely to occur in the Antarctic where methane deposits lie beneath massive ice sheets and lower temperatures are maintained by stratospheric ozone depletion and insulating circumpolar winds. Even time scales referred to, “several millennia”, are too broad to be meaningful or permit comment on the finding that an increase of 1°C in global temperature = 1 metre sea level rise. That broadly accords with the findings of others, as does an estimated 2100 average global surface temperature 4°C-6°C above the preindustrial, assuming business as usual. However, the admonition that we must prepare to “adapt” is nonsense.
Average global temperature is very likely to exceed 2°C by 2050 and at least twice that by 2100, even if we make strenuous efforts (very unlikely) to reduce CO2 emissions to zero by 2080, as currently proposed. If the findings of Levermann et al are largely correct (a big if), try “adapting” to 4 metres sea level rise and extreme wind events causing tide surges which take actual sea level rise to 6 metres or more.
-
Andy Skuce at 08:12 AM on 29 July 2013Update on BC’s Effective and Popular Carbon Tax
JasonB@36
You are correct about the Washington gas prices being higher in border towns than in Seattle. The last time I looked, a couple of days ago, the USD per gallon prices in border towns were: Sumas $3.91; Blaine $4.07 and; Point Roberts $4.69 (cut-off by direct road link to the rest of the US). Seattle prices were $3.55. All of which goes to show that American retailers know how to take a profit on the other side of an arbitrage opportunity.
The cross-border gas price problem also points to the limits of unilateral carbon taxes in the context of free trade. Border tarriff adjustments will probably be needed eventually if one side of a trading partnership adopts a carbon tax and the other does not. My understanding is that this might be allowed under WTO rules (unsurprisingly, legal opinions differ), but that this would not be allowed (or practicable) under NAFTA, the N American free-trade agreement.
I agree that part of the relative increase in BC cross-border shopping is due to the proximity of the border and the toll-free ease of crossing it. All of the Southern Ontario border crossings involve bridge tolls. It would be interesting to see what happened to cross-border traffic if a border-crossing fee were to be imposed by the US government. It is unkikely that this will happen, due to pressure from US merchants in northern border states.
Tom@35
I appreciate you making those corrections. Thanks!
-
s_gordon_b at 04:19 AM on 29 July 20132013 SkS Weekly News Roundup #30B
The trendy meme that we can have our steak and save the planet too (your link above to "Can Agriculture Reverse Climate Change?") seems to be more or les entirely based on the claims of biologist Allan Savory, with cheerleading by Michael Pollan and others. But his extraordinary, counter-consensus claim hasn't held up to scientific scrutiny: Why Allan Savory’s TED talk about how cattle can reverse global warming is dead wrong. It would be nice to see an SkS item on this (it would seem) myth.
Moderator Response:[RH] Hotlinked URL that was breaking page formatting.
-
dvaytw at 02:47 AM on 29 July 201316 years - Update and Frequently Asked Questions
Hey guys - the "16 years" video is now locked as "private". What gives?
-
JasonB at 01:33 AM on 29 July 2013Update on BC’s Effective and Popular Carbon Tax
Thanks for the update, Tom.
I'm a little curious how you attributed the increase in border crossings to carbon tax vs exchange rate changes.
An interesting anecdone: I remember talking to a couple we met on the street one evening in Vancouver in 2011 who happened to mention, laughing, that they actually drove across the border to fill up (we'd been discussing how weird it is to live so close to another country — it takes three days of driving just for me to leave my home state!), but in doing so they also pointed out that they lived in the south of Vancouver so it wasn't far to go. They also failed to mention anything about the carbon tax (I didn't even know they had one until reading about it on SkS) and indicated that the'd been doing it for a long time.
It surprises me that a 7c/litre tax would dramatically increase the number of people for whom the trip would be worthwhile; it has always been worthwhile to fill up on the way home to Canada, but to make a special trip just because the fuel is cheaper? On the other hand, I recall the Canadians were very chuffed at the time (or possibly during the 2009 trip, I forget) about the appreciation of the C$ against the US$, and that I can imagine being a big driver in making cross-border shopping trips a lot more worthwhile, especially since domestic prices in the US seem to be almost completely immune to exchange rate fluctuations.
I can see that you're comparing BC with other provinces, but I wonder if that could simply be due to the very close proximity of the major population centre to the border making those cross-border shopping trips relatively more attractive to a larger percentage of the population vs other provinces?
Regarding the historical fuel price comparisons, you probably need to focus on prices at petrol stations close to the border; I doubt anybody would go all the way to Seattle just to get fuel and I expect the price of petrol will rise the closer the station is to the Canadian border.
Just in case you (or Russ) has got nothing better to do. :-)
-
Tom Curtis at 00:12 AM on 29 July 2013Update on BC’s Effective and Popular Carbon Tax
It turns out that I have made a number of mistakes over the last few days. One I will attribute to tiredness, and the folly of doing analysis as an attempt make insomnia more profitable. The second I will attribute to my unfamiliarity with foreign exchange. In either case, the mistakes are substantive so everything I have written in this thread up to this point should be disregarded, and I apologize for having inadvertently mislead anybody, or for any confusion I have created.
The first mistake I will adress is the most recent. It arose because I confused the symbol USD/CAD as US dollars per Canadian dollar, whereas in forex it has the meaning (apparently) US dollars exchanged to Canadian dollars, ie, the inverse of that which I took it to be. Therefore the chart in post 34 should be as follows:

Clearly the trend in the fuel price difference is rising, and by 6c US per gallon per year. The trend rised faster prior to the introduction of the Carbon Tax (12.7 c per gallon per annum, Aug 2005-Dec 2007) than after (6.9 c per gallon per annum, Jan 2010 to current). Taking the trend from the actual introduction of the carbon tax reduces the trend to 1.8 c per gallon per annum, but that is due to the large spike at the beginning of the period which may be in part an aberration due to misalignment introduced by the digitization process. Regardless, the price differential over the last 12 months was 26.9% higher than that in the 12 months immediately preceding the introduction of the carbon tax, something that would certainly encourage more frequent cross border trips to refuel, and in particular more frequent last stop refueling when returning from the US for other reasons. Therefore, contrary to all that I have said prior to this post, this data definitely supports the contention that there is likely to have been substantial carbon leakage from BC to Washington state.
The second mistake is that pointed out by Andy Skuce @29 above. I'm not sure that mistake is the best word, for I am still convinced my analysis shows that a major cause of relative change in cross border trips is common across all provinces of Canada except New Brunswick (which clearly has a superimposed substantial negative trend). However, by not examining the absolute figures I missed germaine additional information.
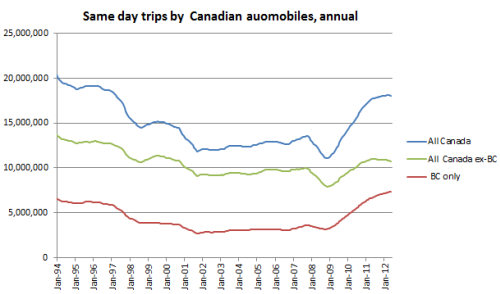
First, consider the absolute anomaly in one day road trips to the US across several key provinces:
One thing this shows clearly is that Canada minus British Columbia, when it comes to one day border crossings, essentially just means Ontario. That is not surprising given that they rank third and first in population respectively, and both have major centers of population very close to the US border. Quebec is unusually low in border crossings, but given the francophile nature of quebecoise culture, that is probably not surprising.
More interesting is the anomaly data relative to the period preceding the introduction of the tax, and scaled by SD prior to that introduction:
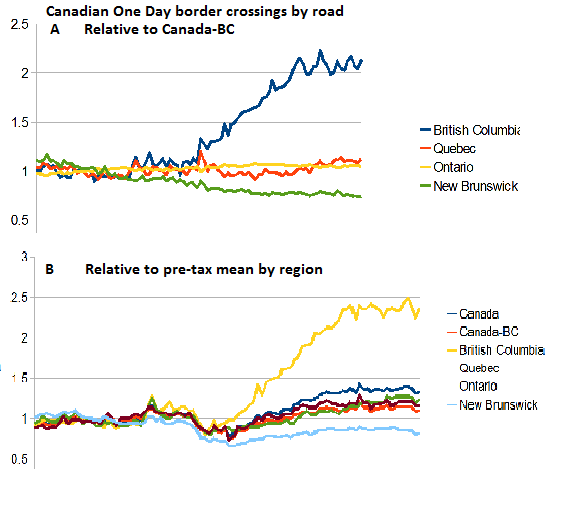andpretaxmean(b).png)
Just to be quite clear what has been done here, section B of the graph shows each data series (Canada, BC, etc) divided by the mean of that data series from June 2005- June 2008. By doing so, we convert the absolute figures into a direct index of change relative to the pre-tax era. It turns out that BC one day road border crossing have increased by 135.8% (mean of the last twelve months of data) relative to the pre-tax rate of crossings. Section A of the chart then normalizes the data of section B by dividing by the value for Canada less BC. The normalized data for BC shows an increase 2.08 times the rest of Canada (last twelve month mean), showing that approximately half of the cause of the increase is BC specific.
Finally, here is the individual reagional data baselined from June 2005-June 2008, and divided by their standard deviations over that period. It is important that this not be misunderstood as indicating the size of the change. Rather it indicates the size relative to previous variation. The very high values for BC are a factor of the large (150% increase) and the relatively small variation pre-tax.

The very large (13.8 Standard Deviations mean over the last twelve months) indicates clearly that the 150% increase in vehicle crossings is not down to random factors. It has a cause, and the dominant factor, responsible for at least 50% of the increase, is likely to be the Carbon Tax.
For comparison, I have also included the exchange rate data which shows that it is the dominant factor prior to July 2008, but of secondary (or even tertiary) importance thereafter.
So, in summary:
- The introduction of the BC carbon tax was followed by a marked (150%) increase after July 2008.
- Approximately fifty percent of that increase is likely attributable to the carbon tax, with rest of the increase attributable to some combination of national factors, similar factors between Ottawa and BC, or coincidence of unlike causes between Ottawa and BC.
- It is at least possible that the majority of the additional effect is also attributable to the carbon tax, with different factors in Ottawa causing a similar rise and thereby concealing the influence of the carbon tax.
- Exchange rates remain a significant influence. At a minimum it would account for about 10% of the BC increase, but may account for as much as 50%.
Once again I apologize for my errors, and in particular I apologize to any body who was mislead by them. I further apologize to Russ, whose understanding of the situation has been clearly vindicated. I further withdraw my claims regarding the CTF and CTV BC, which are not justified on the evidence I now have. I to maintain, however, that my comments about the necessity of analysis for justifying an argument is correct. It is, admitedly, much less embarassing, however, when you get that analysis right.
-
michael sweet at 23:38 PM on 28 July 2013A tale told in maps and charts: Texas in the National Climate Assessment
Ray,
Hansen (summarized here) has estimated from data that approximately 98% of heat waves have been caused by AGW. While there is still scientific discussion about the exact proportion of heat waves caused by AGW, your "primarily to natural variability as was the Russian heatwave in 2010" is certainly not a consensus statement. While Hansen's data applies to hot summers and shorter heat waves like Russia's are not directly applicable, it seems reasonable that if 98% of hot summers are caused by AGW, most short term heat waves are also due to AGW. AIR, Ramsdorf estimated an 80% chance that the Russian heat wave was caused by AGW, hardly "primarily natural variability". This is an area of active research. I note that in the past scientists have been conservative in their estimates. It will be interesting to see the conclusions in the next IPCC report.
Grindup: you have not counted the cooling caused by aerosols in your calculation. When coal use declines, the aerosol cooling effect will decrease. The exact cooling caused by aerosols is poorly estimated, but is likely around .5C. That needs to be added to the heat in the pipeline.
-
bouke at 19:49 PM on 28 July 2013Each degree of global warming might ultimately raise global sea levels by more than 2 meters
Indeed. The idea that it takes 30 degrees of warming for the 60m of Antarctic ice to melt is too absurd to take serious. So, lets take a look at what the paper really says. In the abstract it is stated:
we are committed to a sea-level rise of approximately 2.3 m °C−1within the next 2,000 y
I'd guess the melting continues after 2000y. Perhaps, if you´d consider the first 4000y it would be 4m °C−1. So it seems to me the 2.3m number is rather arbitrary, dependent on how long you define ´ultimately´.
Although, In defense of the paper, they did call it ´multimillennnial´ sea level rise, and 2000y is the shortest timeframe that can be called so.
-
grindupBaker at 18:41 PM on 28 July 2013A tale told in maps and charts: Texas in the National Climate Assessment
@Me#6 typo: Dr. David Randall.
-
grindupBaker at 18:40 PM on 28 July 2013A tale told in maps and charts: Texas in the National Climate Assessment
@william #5 Dr. James Hansen says his best estimate with feedbacks for CO2 doubling is +2.8 Celsius (climate sensitivity) and Dr. Davis Randall says +2.4C. 400ppm is 52% of CO2 doubling assuming steady feedbacks, so that's +1.3 to +1.5C. I recall somebody (maybe Dr. Kevin Trenberth) saying "another 0.5 degrees in the pipeline" so that fits with +1.4C if it is +0.9C now (I keep forgetting the base times). Apparently, +1.4C is a reasonable projection. The oceans are ~1,000 years behind land and air because of their mixing rates so it would generally stay somewhat below +1.4C for ~1,000 years, likely with little fits and starts like we've already seen because of variation in ocean mixing.
-
Synapsid at 15:30 PM on 28 July 20132013 SkS Weekly News Roundup #30B
On coal exports:
Good to see awareness that "...reason for concern that's off most Americans' radar: US coal exports...Yet these remote projects are not getting the attention they deserve..."
The US is the fourth largest exporter of coal in the world. If the three export projects are built in Oregon and Washington why, we can shoot for third place--maybe even second.
-
Alexandre at 10:52 AM on 28 July 2013Each degree of global warming might ultimately raise global sea levels by more than 2 meters
Considering temps and sea level by the Pliocene, I'd say in the long run it's significantly more than 2 m per degree.
-
Tom Curtis at 09:44 AM on 28 July 2013Scientists can't even predict weather
BillWalker, it makes sense if you substitute "be" for "result".
-
william5331 at 06:33 AM on 28 July 2013A tale told in maps and charts: Texas in the National Climate Assessment
I'm curious how much long term inertia is in the system. In other words, even if we held CO2 levels to 400ppm, what climate would we end up with when all the interlocking feed back mechanisms have worked their way through the system. Of course, in the mean time, we are heading at a little below 3ppm per year towards 500ppm. It's quite exciting if you are in to horror movies. When will we first see CO2 levels start to rise more quickly than we would expect from the level of our emissions.
-
chris at 04:22 AM on 28 July 2013A tale told in maps and charts: Texas in the National Climate Assessment
Good point Ray (#2). However one does need to be careful in assessing these very-difficult-to-attribute events especially based on single studies.
For example Rahmstorf, S., and D. Coumou (2011) Increase of extreme events in a
warming world, Proc. Natl. Acad. Sci. U. S. A., 108(44), 17905–17909 concluded that background global warming in Western Russia has increased the probability of extreme warming events by around 5-fold and explicitly contridict the conclusions of the Dole paper you cite in terms of the predictability of the event.Otto et al (2012) Reconciling two approaches to attribution of the 2010 Russian heat wave Geophys. Res. Lett., VOL. 39, L04702,doi:10.1029/2011GL050422, 2012, suggest that the two studies (Dole and Rahmstorf) are not necessarily in contradiction in that "the same event can be both mostly internally-generated in terms of magnitude and mostly externally-driven in terms of occurrence-probability" (easier to quote than to paraphrase!).
In other words global warming increases the probability of extreme warming events (this isn't controversial I think) such that we expect a greater probability of extreme weather (esp warming), even if a detailed local attribution gives the appearance of largely natural inputs.
It's worth noting that even 'though the Dole paper you cite indicates that natural variability doinates local inputs for the Moscow heatwave in their analysis ('though contradicted by the Rahmstorf study), Dole et al do warn that:
"Nevertheless,there is evidence that such warming has contributed too observed heat waves in other regions, and is very likely to produce more frequent and extreme heat waves later this century [Intergovernmental Panel on Climate Change, 2007]. To assess this possibility for the region of western Russia, we have used the same IPCC model simulations to estimate the probability of exceeding various July temperature thresholds over the period 1880–2100 (Figure 4). The results suggest that we may be on the cusp of a period in which the probability of such events increases rapidly, due primarily to the influence of projected increases in greenhouse gas concentrations."
-
Christopher Gyles at 03:50 AM on 28 July 2013A tale told in maps and charts: Texas in the National Climate Assessment
chriskoz, from Wikipedia a CDD seems to be approximately each one degree of external temperature above that which would maintain an internal temperature at a preditermined baseline (commonly 60°F or 65°F) without energy being expended on cooling. Wikipedia explains it in terms of degrees C, but I'm sure Texas' data would be in F°. The current annual average for Houston, according to ClimateZone.com, is 2700 CDD, so it appears that 2800 CDD would be an annual average also. I found some more accurate formulae for calculating degree days at http://www.vesma.com/ddd/ddcalcs.htm
-
Ray at 03:08 AM on 28 July 2013A tale told in maps and charts: Texas in the National Climate Assessment
I wonder if, in time, this heatwave in Texas will be put down primarily to natural variability as was the Russian heatwave in 2010 (Dole et al Geophysical Research Letters 2011) and the hot US summer of 2012 (Dole et al Bulletin of the American Meteorological Society 2013). It is fascinating to see the changes in opinion that the passing of time brings. For example Skeptical Science in 2012 ran this piece by Rob Painting
"An American Heatwave: The United States Glimpses its Hot Future" As indicated by the title the implication was that AGW rather than natural variability could be the causative culprit. That said, it is necessary to note that the 2010 paper by Dole was very fairly critiqued by Rob Painting. It still seems uncertain whether AGW or natural varability is the primary cause of extreme weather events but to discount either at this stage may be premature
-
BillWalker at 02:48 AM on 28 July 2013Scientists can't even predict weather
Editing problem in the Intermediate version.
I can't parse this sentence. Can you?
"Or expressing that in weather terms, you can't predict the exact route a storm will take but the average temperature and precipitation will result the same for the region over a period of time." -
chris at 01:57 AM on 28 July 2013The climate change policy discussion I wish Andrew Neil would have on BBC
Interesting Barry, thanks.
Curiously, Dan Kahan, who is also referred to on the blog thread you refer to considers that the "97% consensus" paper is:
"an elegantly designed and executed empirical assessment".
Like Hulme, Kahan is opinionating. However it is interesting that a study can be described as both "elegantly designed and executed" and "poorly designed and ...executed" by individuals who seem not to like it very much to the point that they're exercised to make public prononcements on it!
Obviously the "97% consensus" paper doesn't "depict... the world into categories of ‘right’ and ‘wrong’" at all, and no doubt Prof Hulme, were he to publish something in a scientific forum on this topic would make a more considered judgement than his blog comment you reproduced.
In fact we would all probably agree that the "97% consensus" paper is a comprehensive assessment of the scientific literature on the scientific consensus relating to the role of anthropogenic greenhouse gas release in the marked global warming of the last ~ 50 years.
Hulme's comments (assuming you've faithfully transcribed these) on the Anderegg PNAS paper, are similarly odd since that paper doesn't "divide.. publishing climate scientists into ‘believers’ and ‘non-believers" either. It divides publishing climate scientists into those that are convinced or unconvinced by scientific evidence on anthropogenic climate change (and assesses the apparent relative scientific expertise of these according to their publishing history).
It's almost as if Prof. Hulme would like to wish away the essential element of scientific evidence from these assessments and portray the deceit that this is all about "beliefs"! Any idea why he would take such an approach Barry?
-
Tom Curtis at 01:50 AM on 28 July 2013Update on BC’s Effective and Popular Carbon Tax
I notice that Russ R. is running through the same routine again. That is the routine in which somebody notices that something might be evidence against a particular view. They therefore conclude that it is evidence against that view without bothering with analyzing the data to find out whether conjecture is correct or not. It is a very efficient form of argument in that it leaves all the hard work of analysis to your opponents.
In this case Russ R has identified a factor which may have called into question price comparison data I have already presented. And yes, I accept his claim that international exhange is calculated only at current rates at pricebuddy. But granted that, depending on the pattern of exchange rates that could refute my claim, strengthen it or have no effect. Russ does not know, or at least shows no analysis to indicate one way or the other. The evident reasoning is that this new data may support my argument, therefore it must support my argument.
As it happens, I dislike people being mislead by my mistakes, so I looked into it. I had to download a digitizing program, convert the graph to monochrome so that the program would read it; digitize the data, find a table of exchange rates, and do the analysis. It took considerably more than twenty minutes and I can see why people would prefer to leach of the intellectual labors of others by presenting possibilities as conclusive evidence.
The data compares prices in terms of US dollars per gallon. Therfore I left US prices unchanged. Canadian prices where first divided by the current exchange rate (ie, the value in US dollars per Canadian dollar) to reconvert to original value Canadian dollars. They were then multiplied by the exchange rate to convert the Canadian dollar price into a (contemporary) US dollar price. If anything thinks I have done that wrong, please let me know.
The result:

The trend of the price differential is clearly downward. There is a large jump about the time of the introduction of the carbon tax, but it rapidly falls back to historical levels, and trends further down. The slight recovery at the end still leaves the price differential lower than in 2005.
-
Michaelf at 01:27 AM on 28 July 2013Murry Salby finds CO2 rise is natural
Thanks. Had not come across it before, read it, thought it was very similar to what Salby was trying to get published but couldn't, so was surprised to see those theories published. Probably because he left the question open about where the CO2 was coming from and did not answer the question of where our CO2 had gone. So before I had that argument I thought I would check over here. Glad I did :-) will go and do some reading.
-
Barry Woods at 01:02 AM on 28 July 2013The climate change policy discussion I wish Andrew Neil would have on BBC
Prof Mike Hulme's comment about the 97% consenus paper and the Ed Dvaey / Andrew Neil interview has caught a few blogs attention. Perhaps it would be best discussed here:
“Ben PIile is spot on. The “97% consensus” article is poorly conceived, poorly designed and poorly executed.
It obscures the complexities of the climate issue and it is a sign of the desperately poor level of public and policy debate in this country that the energy minister should cite it.
It offers a similar depiction of the world into categories of ‘right’ and ‘wrong’ to that adopted in Anderegg et al.’s 2010 equally poor study in PNAS: dividing publishing climate scientists into ‘believers’ and ‘non-believers’.
It seems to me that these people are still living (or wishing to live) in the pre-2009 world of climate change discourse. Haven’t they noticed that public understanding of the climate issue has moved on?” - Mike Hulme
——————————–
from this article at Making Science Public - Nottingham University
http://blogs.nottingham.ac.uk/makingsciencepublic/2013/07/23/whats-behind-the-battle-of-received-wisdoms/As Prof Mike Hulme (founding director of the Tyndall Centre for Climate Change) is not exactly a 'sceptic', the debate and issues raised should be of interest to all that are interested....
-
MA Rodger at 00:55 AM on 28 July 2013The anthropogenic global warming rate: Is it steady for the last 100 years? Part 2.
KK Tung.
I did indicate @194 that I had further concerns stemming from the graph presened @193. With no prompt reply to the first two such concerns expressed @193/197 & @194 apparently forthcoming, perhaps presenting my remaining concerns would be helpful.
These last concerns from the graph @193 stem from the trace labelled SolVolENSO. This trace represents the total of the temperature changes attributed by the MLR to Solar, Volcanic & ENSO forcing and it is derived simply by subtracting the data within T&Zh13 fig5a from HadCRUT4. There are two features that I consider problematical within this SolVolENSO trace. Firstly its amplitude is so tiny. And secondly, along its entire series it is so flat.
Note that these two problems are also present in Zh&T13 fig 1a.(1) In the graph @193, the spread of values in the SolVolENSO trace is visibly smaller than the spread of values in the HadCRUT4 trace labelled "Had oscillations" in that graph (which is HadCRUT4 - 10yearsAverageHadCRUT4). While there may be an explanation for this difference, Zh&T13 does say that it obtains results very close to the 1979-2010 results of Foster & Rahmsdorf 2011. (Zh&T13 does explain that its Fig 1a equivilant to T&Zh13 Fig5a is effectively the FR11 analysis but for 1856-2011). In FR11 the attributed temperatures & HadCRUT4 have very similar amplitude, and thus FR11 is able to attribute the majority of the fluctuations within the HadCRUT3 signal to Solar Volcanic & ENSO effects. It appears Zh&T13/T&Zh13 has failed to do likewise for HadCRUT4.
(2) The data used by T&Zh13 to create Fig 5a are as follows:- Sol = Wang et al 2005, Vol = Sato et al 1993 and ENSO = Cold Tongue Index. (As an aside, it would be interesting to learn how the lack of Cold Tongue data during the 1860s was overcome, given that the alternative MEI.ext was not chosen because it does not go back before 1871.) Given these three inputs, it would appear to me sensible to expect periods with long term trends within the SolVolENSO trace.
As an instance of this, consider the period 1910 to 1930. Solar forcing of course fluctuates with each solar cycle but there is a strong rising inter-cycle trend over solar cycles 14-19 which encompasses this entire 1910-30 period. Volcanic forcings also fluctuate with the individual volcanic eruptions yet these are diminishing over the period 1910-30 and would thus at the very least not counteract the rising Solar trend. CTI (and MEI.ext) also fluctuates but again too is rising significantly over the period 1910-30.
So why is it that when I plot SolVolENSO from T&Zh13 fig 5a, the 1910-30 plot does not feature any significant upward trend? Rather it is very flat, a flatness that extends over the rest of SolVolENSO with onlyshort sub-decadal trends being evident.These two features of the MLR output SolVolENSO, coupled with the wobbles in the residuals (as discussed @193/197) and the problems with the AMO index used (as discussed @194) do, I feel, need some explanation. Otherwise the integrity of this MLR analysis becomes drawn into serious question.
-
Russ R. at 00:31 AM on 28 July 2013Update on BC’s Effective and Popular Carbon Tax
In case you're still in doubt about the gasbuddy.com data, I emailed them to confirm. Here is my email and their response:
-----Original Message-----
From: GasPriceData.com Support
Sent: Friday, July 26, 2013 4:58 PM
To: xxxxx@gmail.com
Subject: RE: GasPriceData.com Feedback - Data Question - RussHello,
Thank you for sending in an email.
Historical prices are given in the currency of the country that the city is
located in. Unfortunately we do not convert the prices to different
currencies in the case of comparing prices between the U.S. and Canada. That
would be done by the individual themselves, rather than us.I hope you find this information helpful.
Regards,
Jess
-----Original Message-----
From: xxxxx@gmail.com [mailto:xxxxx@gmail.com]
Sent: Friday, July 26, 2013 2:27 PM
To: feedback@gaspricedata.com
Subject: GasPriceData.com Feedback - Data Question - RussFor comparing historical gas price data between Canadian and US cities, how is the CAD/USD exchange rate factored in?
Are historical Canadian gas prices translated to USD at the current exchange rate, or at the historical rates?
-
MA Rodger at 00:27 AM on 28 July 2013Levitus et al. Find Global Warming Continues to Heat the Oceans
dvaytw @52.
Oceans acting as the damper on any rising temperatures is not too difficult to establish. So a reference could well be found way back in time. But before 1997? Anything post 1990 will be preceeded by the IPCC FAR. A quick look at the Summary yields.
IPCC WG1 1990 Policymakers' Summary p xxvi
Info box - EQUILIBRIUM AND REALISED CLIMATE CHANGE
"When the radiative forcing on the earth-atmosphere system is changed, for example by increasing greenhouse gas concentrations, the atmosphere will try to respond (by warming) immediately But the atmosphere is closely coupled to the oceans, so in order tor the air to be warmed by the greenhouse effect, the oceans also have to be warmed, because of their thermal capacity this takes decades or centuries This exchange of heat between atmosphere and ocean will act to slow down the temperature rise forced by the gieenhouse effect."
IPCC WG1 Policymakers Summary p.xxix
"Global-mean temperature alone is an inadequate indicator of greenhouse-gas-induced climatic change Identifying the causes of any global-mean temperatuie change requires examination ot other aspects ol the changing climate, particularly its spatial and temproal characterisitcs (and?) the man-made climate change signal." -
andrewii at 23:52 PM on 27 July 2013IPCC is alarmist
Thanks DSL, gws and Glenn Tamblyn!
-
Tom Dayton at 23:47 PM on 27 July 2013Murry Salby finds CO2 rise is natural
Michaelf, a debunking by Masters and Benestad was published in the July issue of the same journal. The article is paywalled, but Masters explained the approach on his blog, and Benestad debunked previous, annoyingly similar "work" by Humlum on RealClimate. Masters discusses their Masters and Benestad critique on his blog, including a discussion by he and Richardson about the complementarity of their critiques.
Moderator Response:[TD] Mark Richardson wrote a whole Skeptical Science post summarizing his comment.
-
Tom Dayton at 23:39 PM on 27 July 2013Murry Salby finds CO2 rise is natural
Michaelf, Mark Richardson debunked Humlum's 2013 article in the latest issue of the same journal.
Moderator Response:[TD] Mark Richardson wrote a whole Skeptical Science post summarizing his comment.
-
Russ R. at 21:33 PM on 27 July 2013Update on BC’s Effective and Popular Carbon Tax
Andy,
I apologize for not having read your previous post.
My rant was not directed at you.
-
Michaelf at 19:18 PM on 27 July 2013Murry Salby finds CO2 rise is natural
Just been pointed to this article that seems to support Salbys work. Do you have a rebuttal for its conclusions?
http://www.sciencedirect.com/science/article/pii/S0921818112001658
Moderator Response:[TD] Just more of the same for Humlum. Search for "Humlum" on this page. Also enter Humlum in the Search field at the top left of this page to find more.
[TD] Sorry, I should caffeinate before typing in the morning. Mark Richardson wrote a Skeptical Science post about this Humlum paper!
-
chriskoz at 18:28 PM on 27 July 2013A tale told in maps and charts: Texas in the National Climate Assessment
I have problem understaqnding the nomenclature of some figures.
Figure 4.3 introduces "Cooling Degree Days" on the scale from 0 to 2800. What does it mean that CDD==2800? Per year is impossible, so maybe per decade or per the entire period shown?
On the other hand, Figure 19.3 shown delta of "Number of Dry Days" on the scale from -8 to +6. Again, what does this measure mean? What was the base of that delta? Per year, per decade or per entire period like in the previous example?
I cannot have a "feeling" as to the magnitude of those changes because the measures is so poorly defined that you don't really know what numbers they show.
Is it only me having problems here ? Maybe someone else who understands the undefrlying research can explain the nukmbers to me...
-
Andy Skuce at 16:31 PM on 27 July 2013Update on BC’s Effective and Popular Carbon Tax
Russ R
i suggest that you read the previous post I made on the subject just a few weeks ago. I addressed points 1 and 2 there, but probably, by the sound of it, not to your satisfaction. Yes there are other gasoline taxes apart from the carbon tax, some of them bigger in the Vancouver area. And yes, the decline in consumption is bigger than expected from what these taxes should produce according to standard models.
You should also read the working paper by Rivers and Schaufele that I linked to that discusses this issue at length. You may be interested to read there that they do not discount entirely the idea that cross-border gas fill-ups may have played a role in the consumption reductions. They wrote:
Two alternative explanations, cross-border shopping and contemporaneous vehicle efficiency policies, could also potentially explain our findings. Both are discussed in turn. We believe that neither is credible and think that there are good reasons to trust that it is the carbon tax that caused the change in consumer behaviour. The first alternative explanation is that the carbon tax coefficient is actually capturing a cross-border shopping effect. Higher prices due to the carbon tax may have encouraged drivers to begin filling their gas tanks in neighbouring jurisdictions. We are unable to dismiss this explanation, yet believe that it is unlikely. Alberta is to the east of BC, while Washington State is to the south. Both jurisdictions have had lower gasoline prices than BC for many years, including a lengthy period prior to the introduction to the carbon tax (refer to Panel B in Figure 1). Further, over 95% of BC’s population would need to drive more than two hours to reach the Alberta border, while crossing into Washington involves an international border. It is doubtful that a sizeable share of residents suddenly began cross-border shopping because of the carbon tax. Nonetheless, this is a potential alternative explanation for our findings.
I understand that a peer-reviewed version of this paper is in the works.
Rather than jump to the conclusion that everyone here is gullible, you perhaps should have considered the possibility that some of us had already thought through some of these issues more thoroghly than you have.
-
dvaytw at 16:15 PM on 27 July 2013Levitus et al. Find Global Warming Continues to Heat the Oceans
Thanks for all the info, guys.
The dude is also trying to say that the ocean heat content is just climatologists making AGW theory unfalsifiable by changing their story after the fact. I recall there was a study quite a while back predicting oceans would take up most of the heat. I know Hansen had something about this as early as 1997, but I remember there was something even earlier. Does anyone know what this was?
-
Russ R. at 11:59 AM on 27 July 2013Update on BC’s Effective and Popular Carbon Tax
(-snip-).
Rather, all of the skepticism has been directed at the small side-effect of leakage that I raised.
(-snip-).
1. You should maybe have been a bit skeptical about a claim that a ~5% carbon tax resulted in a ~19% decline in per capita fuel consumption. That would imply a long-run price elasticity equal to -3.8. That should have immediately raised a few eyebrows, since no econometric analysis has ever observed a sensitivity figure of nearly that magnitude... the median estimate for long-term fuel (gasoline) price elasticity is only around -0.5. (Source: Gasoline demand revisited: an international meta-analysis of elasticities, Molly Espey (1998) Fig. 2) That implies a ~5% increase in price should result in only a ~2.5% decline in consumption, certainly not ~19%. The authors themselves noted the reduction was 7.1x greater than expected, (-snip-).
2. (-snip-) in 2010, Translink (the public transit authority) raised its vehicle fuel levy by 3 cents per litre, and by an additional 2 cents in 2012 on all gasoline and diesel sales in the South Coast region (covering all of Greater Vancouver) . (-snip-). (-snip-).
3. I suggested that some amount of the massive decline should be attributed to people filling up their tanks outside the province... as a) there is a substantial tax gap, and b) the number of cross-border trips have more than doubled during the period. (-snip-). Never mind that Andy Skuce kindly supported my point @16.2, estimating that around 11% of the decline in domestic sales could be due to cross-border day trips by BC residents. I agreed that his estimate was reasonable, and pointed out @18.2, 18.3, 18.4 and 18.5 that there are at least 4 other smaller factors contributing to the decline in domestic sales, and suggested that he might want to consider them if he's going to be doing more detailed analysis. (-snip-). (-snip-).
4. And then the clincher.... Tom Curtis @15 produced a historical gas price chart he pulled from gasbuddy.com showing that the spread between BC and Washington prices hasn't widened, rather it narrowed as much as 20% by his pixel counting method. And just like that, case closed. (-snip-)... except for one detail. The gas price differential didn't really narrow. (-snip-). Tom (-snip-): "When comparing US cities to Canadian cities you have a choice of price units. The standard unit of measure in the US is dollars per gallon and in Canada the standard is cents/liter. Comparison of US and Canadian cities is done using recent currency exchange rates and uses the conversion factor of 1 US gallon being equal to 3.78 liters." Gasbuddy doesn't apply historical exchange rates. (-Snip-) But nobody here stopped to apply a moment of skepticism (or common sense). News reports of people lining up across the border to buy gas, people complaining of the rising tax gap, 400 thousand more trips per mont... but no... ignore all of those people. Tom concludes that LESS people bought gas because he downloaded a chart that he erroneously interpreted as evidence that the price differential had narrowed. (-snip-).
Moderator Response:[DB] Multiple inflammatory tone violations snipped. Please familiarize yourself with this site's Comments Policy and comport future comments to comply with it (link adjacent to the user comment box).
-
Brianc at 11:04 AM on 27 July 2013BC’s revenue-neutral carbon tax experiment, four years on: It’s working
In 2008 1,714,031,000 liters of diesel fuel was sold in B.C. In 2011 2,221,338,000 were sold.
I know this data doesn’t have 2012 but you’d have to have one heck of a drop to get over a forty percent drop in diesel fuel. It makes me wonder what data they are using, or maybe I’m using the wrong data.
http://www.statcan.gc.ca/tables-tableaux/sum-som/l01/cst01/trade37c-eng.htm
-
Andy Skuce at 09:33 AM on 27 July 2013Update on BC’s Effective and Popular Carbon Tax
Tom, KR, Philippe,
I disagree on a couple of points.
One is that I think the data show that BC same-day crossing have gone up faster than elsewhere in Canada. Here's a plot I made. I did running 12 month sums of the monthly data, so the number of cossings is for a yearr centred on a given date.
(Forgive the typo in the label.) The BC same-day trips increase from 2008 to 2012 more in absolute terms than the rest of Canada and in population relative terms much more. As I said above, I don't think this was driven significantly by the carbon tax. I would speculate that this is a result of other pressures and due to the fact that a lot bigger proportion of the population in BC live close to the border compared to other provinces and they can more easily respond to economic incentives by shopping in the US.
But, regardless of the motivation for taking the additional trips, more people filling up in the US in 2012 than in 2008 would depress reported fuel sales in BC, other things being equal. The question is by how much. My provisional estimate is that this may account for a small part (about 10%) of the observed decrease reported per-capita consumption relative to the rest of the country. The decrease reported since the introduction of the carbon tax is huge, 18.8%; if the cross-border-corrected number turns out to be 16%, it would still be a very large decline, far bigger than econometric models would predict from a carbon tax of $30/tonne.
Prev 855 856 857 858 859 860 861 862 863 864 865 866 867 868 869 870 Next


