


 Arguments


Recent Comments
Prev 861 862 863 864 865 866 867 868 869 870 871 872 873 874 875 876 Next
Comments 43401 to 43450:
-
chriskoz at 09:03 AM on 18 July 2013Debunking New Myths about the 97% Expert Consensus on Human-Caused Global Warming
It's amazing how many times in this interview Ed points out in the simple words that climate sicence is not only about land temperatures but Andrew goes back to his imaginary "plateau" in XXI century because it's very "intriguing". Every time, he denies every point he hears.
Ed would heve done better job saying that we know the physical mechanisms behind the "plateaus" such as the XXi century's one (recal the SkS's escalator to prove there were many of those) with ElNino/LaNina episodes acting as heat exchangers between Ocean (the main heat energy reservoir - 90%) and Athmosphere (which holds only small fraction of heat enrgy - therefore the exchange resulting in wider swings of temperature). But I don't think that argument would make any impression on Andrew: like all other arguments, he would simply ignore it.
-
michael sweet at 08:58 AM on 18 July 2013Trenberth on Tracking Earth’s energy: A key to climate variability and change
Old Sage,
You have a lot of chutzpah for someone who has been demonstrated wrong several times. You need to break out your freshman physics textbook and review it again.
You keep making comments about the ionosphere. Everyone else knows that the ionosphere has no relationship to the surface temperature. This is a comment that is usually called "not even wrong" because it is so far off base. That is why no-one has responded to your points. The surface heat budget is allradiated from the top of the stratosphere in the IR spectrum. This is basic black body physics. If you do not understand why the ionosphere does not affect the surface either read your textbook or ask a question to clear up your misconception.
You will find that people are less cutting in their responses to you if you stop being so condescending to others. It is especially irritating since you are so often completely wrong and then you are demeaning to others who are in fact correct. For example, you frequently suggest others should read their textbook because you do not understand basic atmospheric physics. Tom can read his textbook all day and you will still be wrong. If you start asking questions about what you obviously do not understand you will come across much better. Your basic physics of the atmosphere is lower than a freshman physics student is expected to understand.
-
supak at 08:46 AM on 18 July 2013Patrick Michaels: Cato's Climate Expert Has History Of Getting It Wrong
Tom Curtis @ 17
<<
First, you should insist on using HadCRUT4 rather than HadCRUT3.
Second, find out the start year for Michael's predicted 25 years with no warming.
Third, from existing HadCRUT4 data, find the standard error on 25 year trends.
Fourth, bet that on the 25th year, the warming trend will be greater than two times the standard error for HadCRUT4 trends.
>>
Here's his offer:
<<
statistically significant (p= .05) warming trend for 25 years based on annual data beginning in 1997, using HadCRU4
>>
-
Glenn Tamblyn at 08:21 AM on 18 July 2013Empirical evidence that humans are causing global warming
Matthew L
"Is anything an indicator "unique to human-caused global warming" other than the TOA energy balance and its link to greenhouse gases? "
Several things are strong indicators that narrow the possibilities for the cause of the observed warming radically.
Cooling of the Stratosphere at the same time as the Troposphere is warming is a powerful piece of evidence. If the warming was due to some other source such as increased sunlight we wouldn't see this pattern, we would see a general change increase in the atmospheric temperature at all altitudes. Stratospheric cooling is caused by the fact that more energy is being radiated to space from higher in the atmosphere than from lower down, shifting the balance of where in the atmosphere radiation to space is occurring. Only a change in the optical properties of the atmosphere could cause this.
Heat accumulation in the oceans is at least 5 times greater than the largest available heat source here on Earth. Therefore, that additional heat cannot be coming from anywhere here on Earth. That leaves as the only possible source as being a change in the Earth's radiative balance with space.
That nighttime and winter temperatures are warming as fast, in fact somewhat faster, than daytime or summer temperatures rules out heating from the sun - directly or indirectly due to changes in cloud cover for example - as heating from the sun would cause more heating when the sun shines.
With terrestial heat sources, the sun and cloud changes ruled out, that only leaves a change in the GH Effect as the remaining possible cause. And the primary change that is expected from a change in the GH Effect - Stratospheric cooling - is being observed.
Moderator Response:[TD] For more see the counterargument "It's Not Us," including the Basic, Intermediate, and Advanced tabbed panes.
-
old sage at 07:37 AM on 18 July 2013Trenberth on Tracking Earth’s energy: A key to climate variability and change
Bit of a joke that - ageism - didn't go down well!
Anyway, I take it you folks all believe there is absolutely no radiation from earth other than i/r. Please allow me to beg to differ, and we will leave it at that. There are some solid physical reasons for believing alternative mechanisms not only can but must exist. There is obviously a lot of sense in studying the detailed influences of all the man made pollutants on radiative transfers in the atmosphere but I worry that it offers a distraction from a serious problem consuming the time of good men. An eye 2 cms from liquid helium at 1deg hardly increases the boil off - fail to keep a liquid oxygen cold trap several meters away down a room temperature tube topped up and the results soon get catastrophic. I would suggest more time be spent looking at kinetic transport and the cold trap. I might take another look at the nitty gritty but I doubt it.
-
John Hartz at 07:08 AM on 18 July 2013Models are unreliable
Many of the issues being dicussed on this thread are addressed in the article,
Seeking Clues to Climate Change: computer models provide insights to Earth's climate future, Science & Technology Review, June 2012, Lawrence Livermore National Laboratory
-
John Hartz at 06:42 AM on 18 July 2013Empirical evidence that humans are causing global warming
Matthew L @89:
Your assertion that modelers don't know how to model clouds is totally unfounded.
See SkS post, New tool clears the air on cloud simulations
-
Phil at 06:13 AM on 18 July 2013Trenberth on Tracking Earth’s energy: A key to climate variability and change
old_sage @238
Incidentally your biology is not too sharp either: there is no such thing as "physics DNA". What could you possibly have meant by that ?
-
Zen at 06:03 AM on 18 July 2013Debunking New Myths about the 97% Expert Consensus on Human-Caused Global Warming
Neil refers to a study by Hans Von Storch and also quotes him. Can anyone enlighten me as to who Hans Von Storch is? Thanks.
-
Phil at 05:59 AM on 18 July 2013Trenberth on Tracking Earth’s energy: A key to climate variability and change
old_sage @238
There seems to be a lot of misunderstanding here due to a little knowledge being a bad thing.
Thank you for concedeing that; the basics of Rotational and Vibrational absoption spectra can be learnt from any standard undergraduate text on Phyisical Chemistry. I learnt mine from P.W Atkins (aged 73). "Phyisical Chemistry" (OUP, 1st Edition, 1978) has an introduction to the subject in chapter 17, including the Boltzmann distribution mentioned by gws. He goes into more detail in Molecular Quantum Mechanics Part III (OUP, 1970), in Chpater 10.For exhaustive detail on Rotational Spectroscopy (not strictly relevant to the GHE, but my "bible" during my Ph.D) see Microwave Spectroscopy by Townes and Schawlow (Dover Press, first published in 1955)
-
Composer99 at 05:47 AM on 18 July 2013Empirical evidence that humans are causing global warming
Finally, your final paragraph in #88 states:
I would be more impressed with the scientists if they accepted the evidence on face value and tried to hypothesise why the hot spot is not there rather than trying to find excuses as to why it might be there just, somehow, hidden.
is, quite simply, uncalled for. Frankly it is at best very close to accusing scientists of either incompetence or malfeasance, either way without any good evidence of your own to support such a claim. What is more, it is directly contradicted by the discussion in the tropospheric hot spot thread.
In keeping with the comments policy here if you wish to go into detail in discussing the tropospheric hot spot I recommend posting in the thread linked by the moderator in response to your post #85. I also recommend desisting from any insinuations of ill intent on the part of scientists in future; persevering in such behaviour will very quickly see you ousted from participating at this site.
Moderator Response:[TD] Thank you for supporting my frustrating (for me) attempts to keep discussions on the right threads. Everybody, continue discussion of the tropospheric hot spot on the tropospheric hot spot thread, not here. I will delete anybody's further discussion of the hot spot from this thread. Sorry to all you well-meaning responders, but you are just encouraging Matthew L to continue misbehaving.
-
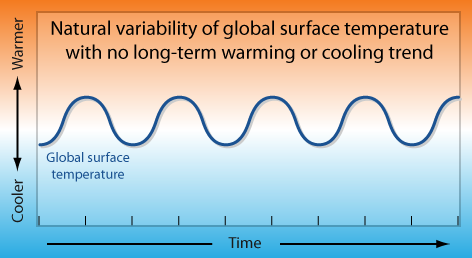
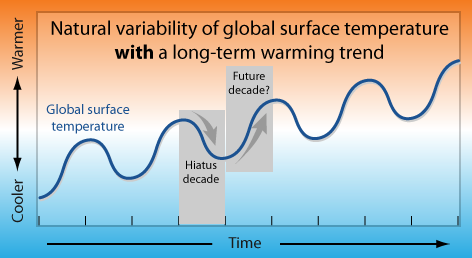
Rob Painting at 05:40 AM on 18 July 2013They didn't change the name from 'global warming' to 'climate change'
Nichol - the heat being transported downward and poleward by the currently intensified wind-driven ocean circulation may be shielding us from more warming of global surface temperatures but, based on past observations and modelling, it is unlikely to persist. The global weather tends to oscillate between periods where heat is stored in the deeper ocean layers (negative Interdecadal Pacific Oscillation), and periods where it remains in the surface layers (postive IPO). A long-term warming background climate does not cause La Nina or El Nino (which are largely responsible for this natural variation) to disappear.
The following images should make this clearer - the variation is unrealistically smooth, but it's just for illustrative purposes.
-
Composer99 at 05:38 AM on 18 July 2013Empirical evidence that humans are causing global warming
Matthew L:
Is anything an indicator "unique to human-caused global warming" other than the TOA energy balance and its link to greenhouse gases? Everything else is an indicator of "warming".
Quite the contrary:
- By itself, the energy imbalance at TOA tells us only that the globe is warming. We need additional evidence to tie it to an enhanced greenhouse effect (such evidence exists, as it happens).
- There are multiple lines of evidence showing that the enhanced greenhouse effect causing the present warming is itself human-caused, as well as evidence excluding other sources. These lines of evidence are discussed here (and elsewhere) on Skeptical Science (and from thence the primary literature).
In addition, you state:
I have to say the argument regarding the lack of a troposphere hot spot being likely due to "data errors" sounds mighty like a cop-out to me. There are plenty of measurements, both Radiosonde and Satellite, none of which show evidence of the hot spot. I would be very surprised if they were all wrong.
Your claim here appears to be directly contradicted by the papers discussed in the link you were provided by a moderator. Some choice quotes (emphasis mine in all cases):
Observing the hot spot would tell us we have a good understanding of how the lapse rate changes. As the hot spot is well observed over short timescales (Trenberth 2006, Santer 2005), this increases our confidence that we're on track. That leaves the question of the long-term trend.
The three satellite records from UAH, RSS and UWA give varied results. UAH show tropospheric trends less than surface warming, RSS are roughly the same and UWA show a hot spot.
Weather balloon measurements are influenced by effects like the daytime heating of the balloons. When these effects are adjusted for, the weather balloon data is broadly consistent with models (Titchner 2009, Sherwood 2008, Haimberger 2008). Lastly, there is measurements of wind strength from weather balloons. The direct relationship between temperature and wind shear allows us to empirically obtain a temperature profile of the atmosphere. This method finds a hot spot (Allen 2008).
Weather balloons and satellites do a good job of measuring short-term changes and indeed find a hot spot over monthly timescales. There is some evidence of a hot spot over timeframes of decades but there's still much work to be done in this department. Conversely, the data isn't conclusive enough to unequivocally say there is no hot spot.
I should like to see what sources, and in particular what papers in the literature, form the basis of your claim that "There are plenty of measurements, both Radiosonde and Satellite, none of which show evidence of the hot spot."
Specifically with regards to the accusations of "cop-out[s]", there have been two important cases in the past where apparent data contradicted model predictions - and the data were found to be wrong (vindicating the models):
- That enhancing the atmospheric greenhouse effect would indeed cause warming. After Svante Arrhenius suggested this, Knut Angstrom ran an experiment which appeared to contradict Arrhenius. Subsequent experiments and observations eventually vindicated Arrhenius' model against the data Angstrom's experiment turned up.
- For quite some time, UAH satellite data appeared to contradict models showing warming; in the event significant errors were found with the UAH data, such that it ceased to conflict with models.
(See discussions here, here, or perhaps elsewhere on Skeptical Science.)
-
KR at 05:12 AM on 18 July 2013Empirical evidence that humans are causing global warming
Matthew L - "It has turned out to be difficult to measure or model the overall net effect, but that very difficulty is evidence that the net effect is not strongly one way or the other..."
Simply put, strong signals are easier to detect. If cloud feedbacks were (positive or negative) on the order of magnitude of observed direct forcings or the observed water vapor response, we would have significant evidence for it. And... we don't.
Personally, I consider cloud forcing primarily an issue on transient climate sensitivity, the speed with which the climate responds - longer term responses are fairly well constrained by the paleo data to the 2-4.5C range, and that includes any cloud response.
-
Composer99 at 05:00 AM on 18 July 2013Trenberth on Tracking Earth’s energy: A key to climate variability and change
There seems to me to be a bit of ageism creeping in here from young know-alls!
Snippy, sarcastic answer: I can't imagine why that would be.
Actual answer: Age has essentially nothing to do with the objections raised against your claims.
The objections are:
- You have provided no basis to accept your claims save for your own authority and a good deal of handwaving.
- What is more, your claims are contradicted by directly measurable phenomena which are consistent with the physics of CO2 molecules and their interactions with electromagnetic radiation at various wavelengths, for which references have been given in the OP and comments.
- Your sole line of counterargument to the above, to date, has been little more than a wordy equivalent of "nuh-uh!"
-
r.pauli at 04:58 AM on 18 July 2013Carbon Dioxide's invisibility is what causes global warming
Carbon dioxide is just the by-product of human blunder. Global warming is caused by humans who ignore, deny or permit carbon emissions. CO2 is just part of the chemical mechanism we discovered.
When a plane crashes, we don't blame gravity.
-
Matthew L at 04:53 AM on 18 July 2013Empirical evidence that humans are causing global warming
Moderator:
"but that very difficulty is evidence that the net effect is not strongly one way or the other"
How so? My reading of "that very difficulty" is that the modellers don't know how to model clouds. Until they know how to model them they won't know whether the net effect is strong, weak, negative or positive.
The fact that they only tentatively suggest that it might be slightly positive or slightly negative suggest that they simply don't know and don't want to get it too wrong (or is that just me being cynical?).
In the absence of decent results from the models it might be useful to measure the clouds albedo / greenhouse effect directly. Is anybody doing that? Surely it is necessary anyway in order to find out if the models are right or wrong.
In my (very humble) opinion, this is the least convincing aspect of the current crop of climate models. The two fundamental forces in our weather are the wind and the clouds. To not be able to accurately model the effect from clouds has to be a prime suspect at the root of the current divergence between the model outputs and the measured temperatures.
Moderator Response:[TD] As I already instructed, please put this further discussion of clouds on the thread I pointed you to. I will give you a little while to copy this comment over there, then I will delete this comment here.
Sigh... I don't want to orphan the excellent replies to your comment here, so I will let this comment stay. But no more off-topic comments; I will delete them.
-
Matthew L at 04:38 AM on 18 July 2013Empirical evidence that humans are causing global warming
Thanks for the responses. Enough reading to keep me going for a while there! Shame there does not seem to be any direct measurement of the TOA energy balance at the Top of the Atmosphere rather than being inferred indirectly from ocean heat content numbers - but you obviously just have to work with the tools available.
No comment on my points about the divergence between the models and the tropics - which (as you will know) is a hot topic on many blogs at the moment.
Re your comment:
"The tropical hot spot is not an indicator unique to human-caused global warming"
Is anything an indicator "unique to human-caused global warming" other than the TOA energy balance and its link to greenhouse gases? Everything else is an indicator of "warming". I have to say the argument regarding the lack of a troposphere hot spot being likely due to "data errors" sounds mighty like a cop-out to me. There are plenty of measurements, both Radiosonde and Satellite, none of which show evidence of the hot spot. I would be very surprised if they were all wrong.
I would be more impressed with the scientists if they accepted the evidence on face value and tried to hypothesise why the hot spot is not there rather than trying to find excuses as to why it might be there just, somehow, hidden.
-
old sage at 04:25 AM on 18 July 2013Trenberth on Tracking Earth’s energy: A key to climate variability and change
There seems to me to be a bit of ageism creeping in here from young know-alls!
The minutiae of trying to model everything everywhere is an heroic task and good luck to those doing it. We could all be toast by the time it's finished.
There are two false premises upon which this GG quantum depends.
One is that the net energy from the sun all escapes within the envelope of the infra red. Is that reasonable? I do not believe that anyone holding their hand up to earth from a satellite would feel anything like the amount of heat radiating from it which these radiation models of i/r require. You would even notice this from a high snowy mountain pointing your hand at the valley.
Number two, the same really, is that all that kinetic energy absorbed by gases can only find its way out by direct radiation at i/r. A molecule highly excited can make a multistage transition say from rotational to vibrational as it relaxes giving rise to two or more lines but as its energy ultimately decays into thermal as a result of an inelastic collison the question is can this higher translational energy be handed back? It cannot in the absence of a background of i/r radiation because the gap is equivalent to several thousands of degrees. Can one then imagine an already excited molecule changing up a gear in an inelastic collision to a nearby level by the amount available from translational movement. The odds are stacked highly against this. Decay is available to a continuum of kinetic levels, recharging needs a precise collision into discrete levels with large, in kinetic terms, separation.
That means by reducing outgoing i/r as the only sink for energy generated - either by man or sun - you have to conclude there is another major activity going on taking up kinetic energy and radiating it.
That energy can only be found in the largely unexplored frequency ranges - and they might be spiky and intermittent (e.g. huge numbers of wireless energy radiators (^10-17 ergs) such as are found in the ionosphere.)
There is an analogy. Just as the underlying thermal oscillations prompt radiation from a solid's electron covering in BB radiation, the electrically charged ionosphere covers a pulsating, swirling and mobile atmosphere. This has to stimulate radiation and being at the top of the earth, it will escape unhindered. The earth's response to heating up has to be that robust a mechanism and not too sensitive to the gaseous constituents as it has supported life for millenia. That is not to deny the impact of man's activity, mankind is just an additional burden.
There is clear confusion, and not mine, between the emissions in gases - in which the spectral lines are far fewer than those observed in the absorption spectrum. But at bottom, the absolute determination to avoid any concept of heat transfer by conduction, convection and mass transfer within the atmospheric envelope to a cooler upper layer is fatal to the argument from my viewpoint. I don't dispute what Ramanthan and Coakley may have said, I simply don't wish to wade through it. It involves what is probably second, may be third or perhaps even fourth order argument involving the shuttling around of photons by CO2 before their final resting place as kinetic energy.Moderator Response:[tD] Your "ageism" remark is inappropriate. And unless you are 100 years old, you are not older than all the people responding to you, let alone all the people who have written the peer-reviewed scientific papers being cited by your responders and the original post above.
-
KR at 04:18 AM on 18 July 2013Empirical evidence that humans are causing global warming
Matthew L - My apologies, the reference I gave on OHC was for shallow waters only. More appropriate references would be to Meehl et al 2013 on short and medium term variability, Levitus et al 2012 on increasing total OHC, and the SkS discussion on heat sequestration here.
The current period appears to be one of increased deep sequestration of ocean heat, resulting in rather slower warming of the atmosphere - but when that sequestration returns to normal (or lesser) rates we can expect rather fast atmospheric warming in response.
-
philipm at 04:13 AM on 18 July 2013Debunking New Myths about the 97% Expert Consensus on Human-Caused Global Warming
MA Roger: tell him about URL shorteners.
-
KR at 03:32 AM on 18 July 2013Empirical evidence that humans are causing global warming
Matthew L - One of the most robust measures of energy imbalance is the rise in ocean heat content, which integrates/averages that TOA imbalance, and those measures indicate ongoing TOA imbalances of ~0.5-0.6 W/m2. There are multiple threads here on Sks regarding ocean heat content, and I would also point to Loeb et al 2012, 'Observed changes in top-of-the-atmosphere radiation and upper-ocean heating consistent within uncertainty'.
"I have always struggled with the lack of negative feedbacks in the models" - Observations on climate sensitivity are in the 2-4.5 C/CO2 doubling range, indicating an overall positive feedback to forcings. Current data on cloud feedback indicates it has a small and probably positive value (Dessler 2010).
"...then it could simply be that there is currently a (temporary?) balance at the TOA that means that there is no extra heat being accumulated...?" - GHG forcings have certainly not halted, OHC is still rising, particularly in the deep ocean, and observations are consistent both with models of ocean circulation (Meehl et al 2011) and measured short term climate variability (Foster and Rahmstorf 2011). Currently there is no evidence whatsoever of a TOA rebalancing.
-
Dikran Marsupial at 03:27 AM on 18 July 2013Carbon Dioxide's invisibility is what causes global warming
In public discussion of science there will always be a compromise between using language that will be understood and remaining completely accurate to finest of detail. Saying that the energy is "trapped" is reasonable as a place to start. If one were to be really pedantic, we could take Fraser's statement
"No, the atmosphere absorbs radiation emitted by the Earth. But, upon being absorbed, the radiation has ceased to exist by having been transformed into the kinetic and potential energy of the molecules. The atmosphere cannot be said to have succeeded in trapping something that has ceased to exist."
and say that matter and energy can't be created or destroyed, only transformed. Therefore Fraser's statement is innacurate as the radiation emitted by the surface has not ceased to exist, but has merely been transformed into kinetic and potential energy of the molecules, exchanged a bit and then re-transformed to come back to us as "backradiation". However there comes a point where attention to detail becomes pedantry and obstructs communication of the central point, rather than assisting it, the point at which this happens is not fixed, but depends on the audience.
The "intactness" is irrelevant to the issue, essentially energy is energy is energy - the thing that matters is the rate at which it enters the system and the rate at which it leaves the system.
-
empirical_bayes at 03:05 AM on 18 July 2013Carbon Dioxide's invisibility is what causes global warming
Yeah, except that I object to the use of the term "trapped" with respect to energy and greenhouse gases, for the same reason Professor Fraser does here ... http://www.ems.psu.edu/~fraser/Bad/BadGreenhouse.html It's misleading. It assumes the energy radiating from Earth remains intact somehow.
-
grindupBaker at 02:56 AM on 18 July 2013They changed the name from 'global warming' to 'climate change'
Maybe typo "'climate change' is now". I want "...refers to the long-term trend of a rising average global temperature" to be "...increasing global heat content" (I mean everywhere, not this article), would it cause a foofaraw if I get it changed ?
-
John Hartz at 02:47 AM on 18 July 2013They didn't change the name from 'global warming' to 'climate change'
Nichol: Generally speaking, when scientists use the term "climate change," they mean changes to the "climate system." I suggest that you review the IPCC definitions of "climate", "climate change", and "climate system" presented in the SkS Glossary.
-
funglestrumpet at 02:39 AM on 18 July 2013Carbon Dioxide's invisibility is what causes global warming
As a non-chemist, I would appreciate an 'intermediate' version which explains the actual mechanism that CO2 uses to trap the infra-red photons and then release them in all directions, only some of which are spacebound.
-
MA Rodger at 02:37 AM on 18 July 2013Debunking New Myths about the 97% Expert Consensus on Human-Caused Global Warming
"Neil has requested that people provide him with examples of the factual errors in this interview." How very polite of him. Yet his request is hosted on twitter which is perhaps indicative of the level of detail at which he deals with climate change. And due to the restriction to 140 characters or less, I'm unable to link to a graphical example of his "factual errors" because of the infeasibly long URLs used by google.
-
Matthew L at 02:28 AM on 18 July 2013Empirical evidence that humans are causing global warming
As far as I can tell, the most critical measurement that would affirm or falsify the theory that manmade GHG emissions are warming the atmosphere is the TOA energy balance. In other words the total amount of energy leaving the atmosphere (SW and LW) needs to be less than the total arriving. I can understand how this is devilishly difficult to measure, but without this information there is no way to know the actual effect that greenhouse gases are having.
Although I accept the theoretical basis of AGW, I have always struggled with the lack of negative feedbacks in the models, particularly cloud feedbacks that increase Albedo and could mean that much of the SW energy that might otherwise hit the surface and be re-radiated as LW may not make it to the surface in the first place and gets reflected straight back out to space.
I have read the article below
http://onlinelibrary.wiley.com/doi/10.1029/2012GL052087/full
which is very interesting but hardly definitive on the TOA balance.What data sets are there out there detailing incoming and outgoing flows? Are there any satellites doing the job? What is the information on cloud cover, particularly around the tropics where insolation and cloud formation is greatest?
The tropics seem to be the biggest problem, both the lack of a measured / measurable tropical Troposphere "hot spot" and the fact that tropical sea surface temperatures have not risen as the models predict. It looks like to me that there is something special going on in the tropics that the models are missing.
With the surface temperatures showing little visible trend either up or down for some years now the theory goes that the energy accumulating in the atmosphere because of the TOA imbalance must be being sequestered in the deep ocean. However if the evidence for a TOA imbalance is less than rock solid then it could simply be that there is currently a (temporary?) balance at the TOA that means that there is no extra heat being accumulated that needs to be sequestered.
Moderator Response:[TD] Clouds both trap outgoing radiation and reflect incoming radiation. Different kinds of clouds have different net results of those two influences. It has turned out to be difficult to measure or model the overall net effect, but that very difficulty is evidence that the net effect is not strongly one way or the other, so reducing the uncertainty about the net effect will not much effect the models' bottom line of projection that warming will be happening sufficiently that we must take action. For further info (and a place for you to comment) on clouds, see the counterargument "Clouds Provide Negative Feedback", noting there are Basic and Intermediate tabbed panes for you to read. See also "Infrared Iris Will Reduce Global Warming."
The tropical hot spot is not an indicator unique to human-caused global warming, as explained in "There's No Tropospheric Hot Spot." -
stonepig at 01:38 AM on 18 July 2013Debunking New Myths about the 97% Expert Consensus on Human-Caused Global Warming
Heidi Cullen points out in "The Weather of the Future" that the use of the word irreversible and uniquivocal, by the top scientists outlining our future, were accepted and expected. The situation is that serious; the right scientists know it (where does an economist learn his climate science?)*, and have given us working material to avoid disaster.
*FOX
-
JasonB at 01:38 AM on 18 July 2013Models are unreliable
Stealth, on another thread:
KR @ 248: I get the impression that you do not understand physics; fudge factors are not an accusation of fraud in any way. The comment of “fudge factors” is from Dr. Freeman Dyson, a world renowned physicist -- I am certain he is qualified to speak to both physics and fudge factors.
But he is not qualified to speak on models, as Tom Dayton showed, and your original use of the phrase "Dyson's claim that GCMs are full of fudge factors" didn't sound like an innocuous use of physics jargon.
As an example, in the CO2 forcing equation, ΔF = 5.35*ln(C/C0) W/m2, the 5.35 value is a “fudge factor”, and so is the natural logarithm function. Over a much larger sample of data, for example, a logarithm with a base of pi may fit better than one with a base of e. [Emphasis mine.]
Erm... You may want to rethink that.
The “laws of physics” are not something given to us from on high. They are simply a mathematical representation of what we think is happening, or a way to describe how something behaves.
They embody our understanding of physical reality. If you are going to base your arguments on ignoring the laws of physics on the basis that they may not be correct, it's only fair to say so. It's important to be able to give "models" that are based on what we don't think is happening the weight they deserve.
Your statement of “They are full of physics” as a way to assert truth or correctness of the models, is both meaningless and ignorant.
What he means is that they embody our understanding of physical reality. That's hardly meaningless and ignorant.
Some of the other folks here are a little combative or condescending.
Sorry about that. I get a bit testy when someone expresses doubt that they can get hold of the source code of the models when they obviously haven't attempted to do so, then when pointed to the correct location to download the source code proclaim that they've wasted enough time trying and question whether those who gave links have actually attempted it themselves, while finding time to twist statements that they found "interesting" to mean other than what was intended. As the steps I gave showed, it was hardly an onerous exercise.
All the while not admitting that the accuracy of the coefficient 5.35 is actually far higher than suggested earlier.
This is what I mean when I say “all models are wrong.” This doesn’t mean they are not useful
You're hardly the first to make that observation.
but it means they are limited in their effectiveness because of the underlying assumptions. How GCMs handle this effect is critical across every equation they use. My primary concern is that almost every equation in GCMs have various limitations or assumptions because they are calibrated to measurements made recently.
Firstly, GCMs aren't parameter-fitting statistical models that are simply fitted to recent observations. Where parameterisation is performed, it is at a low level and it is based on observation of the particular physical process in question. The fact that, when combined, the model as a whole actually reproduces the observed record extremely well (and is unable to when anthropogenic influences are removed) is a testament to the model's accuracy.
Secondly, no matter how complicated the model, and no matter how many "fudge factors" are involved, at the end of the day the model still has to satisfy some pretty basic physics. This is why a simple energy balance model can reproduce the temperature record remarkably well, even though it cannot tell you what the regional effects will be, or changes to ocean circulation, or Arctic sea ice. These limit its accuracy but there are still some pretty strong bounds on the possible behaviour of the more sophisticated models.
JasonB @258: I followed your instructions and still failed. Trying to extract the ModelE1 tarball using Windows and WinZIP fails.
My instructions were to use 7-zip, not WinZIP. I'm surprised that someone with your experience developing software was stumped by a .tar.gz file.
So now I have actual Fortran code for a 10 year old model.
Well, what did you expect? That's the source code for one of the models that was used to create the forecasts for the still-current IPCC report. You want to check those forecasts, you look at the source code for those models. It's also an ancestor of one of the models used for the next IPCC report.
Moderator Response:[TD] Thank you for replying on an appropriate thread!
-
stonepig at 01:27 AM on 18 July 2013Global warming games - playing the man not the ball
PluviAL-the same applies to you. I typred CSLDF on Google and got a nice list of links to the legal defense fund. I saw no viral crazies offered up as eating your computer.
-
stonepig at 01:22 AM on 18 July 2013Global warming games - playing the man not the ball
Frank, are you certain you are looking at the right stuff? You have mis-typed what is supposed to be CSLDF...not just SLDF. As I have perused their site, I see no reason for this web site to be deemed scary for SS users. Please check out what you are searching for, and maybe visit the CSLDF site. It's a shame that excellent scientists are being treated in the manner they are and lied to and about in the lamesteam media.
-
FrankShann at 01:06 AM on 18 July 2013Global warming games - playing the man not the ball
Re #10, Norton Safe Web says the SLDF website has links to two "specific domains which characteristically [have] been known to host malicious exploits and executable files". The site is also rated "Unsatisfactory" by Web of Trust. Does Sceptical Science need to be careful about endorsing the SLDF website?
-
chrisd3 at 00:18 AM on 18 July 2013They didn't change the name from 'global warming' to 'climate change'
I've used the Google ngrams viewer many times to combat this myth, but there's something interesting: Virtually all of the increase in usage of "climate change" has come from British English.
The viewer allows you to choose American English, British English, or just English, which I presume combines the two. The image in this post is for English. If you run it for American English, you see something quite different:
Clearly the two terms have been in nearly equal use in the US for decades; there's been very little change. But here's the one for British English:
All this makes me think that Frank Luntz is not the cause for the overall increase in the usage of "climate change," no matter how pleased he is with himself about that memo:
www.youtube.com/watch?v=4Yz8UwRsWPA
Unless, of course, he has a huge fan club in the UK.
-
Tom Curtis at 23:01 PM on 17 July 2013CO2 effect is saturated
Stealth @259, thank you for the complement, though I am not sure it is deserved. On occasion I have been quite acerbic myself.
Regarding the models, they are just the GCM used for the IPCC AR4, which are listed on table 8.1 of the WG1 report.
Regarding Clear Climate Code, I believe they are working cooperatively with NASA GISS to produce a python version (from memory) of the GISS Model E. I am unsure how far that has advanced, and if completed I am unsure who is hosting it.
Regarding "fudge factors", there is in fact a quite reasonable use of the term in physics as you point out. If this was just physics, however, nobody would be disputing Michael Mann's Hockey Stick, and nobody would be disputing the existence of global warming. There are, unfortunately, people whose approach to this debate is entirely governed by politics. Those people would, and have in the past, take words like "fudge factor" and interpret them out of context to use as just one more weapon in their propaganda war. Therefore we have to recognize words that could be so used, and be very carefull to use exact words that are not prone to misinterpretation.
Regarding the Sun, currently many solar physicists are predicting an extended and significant minimum. Those predictions, from what little I know, have been aound for ten years at most, and are not based on models of solar physics, but on short term correlations. They may be correct, or we may simply be getting a repeat of the very low solar activity around 1910 (which we have not yet dropped below). However, it has been shown that a genuine repeat of the Maunder Minimum would only very slightly delay global warming. That is, with such a minimum and ongoing business as usual, the temperatures we would otherwise have reached in the early 2090s will be reached in 2100.
Finally, forcing is always defined by reference to a particular year. Therefore, any change in cloud cover with respect to that year would constitute a feedback rather than a reduction or enhancement of the CO2 forcing. As it happens, the reference year used by convention is 1750, so any difference in the extent or type of cloud cover between 1994 and 1750 would result in an error in calculating the greenhouse forcing. Of course, whatever the size of that error, it will be matched by an equal and opposite error in calculating greenhouse component of the cloud feedback. So, while your point is technically correct if properly stated, it is largely an academic issue about the use of terms. It is also an unresolvable issue in that we cannot hope to have sufficiently accurate historical records or proxies of cloud cover in 1750 to resolve the point.
Moderator Response:[TD] Will everyone please help get the conversations onto the right threads, since Stealth is not cooperating but his/her comments and everyone's responses are too useful to delete?
-
Nichol at 22:17 PM on 17 July 2013They didn't change the name from 'global warming' to 'climate change'
The expression 'climate change' probably doesn't include the effects on the seas and oceans. For the ocean ecosystem, a slight warming probably already makes a big difference, appart from the acidification due to the CO2. If more heat goes into the oceans .. how much would that speed up sea level rise? Of is that insignificant?
So if atmospheric warming has been less, with more heat going into the oceans, that doesn't mean we can be happy and pretend that the oceans have been saving us this past decade. The fact that humans don't live in the sea doesn't mean that we are completely independent from what goes on in the sea, and especially the biodiversity in it.
-
StealthAircraftSoftwareModeler at 22:01 PM on 17 July 2013CO2 effect is saturated
KR @ 248: I get the impression that you do not understand physics; fudge factors are not an accusation of fraud in any way. The comment of “fudge factors” is from Dr. Freeman Dyson, a world renowned physicist -- I am certain he is qualified to speak to both physics and fudge factors. Fudge factors are values that are derived from observation or educated guesses. Often they are fit to curves in order to simplify an equation. As an example, in the CO2 forcing equation, ΔF = 5.35*ln(C/C0) W/m2, the 5.35 value is a “fudge factor”, and so is the natural logarithm function. Over a much larger sample of data, for example, a logarithm with a base of pi may fit better than one with a base of e.
The “laws of physics” are not something given to us from on high. They are simply a mathematical representation of what we think is happening, or a way to describe how something behaves. The laws of physics (i.e. equations with coefficients) are used to make predictions, not some ordained fact. Your statement of “They are full of physics” as a way to assert truth or correctness of the models, is both meaningless and ignorant.
Tom Dayton @255: I downloaded CCC, but it appears to be a model to reconstruct the global temperature anomaly from land and sea records in GISTEMP. While I did ask for “any model”, I was really looking for something like a GCM, and (drum roll) I have finally downloaded CMIP3 source code.
Tom Curtis @ 256: I’m glad you chimed in – I like your responses the best. You provide nice data, graphs, and explanations. Some of the other folks here are a little combative or condescending. That can get me whipped up and want to lash back, and I really try to avoid that because it is not productive.
Based on your explanation, it seems that the forcing function for CO2 is more complicated than stated, and I fully expected that to be true. The coefficient of 5.35 isn’t static, but a function of the amount of clouds (and probably other things). It may be 5.35 for conditions seen today, but if the amount of clouds changes over time (which they will), then that equation begins to break down. This is what I mean when I say “all models are wrong.” This doesn’t mean they are not useful, but it means they are limited in their effectiveness because of the underlying assumptions. How GCMs handle this effect is critical across every equation they use. My primary concern is that almost every equation in GCMs have various limitations or assumptions because they are calibrated to measurements made recently. How those equations, coefficients, and assumptions hold up over time is critical for accuracy.
Tom Curtis @257: What model, or models, produced the chart in your example? I see that it is an IPCC chart, so it might be an aggregation of many models -- if so -- do you know which ones?
If I am reading the chart correctly, even if CO2 emissions were stopped in 2000, then the models predict that temperature will continue to increase at a low rate for far into the future. If this is correct, then I think we’re about to have one heck of a big test relative to solar activity. As everyone knows, the sun is entering an exceptional quite spell, and something that may approach the Maunder Minimum and the Little Ice Age. Many people, and myself included, believe that the sun plays a fairly large role in the climate, whereas many people here and in the peer reviewed literature believe it doesn’t. If global temperature falls in response to the quite sun, and CO2 continues to rise, I think this will be proof that the models and peer reviewed literature are not accurate enough in order to take action about curbing CO2 emissions.
JasonB @258: I followed your instructions and still failed. Trying to extract the ModelE1 tarball using Windows and WinZIP fails. However, I did go to my Linux machine and tried there using the ‘tar’ command, and succeeded. So now I have actual Fortran code for a 10 year old model. That’s a start, I guess. I fully expected this to be hard, if only because model developers and their organizations tend to be protective of their code due to competitiveness.
Moderator Response:[TD] Facts trump belief, so for the strength of the Sun's influence versus greenhouse gases see the counterargument to "It's the Sun," and note that it has Basic, Intermediate, and Advanced tabbed panes. For how much effect a Maunder minimum would have, see the Intermediate tabbed pane in the counter to "We're Heading Into an Ice Age."
Please help keep Skeptical Science comprehensible and therefore useful by putting your comments on the appropriate threads. Your comments are valuable to other people only if those people who are interested in your topics can find your comments. Someone interested in the accuracy of GCMs is not going to find your comments on that topic in this "CO2 is Saturated" thread, because they will be looking in the "Models are Unreliable" thread. Your off-topic comments in this CO2 is Saturated thread make it more difficult for people interested in the saturation topic to find comments that are related to that topic. Everybody else, please set a good example by replying in the appropriate threads to off-topic comments here. Stealth, you can see all recent comments regardless of the thread they are in by clicking the "Comments" link in the blue horizontal bar that is at the top of every page.
-
Alexandre at 21:49 PM on 17 July 2013Carbon Dioxide's invisibility is what causes global warming
Hey, I think I saw this coming!
There are no limits for denialism. Barton Paul Levenson recently quoted something that applies here:
Gegen Dummheit kämpfen Götter selbst vergebens.*
--Friedrich Schiller*against stupidity even gods fight in vain.
-
scaddenp at 19:05 PM on 17 July 2013Trenberth on Tracking Earth’s energy: A key to climate variability and change
Old sage - I havent seen much evidence that you have looked at any the text book physics so far, but I'd have to say "There seems to be a lot of misunderstanding here due to a little knowledge being a bad thing" made my day. The sticky details of the RTEs are done in this classic paper. Ramanthan and Coakley 1978 Perhaps you would like to fault it and provide an alternative theory that can reproduce the experimental results?
Moderator Response:[TD] Will everyone please help get the conversations onto the right threads, since Old Sage is not cooperating but his/her comments and everyone's responses are too useful to delete?
-
JasonB at 18:46 PM on 17 July 2013CO2 effect is saturated
Stealth,
As for getting source, I’ve chased down through many of the links provided and yet have been able to get to any source code. I recall doing this a while ago, and getting code is not as easy as you all imply.
Step 1: Click on the link I provided to RealClimate.
Step 2: Click on the very first link in the list, "GISS ModelE".
Step 3: Scroll down to the section "CMIP3 Model Configuration and Description". Where it says "The frozen version of the ModelE code used for CMIP3 simulations and the controls for model description papers is denoted as ModelE1 (internal version number 3.0, dated Feb. 1, 2004). This code can be freely downloaded (as a 1.2 MB gzip-ed tar file) from modelE1.tar.gz.", click on "modelE1.tar.gz". This is the source code for the version used in AR4.
Step 4: Un-zip and un-tar the source code from modelE1.tar.gz. I use 7-zip under windows.
Step 5: Open the "model" folder. Inside you'll find "all the model source code used in all possible configurations".
There are also instructions for downloading the historical forcings to be used as input. doc/modelE.html gives a brief overview. The NASA GISS page links to papers, etc.
I hope that wasn't too difficult.
The climate models seem to be coarse in resolution, and there seems to be uncertainty as to whether or not clouds are a positive or negative feedback.
Of course they're coarse. They're not trying to forecast weather, they're trying to forecast climate, and they're trying to do so in a reasonable time frame. You can predict that summer will be hotter than winter on average, and Miami will be hotter than Boston on average, without knowing what the exact weather will be on a micro-scale.
And as Tom points out, those uncertainties are already baked in to the forecasts. But note that the uncertainty about what we're going to do about AGW is larger than the models' uncertainties about what the consequences of each course of action will be.
Regarding clouds, the reason why we can't be certain whether they will be a positive or negative feedback is precisely because so far it seems to be a wash; the latest results indicate they may be slightly positive. If they were a strong feedback either way then it would be easy to identify. To argue that the models significantly over-state future warming on that basis is to argue that clouds will become signficantly negative in the future despite no evidence to support that — in other words, wishful thinking.
-
old sage at 18:29 PM on 17 July 2013Trenberth on Tracking Earth’s energy: A key to climate variability and change
There seems to be a lot of misunderstanding here due to a little knowledge being a bad thing. My physics dna prompted me to say co2 molecules were in the ground state so I tried to check and could only confirm this indirectly. I did find the figures for H2O - and these probably copy across reasonably well. The extra dimensions to the translational degrees of freedom have critical temperatures of 5170,5400,2290 degs K.
Glen Tamblyn - all radiation is quantised these numbers tell you just how high the temperature has to be to jiggle your molecule enough to radiate. (Of course, by QM there will always be the rare event corresponding to a freak combination of collisions) Also, fwiw, the surface of a body is primarily formed of outer electrons, it is their transitions stimulated by the underlying lattice which generate BB radiation. I do know the magnitude of difference thank you for atomic - and molecular energy transitions.
-
Tom Curtis at 14:25 PM on 17 July 2013CO2 effect is saturated
Stealth @254, of course the models have large margins of error. Have you not seen the error bars on the temperature predictions:

That does mean we might luck out and bring in a temperature increase of 2 C (the upper limit of what is considered safe) by 2100 even doing nothing; but we equally might get unlucky and see a temperature increase over 5 C. Further, the two scenarios are not equal, with the increase in damage for each extra C of increase in temperature being highly non-linear. Therefore rational policy making should weight the unfortunate outcomes more.
One thing is very clear, however, even given the wide margins of error. Not curtailing emissions will see temperature increases to values that have never been seen by Homo sapiens, and which are likely to radically reshape our world.
-
Tom Curtis at 14:14 PM on 17 July 2013CO2 effect is saturated
Stealth @252, from Myhre et al 1998, the mean global clear sky forcing of CO2 in 1994 was 1.78 W/m^2 (model range 1.759-1.8 W/m^2). The mean global cloudy sky forcing of CO2 was approximately 1.32 W/m^2 (model range 1.313 to 1.37 W/m^2). The global value for 1994 CO2 concentrations (358 ppmv) using their simple formula is 1.315 W/m^2. From that I deduce that by "cloudy sky" they meant what would now be called "all sky" conditions.
Although clouds will reduce the CO2 forcing, only thick clouds with very high tops will eliminate it entirely. Other than cumulo-nimbus clouds, most low clouds will have very little effect on the CO2 forcing because their tops are well below the altitude at which CO2 radiates to space. Those clouds still have a greenhouse effect because their absorb and radiate across the entire IR spectrum, including in regions in which well mixed gases do not absorb and radiate.
In the more recent Lacis et al (2010) (Preprint version) shows the clear sky CO2 greenhouse effect is 26% stronger than the all sky effect. The single factor addition effect (ie, no overlaps with water vapour) is 29% stronger than the all sky effect. That compares with about 33% stronger for Myhre et al.
-
Klaus Flemløse at 14:09 PM on 17 July 2013Nils-Axel Mörner is Wrong About Sea Level Rise
Many thanks for the comments on post No 80.
Prof Nils-Axel Mörner and Nils-Finn Munch Petersen are using photos to substantiate their claims of a falling sea levels at the Maldives. As I see it , they are using photos as an attempt to deliberate and manipulate readers to believe in their claims. None of the used photos support their claims of a falling sea level. They have chosen photos that have been changed by cutting and photo-shop manipulations.
There is a ongoing formation and decomposition of a coastline. Therefore, it is impossible from a picture to infer anything unless there is a systematic and comprehensive changes to a coastline over many years.
Their view of the water level at the Maldives may not be supported by scientific analysis.
Their view is repeated again and again in many newspapers and climate skeptic circles. Therefore it is necessary reply again and again. -
Tom Dayton at 13:50 PM on 17 July 2013CO2 effect is saturated
Stealth, how about Clear Climate Code?
-
StealthAircraftSoftwareModeler at 13:29 PM on 17 July 2013CO2 effect is saturated
As for getting source, I’ve chased down through many of the links provided and yet have been able to get to any source code. I recall doing this a while ago, and getting code is not as easy as you all imply. The NASA GISS ModelE is restricted to those with a nasa.gov IP address. When I try to download one of the ModelE snapshots, I just get an invalid ZIP archive. CESM from NCAR/UCAR only talks about the various versions, but I don’t see any accessible source code. EdGCM 4D appears to be built on top of ModelE and doesn’t provide source code. It looks like a pre built package that one can install and play with, but no source code. The subversion source code repository for CCSM4.0 requires a username and password.
Well, this is enough wasted time looking for model source code with no luck. I’ll look more at a later time. Have any of you that provided links (most of whom implied that I'm an idiot that can't do a 2 second Google search) actually download any source code for any model?
But I was stuck by this statement from the Azimuth project (http://www.azimuthproject.org/azimuth/show/Climate+model):
“General circulation models used to simulate weather and climate do not operate at fine enough grid resolutions to resolve many observed regional weather and climate features.”
This comment from the Met Office on the same page is also interesting:
“Clouds could create positive or negative climate feedbacks and are an ongoing area of research. One example is low-level clouds, especially stratocumulus, which help reflect sunlight and keep the Earth cool. The more stratocumulus we get over the planet, the more cooling effect. If our warming climate creates more low cloud, this would be a negative feedback — helping to offset the heating by reflecting more sunlight away from Earth. If our current climate change means there will be less low cloud overall, then this would be a positive feedback — contributing further to the warming by allowing more sunlight in.”
The climate models seem to be coarse in resolution, and there seems to be uncertainty as to whether or not clouds are a positive or negative feedback. This seems to be an admission that the models a) do not model clouds well, and b) that they could either warm or cool the planet, and c) induce a lot of doubt about the accuracy of the models. How do you develop so much confidence in the accuracy of the climate models when the model developers make statements like this? They seem to be agreeing with me and saying there is sizable uncertainty.
Moderator Response:[TD] Cloud feedback claimed to be negative is covered here. But the bottom line of course is how well the models have actually performed, both in hindcasting and in forecasting; that topic is covered here. If the models perform well enough to tell us what action we should take, then it really doesn't matter whether anyone personally believes that they should perform poorly, nor does it matter how much they might be improved.
-
KR at 13:10 PM on 17 July 2013CO2 effect is saturated
Stealth - "Is the 5.35 value true for clear skies only, or entire average of the whole atmosphere?"
Myhre 1998 refers to and builds upon Myhre 1997, which states that "Spatial and temporal variation in the radiative forcing due to variations in temperature, humidity, and cloudiness has been taken into account on the basis of observed data." This supported the rational for (and accuracy of) using multiple atmospheric columns in computing the Myhre 1998 results. So, yes, the CO2 forcing function is for the atmosphere as a whole, not just clear skies.
-
StealthAircraftSoftwareModeler at 12:48 PM on 17 July 2013CO2 effect is saturated
Scaddenp @242: I don’t think I’m confusing models. I think understand the differences between them and their various purposes, at least in a high-level way.
As for the 5.35 value, I read a paper (which I cannot find now) that was trying to find the CO2 finger print in satellite measurements, and they only looked at clear skies over the Pacific Ocean. I thought it was Harries et al 2001, but it must have been something related. Nevertheless, the forcing value for CO2 has been stated as:
ΔF = 5.35*ln(C/C0) W/m2
Is the 5.35 value true for clear skies only, or entire average of the whole atmosphere? Others in this thread have implied that this is the forcing for CO2, which implies all conditions. But the empirical measurements seemed to be done only for clear skies. If it has been measured in clear skied only, then what does the forcing equation look under cloud conditions? If clouds completely absorb all IR in the bands that CO2 can affect, then this would imply that CO2 cannot absorb any more and the forcing function would be zero when there are clouds. If 65% of the earth is covered with clouds then wouldn’t the 5.35 value be multiplied by .35 since only 35% of the sky is clear? This would imply that the value is 1.87. Or, is the value for clear skies really 15.29 and then when it is averaged over the globe it becomes 5.35? I am not making any claims about the value, just asking if this forcing equation for CO2 is valid through clouds.
-
villabolo at 12:28 PM on 17 July 2013Carbon Dioxide's invisibility is what causes global warming
Abbot: "invisible, odourless, weightless, tasteless substance".
Invisible: So is the oxygen in our atmosphere which would only burn us down if it were to double in proportion to the other gases.
Odourless: So is Methane.
Weightless: Take some physics. A Carbon Dioxide molecule has more "weight" - mass than an oxygen molecule.
Tasteless: It makes for a great flavor in phizzy drinks.
Prev 861 862 863 864 865 866 867 868 869 870 871 872 873 874 875 876 Next


