


 Arguments


Recent Comments
Prev 862 863 864 865 866 867 868 869 870 871 872 873 874 875 876 877 Next
Comments 43451 to 43500:
-
MrGibbage at 02:14 AM on 16 September 2013It hasn't warmed since 1998
So, if the point of this page at SkepticalScience is to suggest that the planet hasn't been cooling since 1998, and has in fact been warming, then who do we believe? Dr. Fyfe, who suggests that it hasn't cooled or warmed, or Skeptical Science? Does this page need to be updated?
-
Lanfear at 01:38 AM on 16 September 2013Medieval Warm Period was warmer
"I think the problem that some people are having with the Little Climatic Optimum concept is not so much as to whether temperatures were a little warmer then than now or vice versa. That is largely irrelevant."
I don't know about the other commenters here, but as far as my view goes, you have a serious problem of being myopic in your arguments. And as such it is strictly your and not my problem. Maybe you should actually read what other commenters respond to your writings, instead of 'thinking' what their motivations might be?
"The real problem is that the temperature seems to have undergone a long, hundreds of years cycle, in Greenland in which human produced atmospheric carbon couldn't have played much of a role."
'Seems'? Based on what? Do you even realize that you are solely arguing for a warm(er) Greenland in the time of ca. 1200-900 bp? And that your basis is only in the anecdotal oral stories which were only later written down? If you still fail to show any actual material to support your assertions, then you are merely mixing in two other often recited myths, "It's a natural cycle" and "It's not us" through the non sequitur-fallacy.
As for the irrelevance that you talked earlier, your arguments are irrelevant as long as you continue repeating the same stuff over and over again, without providing any actual material.
Moderator Response:[JH] Spoonieduck has now been officially warned about excessive repitition and sloganeering.
-
spoonieduck at 23:59 PM on 15 September 2013Medieval Warm Period was warmer
Tom,
I don't believe that Iceland then or now is "less verdant" than Greenland. Quite the contrary. Even during the medieval period, the Greenland settlements' total population hovered at 10% that of Iceland. I'm not saying that temperatures aren't warmer now than they were 100 years ago. One poorly documented internet site I've come up with claims that the growing season in southwestern Greenland is 3 weeks longer now than it was not so many years ago. Then again, I came up with another not so well-documented site, that claims that temperatures now--in the same area--have plunged 1.0-1.6 C, although they predict that temperatures will rise 2.0C by 2100.
I'll refer you to Dugmore et al, Arctic Anthropology, 2007. Dugmore is supportive of climate change theory and believes the colony collapse to be multifactorial, although he believes Greenland cooling, with reduced growing season and increased sea ice--tougher for trade vessels and harder for Norse hunters to access herds of Walrus--was a major factor.
Dugamore and Rachel Bold [Norse Utilization of Archaebotanical Resources with the Myvatssvert locale, Northern Iceland, Dept. of Arch., Durham University, 2011] describe a biota in what became the Eastern and Western colonies far different than today. Bold: [I'm paraphrasing]: "Greenlad attracted settlers with its wide open grassy spaces close to the coast. Remaining land deemed suitable for occupation was predominantly covered in dense scrub--birch and willow in the Eastern Settlement, with the addition of alder in the Western Settlement. Land clearing, manually, and by burning was necessary to increase agricultural utility as evidenced by a thin black deposit underlying the occupational layer of the Western Settlement." Note: There is only one tiny "National Forest" today in southern Greenland composed of dwarf birch and willow.
Therefore evidence suggests the possibility that southwestern Greenland was undergoing a warm period before the Vikings ever arrived. We can't know for certain, of course, because, as I wrote to Michael Sweet, "The Vikings didn't carry thermometers."
On to Erik or Erik. You are correct and quoted the Saga accurately, but I'll paraphrase Dugmore, who references the same line. I'd like to quote him perfectly but my printer is on the fritz so I had to scribble it down. "Despite Erik's sales pitch, it is unlikely that the traditionally strong-willed Viking women and mothers could have been lured to go to and/or stay in a marginal land." My point exactly. Certainly, Erik wanted to see his settlements grow but an outright lie would have provoked a blood feud that he couldn't have survived. Erik's "Green Land" was--at least in a few isolated areas--a "Green Land" suitable for settlement.
I think the problem that some people are having with the Little Climatic Optimum concept is not so much as to whether temperatures were a little warmer then than now or vice versa. That is largely irrelevant. The real problem is that the temperature seems to have undergone a long, hundreds of years cycle, in Greenland in which human produced atmospheric carbon couldn't have played much of a role.
Moderator Response:[JH] You are now skating on the thin ice of sloganeering and excessive reptition -- both of which are prohibited by the SkS Comment Policy. Please cease and desist, or face the consequences.
-
Lanfear at 23:47 PM on 15 September 2013Medieval Warm Period was warmer
"Lastly, we just don't know. Unfortunately, and unlike today, the Norse didn't have thermometers. If they had them in Greenland, used them frequently, recorded the results for posterity, we wouldn't be having this discussion now"
Why do you expect the only way to get the temperature from past to be by the way of thermometers? Or reinterpreting the, initially oral, history tales?
It is as if you deliberately want to avoid looking at the multitude of reconstruction graphs, linked both to the article, as well as previous commenters.
And if your objection to them is that they are too general (being global or NH-centric), then I would point out that Kobashi et al. 2011, did reconstruct the temperature located on Greenland.
It is considered poor form to disregard other evidence and just concentrate on one detail in order to carry on an argument.
-
spoonieduck at 23:19 PM on 15 September 2013Medieval Warm Period was warmer
Michael,
One of the primary justifications for this particular thread is historical accounts of a so-called medieval warming trend i.e. written histories. If it weren't for the histories--oral and written accounts--researchers [in my opinion] wouldn't be much concerned about anomalies in pollen samples, ice cores, sediments, tree rings from this period of time.
The Sagas i.e. Icelandic Sagas, Saga of the Greenlandders, Vinland Saga are some of the primary sources. Yes, Diamond wrote "Collapse" amongst other pop science histories. I haven't read it, yet, but reviewed his interesting "Guns, Germs and Steel." In a similar vein, I suggest "West Viking" by Mowat who supports the concept of the "Little Climatic Optimum."
Science is, of course, a generally materialistic approach to get at the truth and is usually best handled in a multidisciplinary fashion. It is not adequate to say "things were colder" in the face of historical testimony that things may have been "warmer". You may be right but you have to back it up.
Back to Diamond, Mowat and Dugamore et. al., Arctic Anthropology, 2007. None of these authors--including Diamons--dispute a medieval Greeland warming trend. After all there were two [East and West] Norse Greenland Settlements that existed for 450 years, from about A.D. 985 to at least A.D. 1427. Deteriorating cold weather was a major factor in the ultimate retreat from Greenland.
The various authors above also believe--entirely correctly--that the colony collapse was multifactorial. Political disruptions in Norway with reduced trade were possibly important. They also believe that the Norse were "slow learners" and might have hung on if they'd adapted eskimo lifestyles. I find the last contention amusing. It's almost like stating that the Aztecs might have defeated the Spaniards if they had guns.
Lastly, we just don't know. Unfortunately, and unlike today, the Norse didn't have thermometers. If they had them in Greenland, used them frequently, recorded the results for posterity, we wouldn't be having this discussion now.
-
MA Rodger at 21:31 PM on 15 September 2013Arctic sea ice delusions strike the Mail on Sunday and Telegraph
Or try here for the AR4 graphic.
-
MA Rodger at 21:29 PM on 15 September 2013Arctic sea ice delusions strike the Mail on Sunday and Telegraph
Here is the link to the latest David Ruse nonsense in the Rail on Sunday mentioned @3. An interesting quote from Myles Allen apparently made "last night" that will likely get some discussion. The headline pronouncement of the nonsense is effectively debunked by this AR4 graphic showing the 1956-2005 trend that Ruse says has been revised so much in the final draft AR5 that he say he's got hold of. He (or his paper) also takes ambiguous credit for their early detection of "the global warming ‘pause’ first reported by The Mail on Sunday last year."
-
funglestrumpet at 20:39 PM on 15 September 2013Arctic sea ice delusions strike the Mail on Sunday and Telegraph
Jim Hunt @ 1
I wish you the very best of luck. It is difficult to see how we stop such people unless they face some form of meaningful sanction, though I have my doubts that any complaint to the PCC will result in such.
It would be better for the U.K. media at least to face another Leverson type enquiry, but this time on the deliberate publication of misinformation on climate change, surely a more important issue than the hacking of some celebrity's 'phone in order to discover who they were sleeping with - information that will be long forgotten by this time next year, or even next week, let alone by the time climate change is wreaking its seemingly inevitable havoc, I fear.
P.S. - Great graphic on your 'Great White Con' link! Have you offered it to the Mail and Telegraph? I am sure they would jump at the chance to show graphically what they are obviously trying (and failing) to say in words, being such honest and upstanding fellows that they are, of course.
-
Jim Hunt at 18:49 PM on 15 September 2013Arctic sea ice delusions strike the Mail on Sunday and Telegraph
In reality I fear the PCC has far less teeth than a great white shark, and that US legal precedents don't carry a whole lot of weight over here in the UK. Nevertheless we shall pursue matters to the bitter end!
David and Judy are on show again in the Mail this Sunday morning. More over on the Arctic Sea Ice Blog. -
John Mason at 17:26 PM on 15 September 2013Arctic sea-ice 'growth', a manufactured IPCC 'crisis' and more: David Rose is at it again
There's a typo in that latest one (which has even more of a squawk-factor):
For example, in the new report, the IPCC says it is ‘extremely likely’ – 95 per cent certain – that human influence caused more than half the temperature rises from 1951 to 2010, up from ‘very confident’ – 90 per cent certain – in 2007.
Prof Curry said: ‘This is incomprehensible to me’ – adding that the IPCC projections are ‘overconfident’, especially given the report’s admitted areas of doubt.
should read:
For example, in the new report, the IPCC says it is ‘extremely likely’ – 95 per cent certain – that human influence caused more than half the temperature rises from 1951 to 2010, up from ‘very confident’ – 90 per cent certain – in 2007.
Prof Curry said: ‘This is incomprehensible - to me’ – adding that the IPCC projections are ‘overconfident’, especially given the report’s admitted areas of doubt.
The well-trained parrot strikes again!
-
Lars Karlsson at 15:34 PM on 15 September 2013Arctic sea-ice 'growth', a manufactured IPCC 'crisis' and more: David Rose is at it again
David Rose, even worse than before:
“Global warming is just HALF what we said: World’s top climate scientists admit computers got the effects of greenhouse gases wrong.”
“As things stand, the atmosphere is expected to have twice as much CO2 as in pre-industrial times by about 2050. In 2007, the IPCC said the ‘likeliest’ figure was 3C, with up to 4.5C still ‘likely’.
Now it does not give a ‘likeliest’ value and admits it is ‘likely’ it may be as little as 1.5C – so giving the world many more decades to work out how to reduce carbon emissions before temperatures rise to dangerous levels.”
-
Philippe Chantreau at 02:00 AM on 15 September 2013Global Warming’s Missing Heat: Look Back In Anger (and considerable disbelief)…
Perhaps today, a few visits to the planet Wattsupia would serve the same purpose for somebody who was capable of scientific analysis. However, for those who are not, Wattupia would not be worth visiting.
I disagree with that. WUWT is not worth visiting under any circumstances.
-
dvaytw at 23:24 PM on 14 September 2013In Wall Street Journal op-ed, Bjorn Lomborg urges delay with misleading stats
Here's his latest along these lines:
-
Tom Curtis at 22:45 PM on 14 September 2013Medieval Warm Period was warmer
Spoonieduck @189, the relevance of modern photos of Greenland and Iceland is that current temperatures in those nations are comparable to those in the MWP. If Iceland is more verdant now (as it clearly is), it follows that it was more verdant then - and the name "Greenland" is, therefore, not explicable by the unusual greenness of the land.
I am unsure why you want to explore a counterfactual hypthetical. Greenland (or at least, those portions of it colonized by the norse) was not "a pile of frozen rocks fit only for arctic wildlife". Colonies were established there, and survived several centuries. So Norse settlers decieved by Eric's clever naming would have found a land less verdant than those from which they came, contrary to what the name suggests - but one in which it was still possible to survive and make a living.
In any event, we do not need to speculate as to why Eric called Greenland "Greenland":
" Eirik and his people were outlawed at Thorsnes Thing. He prepared a ship in Eiriksvagr (creek), and Eyjolf concealed him in Dimunarvagr while Thorgest and his people sought him among the islands. Eirik said to his people that he purposed to seek for the land which Gunnbjorn, the son of Ulf the Crow, saw when he was driven westwards over the ocean, and discovered Gunnbjarnarsker (Gunnbjorn's rock or skerry). He promised that he would return to visit his friends if he found the land. Thorbjorn, and Eyjolf, and Styr accompanied Eirik beyond the islands. They separated in the most friendly manner, Eirik saying that he would be of the like assistance to them, if he should be able so to be, and they should happen to need him. Then he sailed oceanwards under Snœfellsjokull (snow mountain glacier), and arrived at the glacier called Blaserkr (Blue-shirt); thence he journeyed south to see if there were any inhabitants of the country. He passed the first winter at Eiriksey, near the middle, of the Vestribygd (western settlement). The following spring he proceeded to Eiriksfjordr, and fixed his abode there. During the summer he proceeded into the unpeopled districts in the west, and was there a long time, giving names to the places far and wide. The second winter he passed in Eiriksholmar (isles), off Hvarfsgnupr (peak of disappearance, Cape Farewell); and the third summer he went altogether northwards, to Snœfell and into Hrafnsfjordr (Ravensfirth); considering then that he had come to the head of Eiriksfjordr, he turned back, and passed the third winter in Eiriksey, before the mouth of Eiriksfjordr. Now, afterwards, during the summer, he proceeded to Iceland, and came to Breidafjordr (Broadfirth). This winter he was with Ingolf, at Holmlatr (Island-litter). During the spring, Thorgest and he fought, and Eirik met with defeat. After that they were reconciled. In the summer Eirik went to live in the land which he had discovered, and which he called Greenland, “Because,” said he, “men will desire much the more to go there if the land has a good name.”]"
A counter argument based on assuming the alternative to a Greenland less verdant than Iceland is a Greenland having no colonizable lands at all is hardly a sound basis to reject the reasons given by the Nords themselves, and attributed directly to Eric.
-
michael sweet at 20:52 PM on 14 September 2013Medieval Warm Period was warmer
Spoonieduck:
The problem is that your "detailed discussions" of Vikings amount to uninformed speculations about behaviour you know nothing about. Your suggestions that your vague knowledge of Viking sagas, presented here without any documentation, is "historical evidence" is worthless. Have you ever read a Viking saga or a reasoned analysis by someone who has read them? I have. Link to a scholarly article summarizing the sagas and I will discuss it with you. Discuss what you learned in elementary school at WUWT. There is a wealth of archaelogical data and saga analysis about early Viking settlements, some of it referenced in Collapse (which I have read so I know more than an elementary school student).
This is a scientific board. Speculations about how you might feel when you arrived in Greenland and it was too cold for crop farming are completely inappropriate. It is currently warmer in Greenland than it ever was for the Vikings. The Vikings were not able to grow vegetable crops like those currently grown in Greenland. They raised cattle and sheep.
A significant part of the reason Vikings went to Greenland was to obtain walrus ivory, polar bear skins and Gyrfalcons. Perhaps the settlers were ecstatic because of the Gyrfalcons and did not care about farming. Why havn't you mentioned these items which were available on Greenland? Because you don't know what you are talking about. Provide citations to support your opinions or stop bothering us. Looking back through this thread you have provided not a single reference to support your wild speculations.
-
profraywills at 18:49 PM on 14 September 2013Arctic sea ice delusions strike the Mail on Sunday and Telegraph
Well if US courts respect and uphold climate science, presumably a Press Complaints Commission might follow legal precedent.
-
One Planet Only Forever at 15:41 PM on 14 September 2013Debunking 97% Climate Consensus Denial
Tom Curtis, I appreciate that your comment indicates the cost of mitigation should be comsidered to be less than the future costs created without tat mitigation, but that is still playing into the delayer/denier game of discussing the relative evaluation. They will claim there is no concensus about the relative values.
It is simply unacceptable for a current generation to enjoy benefits from actions that create any potential problem for a future generation. It is even more uncceptable to discuss the comparison of the magnitude of the problem being created with what the current generation thinks they deserve to benefit from.
-
spoonieduck at 15:32 PM on 14 September 2013Medieval Warm Period was warmer
Michael,
I know that you don't care about my grade school recollections but the issue is nevertheless significant. This site shows abundant sophisticated charts, graphs and calculations and I am duly impressed. Still, most of these graphics are, in a real sense, highly indirect, when they apply to climatic events many hundreds of years ago.
Most of this evidence--tree rings, Sagasso Sea sediments even ice cores--is indirect and subject to various interpretations. Historical evidence, despite its problems, is more direct. Yes, there are problems with Viking Sagas. Most weren't written down until 300 years or so after the events, leaving plenty of room for error. Prior to this they were oral tales, probably recited for entertainment.
The other problem with the Sagas is that the events are very much local. It is quite conceivable that Southwestern Greenland was relatively warm, maybe even warmer than today, 1000 years ago. It is even possible that the frost line along the East coast of North America was farther north 1,000 years ago than it is at present. Maybe.
Even if true, none of this proves that the entire world was warmer then nor does it disprove that the earth is presently entering a dangerous warming trend. It certainly doesn't disprove that excessive atmospheric CO2 is contributiing to the current warming trend.
-
spoonieduck at 15:07 PM on 14 September 2013Medieval Warm Period was warmer
Tom,
How are photographs of Iceland apropo to conditions in southwestern Greenland between A.D. 1,000 and A.D. 1,400?
Detailed discussions of Viking violence are probably a bit afield for this specific topic but Erik didn't directly deceive anyone. He had been outlawed in both Norway and Iceland for successive murders, which is why he traveled west to Greenland [Saga of the Greenlanders].
Your other iteration that Erik was simply trying to convince.....etc. is simply a repeat of your previous statement. I'll try to put it another way. What if you were deceived into putting your entire family at the considerable risk of a hazardous sea voyage in an open boat? What if, on reaching your Greenland destination you found it a pile of frozen rocks fit only for arctic wildlife? Of course, I don't know how you would have reacted but I would have been truly upset. At a bare minimum, I would have packed up my family and left as soon as it was feasible--that is, if we didn't starve or freeze to death in the meantime. I certainly wouldn't have celebrated Erik as a great chieftain.
-
WheelsOC at 15:07 PM on 14 September 2013Global Warming’s Missing Heat: Look Back In Anger (and considerable disbelief)…
Another important fact to bring up whenever the models "fail to predict" a particular lull in the real-world data is that the climate models are not meant as forecasts like the weather. They are not modeling what the temperatures will be five years from now.
They are not concerned with the particular timing of any given event, be it a La Nina dominant decade or a huge volcanic eruption or a particularly lengthy solar minimum.
So of course the models don't "predict" the apparent pause from the last decade or so. They aren't supposed to be predicting any decade's metrics precisely. They are not a prognostication of what will happen in the real world the way a five-day forecast of the weather is supposed to represent what will really happen.
What they are supposed to do is model the physics that determine the underlying long-term patterns. The particulars of those experiments are determined by scenarios that are not expected to be crystal ball pronouncements; they are only expected to give certain inputs that the climate model will then churn through and produce an output based on our best understanding of how the climate works. You don't run a climate model to determine that there's a 70% chance of strong El Nino conditions this time four years from now, so dress light.This lack of "weather forecast" functionality for climate models need sto be emphasized more often and more loudly. We often say that "climate is not weather" when it is time to discuss why a massive blizzard doesn't mean global warming stopped. We also need to start saying that "climate models are not weather forecasts." As long as people think that they are forecasts, we will hear this zombie argument moaning from the grave. It's bad enough that we all hear the lame refrain "They can't even predict the weather tomorrow, how are they supposed to predict the climate?"
-
dvaytw at 13:54 PM on 14 September 2013Arctic icemelt is a natural cycle
In reference to my own question at #59: in case anyone else encounters this argument, I dug up the answer myself. This is from Joe Romm, and addresses that "single factor" talking point nicely:
-
davidnewell at 13:07 PM on 14 September 2013Debunking 97% Climate Consensus Denial
Absolute agreement with following:
(29:One Planet Only Forever)
"The understanding that it is essential to develop truly sustainable ways of life that all humans can develop to and improve on forever needs to be the fundamental principle guiding all decisions about "acceptable human behaviour".
Popularity cannot be allowed to influence decisions about what is acceptable. "
==================
How can there be any argument with that? We are reaping the consequences of NOT adhering to these simple declarations. In a closed system "what goes around comes around".
Everywhere you look, there are UNsustainable realities: population, city growth, pollution, water use, etc etc... All interrelated, nothing separate.
What is civilization "worth"? What is the human race "worth"? What is all life on this planet "worth"?
-
Tom Curtis at 10:43 AM on 14 September 2013Medieval Warm Period was warmer
spoonieduck @185, ok, you have convinced me. How, after all, could this not be considered a greenland:
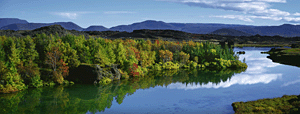
Whoops. Sorry, wrong picture. That is Iceland, where before Norse settlement "Birch and willow forests like this one at Lake Mývatn used to cover much of Iceland's interior." In contrast even the inhabitable portions of greenland have never sported more than grasses:

Oddly, Iceland was names as such because, during an early attempt at settlement, drift ice was spotted in the harbour in winter.
This is the first reason why your argument fails. No matter what else, Eric was trying to convince settlers (whether from Norway or from Iceland) to move into a harsher, less productive environment. If it were ill advised to do that due to the "Vikings were truly violent people", then it were ill advised whether he used a bit of subtle persuasion by his choice of name.
The second basis on which your argument fails is that the "Vikings" were not a truly violent people, or at least not more so than most other European peoples of the time. The norse have a reputation for violence because they went viking (ie, on naval expeditions for raiding). To conclude from that that they were unusualy violent would be like concluding the English were unusualy violent based on French accounts of Agincourt (or on reading Shakespears plays). Yes, the Norse could be violent at home, but were not unusually so.
The basic fact you must account for is that even those small parts of Greenland that are ever green are not so when compared to Iceland or Norway. Therefore the name Greenland, even if only confined to those locations, must involve some creative embelishment.
-
Rob Painting at 09:57 AM on 14 September 2013Medieval Warm Period was warmer
The paleoclimate scientific community seems to agree that southern Greenland was warm during the Medieval Period. See the spatial pattern below from Mann (2009).

Most of the world was much cooler than present though (as shown above). This is why sea level in the equatorial regions was falling throughout the Medieval Period. No such thing is happening today because the current human-caused warming is globally coherent.
-
michael sweet at 09:48 AM on 14 September 2013Medieval Warm Period was warmer
Spoonieduck,
Instead of speculating about what conditions were in Greenland in the 1,000's why don't we read something scientific about it!! What a novel idea, find out what is already well known instead of making up stories!! According to Collapse by Jahred Diamond, it was too cold to raise any vegetables in Greenland during the Viking settlements. They did collect forage during the summer for their cattle, but no plant farming. Currently there are over 100 tons of potatoes grown along with plentiful cabbages. It is only in the last 20 years that it has become warm enough to grow potatoes.
This is a scientific board. No-one cares what you remember from elementary school. Provide citations for your opinions or stop your nonsense.
-
spoonieduck at 08:15 AM on 14 September 2013Medieval Warm Period was warmer
No, Rob, I'm not. Apparently only parts of southwest Greenland were habitable by Europeans with European technologies at the time.
-
spoonieduck at 08:11 AM on 14 September 2013Medieval Warm Period was warmer
Tom,
I thought I already addressed part of your statement. We were taught as children that Erik the Red falsely promoted Greenland as a Green Land to lure unwary and naive Scandinavians to his new colony.
Let's examine that belief a little more closely. The Vikings were truly violent people as retold in my of their Sagas and retold in the AngloSaxon Chronicle amongst others. Now let's say a group of Norwegian or Icelandic Vikings bought into Erik's propagandistic lie that Greenland was a Green Land and a great place to settle and raise a family. After sailing with their families--women and children--and livestock ater a long, nervous voyage in open Knorrs over dangerous northern seas, they come to southwestern Greenland, little more than frozen, barren rock with little more to eat than birds' eggs, fish and walrus blubber. How long do you reckon that Erik would have lasted?
Now, the Vikings did settle in southwestern Greenland. Archaeologists have found their settlements complete with church and structures that were probably animal overwintering facilities. I don't know if you have much experience with livestock but, obviously, they must be fed year round, not just in the summer. In northern climates, farmers put up hay in the plentiful summer months to feed their stock during the winter months. This presupposes the presence of quite a lot of grass and other forage during the warm months of the year.
-
K.a.r.S.t.e.N at 06:25 AM on 14 September 2013The Pacific Ocean fills in another piece of the global warming puzzle, and puzzles Curry
Kevin, yet another addendum:
The mentioned offset in the volcanic forcing in the Potsdam or Meinshausen et al. 2011 data, resp, is in fact a deliberately chosen nominal positive forcing of 0.2 W/m2 in order to obtain consistency between the historical period and the future forcings. The idea is to account for the average planetary energy imbalance caused by past volcanic eruptions. The very imbalance which causes the climate to warm as soon as a volcanically quiet period occurs. Or in other words, it is the forcing equivalent to the volcanic deep ocean cooling I mentioned earlier, which tends to cool the planet for a very long time (in the way hypothesized above). Of course, it is a crude average estimate, but better than nothing. Preferably, the CMIP5 GCMs would be spun up for a millenium or so before the actual simulation period of interest is run (in order to make sure the model is in quasi-equilibrium according to historic volcanic activity). See Gregory et al. 2013 for more details (I just had the pleasure to listen to a talk of Jonathan, during which everything became crystal clear all of a sudden ;-)).
So everything correct. I just didn't connect the dots properly.
-
Rob Honeycutt at 05:27 AM on 14 September 2013Medieval Warm Period was warmer
Spoonieduck... I just want to clarify something. You're not assuming the most of Greenland was actually green, are you?
-
Tom Curtis at 04:39 AM on 14 September 2013Global Warming’s Missing Heat: Look Back In Anger (and considerable disbelief)…
keitho, consider the following graph by John Nielsen-Gammon:
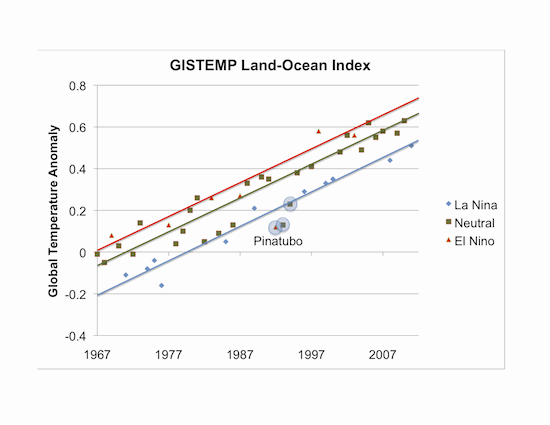
In it, he shows the linear trend for El Nino, ENSO neutral, and La Nina years seperately. Each trend is approximately the same, and none of the three trends shows any slow down. Given this, we must conclude that either:
1) The underlying temperature trend has remained unchanged over recent years, with any apparent slowdown being primarilly the result of ENSO fluctuations; or
2) The apparent slow down in the temperature trend is real, the apparent ENSO related patterns in the graph are coincidental, and ENSO has no influence on global temperature.
Which conclusion do you accept?
Because if it is not one, it is you who is running headlong from the data to preserve your favoured theory!
-
Tom Curtis at 04:26 AM on 14 September 2013Medieval Warm Period was warmer
spoonieduck @178, although at the time of Eric the red, some (small) sections of southern and western greenland were green (grass covered) in summer, they were less so than the settled areas of Iceland, and certainly less so than Norway and Denmark. Furthur, it is highly likely that Eric, having determined to establish an independent colony would want to attract fellow norsemen to his cause (thereby increasing his stature and power should he ever "go viking"). Of course, that explanation presupposes that some part of Greenland was at least sufficiently green that Eric wanted to settle there.
-
John Hartz at 04:11 AM on 14 September 2013Global Warming’s Missing Heat: Look Back In Anger (and considerable disbelief)…
Keitho:
Do you agree or disagree with the following statement by James Hansen:
"Climate is a complicated system but there is no change at all in our understanding of climate sensitivity [to carbon dioxide] and where the climate is headed," he said. "Our understanding of sensitivity is based on the Earth's history, not on climate models, and we have good data on how the Earth responded in the past when carbon dioxide changed. So there is no reason to change the forecast for the long term."
Source: Global warming has not stalled, insists world's best-known climate scientist by Damian Carrington, The Guardian, May 17, 2013
-
Tom Curtis at 04:10 AM on 14 September 2013Debunking 97% Climate Consensus Denial
OPOF @29, you have clearly misuderstood what I wrote. I specified the range of damage estimated that IMO can reasonably be held regarding BAU. The lower end of that range is costs significantly greater than the cost of mitigation. Nothing in that statement implies in anyway that it is acceptable to incur those costs against future generations for the benefit of reduced costs by avoiding mitigation today. Indeed, for the majority of still living humans (anyone under 40) the cost within their lifetime of not mitigating is likely to be higher than the cost of mitigating.
-
michael sweet at 04:08 AM on 14 September 2013Medieval Warm Period was warmer
Spoonieduck
Instead of describing vague "sagas" you have read about on the internet you could refer to peer reviewed studies of Greenland. Jahred Diamond summarized much of this work in his book Collapse, on how societies in the past have collapsed from environmental change, some of it self inflicted. In spite of your vague suggestions, it is actually well known what conditions were in Greenalnd during Viking occupation. Why don't you do some serious reading and find out what is known?
As you have been told before, this is a scientific site. Vague descriptions of "sagas" without any references are handwaving and have no place in scientific discussion. Please start to present sources for your wild speculations.
-
spoonieduck at 02:38 AM on 14 September 2013Medieval Warm Period was warmer
DSL,
I wrote "goats' when I should have written "sheep."
-
spoonieduck at 02:34 AM on 14 September 2013Medieval Warm Period was warmer
DSL,
I forgot to list a sixth possibility i.e. the Vikings could have been lying. We were taught, as children that Erik the Red's naming of "Greenland" was a propaganda ploy to lure naive Icelandic and Norwegian settlers to Greenland [this is extraordinarily unlikely given the violent nature of the Vikings]. Conceivably, his successors might have been using propagandistic terms to describe the North American "Vinland".
On the other hand--and directly apropo to this site--it all may have been the literal truth. Southwestern Greenland may, indeed, have been a Green Land i.e. grassy, during the warmer months, one thousand years ago. The sagas tell us that the settlers were able to graze cattle and goats close to their several settlements. Not only that, but they were able to overwinter their stock which means that the settlers were able to harvest enough forage during the warm months to feed their stock during the snow-bound winter.
The same is likely true of "Vinland". Not only did the Vikings describe a "grape land", but they also stood amazed at its bounty. Of course, everything may simply be comparative. Even if Greenland were relatively lush 1000 years ago, Nova Scotia, at some distance South of the Greenland settlements, must have seemed bounteous, indeed.
Moderator Response:[DB] This is NOT a site to discuss speculative fiction. If you have a citation to a reputable source to support your claims, then please provide it.
Failing that, please refrain from such and instead discuss matters of science.
-
One Planet Only Forever at 02:34 AM on 14 September 2013Debunking 97% Climate Consensus Denial
Tom Curtis@28
I would encourage you to stop legitimizing the denialist argument that "Reasonable estimates range from economic damage significantly greater than the cost of mitigation...".
The comparison of the "cost of mitigation faced by a current generation" with "that current generation's estimate of the future economic damage it is inflicting on a future generation" in not a "reasonable thing to do".
More important is how sustainable a human activity is. Humanity should be planning to be living forever on this one and only planet. That would mean developing ways of living that can be continued forever. The way of living that has recently developed due to the burning up and consumption of non-renewable resources is fundamentally not sustainable. It is definitely popular, but everyone cannot develop to live the life of the most fortunate which is socially not sustainable. Actually, even just the few most fortunate would not be able to live their lifestyle forever.
The understanding that it is essential to develop truly sustainable ways of life that all humans can develop to and improve on forever needs to be the fundamental principle guiding all decisions about "acceptable human behaviour".
Popularity cannot be allowed to influence decisions about what is acceptable. That won’t have a 97% consensus of popular opinion, but it is the only way for humanity to have a better future for all life on our ones and only planet.
-
Global Warming’s Missing Heat: Look Back In Anger (and considerable disbelief)…
Keitho, models can always be improved. I wouldn't call model projections of surface temp "seriously wrong," though. After all, observed GMST is still within the 95% confidence range for CMIP3 ensemble modeling. True, GMST has swerved negative relative to the ensemble model mean, but if you can tell me what the ensemble model mean is worth in terms of science, I'd be much obliged. If you want seriously wrong, try Arctic sea ice projections. Ocean heat content is rising as expected. Sea level is rising at the top edge of projections. Changes to general circulation are happening as expected. Global ice mass loss is happening as expected. The physical mechanism of AGW, the greenhouse effect, remains unchallenged. Natural forcings are net negative over the last 50 years. Regardless, people continue to look for some way to say, "it's not happening."
-
gpwayne at 02:01 AM on 14 September 2013Global Warming’s Missing Heat: Look Back In Anger (and considerable disbelief)…
Keitho - Two points:
"You really can't go on about "the science" if empirical measurements don't support your position".
First: I don't have a position. Everything I've stated, or alluded to, is entirely consistent with current climate science. On climate change science, I don't need a 'position' any more than I need an opinion. I read the science, and simply report what it says, in full or in summary.
Second: The empirical evidence does support what I've said in my post. Surface temps are increasing, but at a slower rate than in previous decades. Oceans are warming, which we know by dint of an accelerating rate of sea level rise, and by sticking a thermometer in the water and reading what it measures.
(And thanks to CBDunkerson for stalwart services)
-
keitho at 01:55 AM on 14 September 2013Global Warming’s Missing Heat: Look Back In Anger (and considerable disbelief)…
@DSL . . If you hear hoofbeats don't start by looking for Zebras. (-snip-). Time for some deep thought wouldn't you say?
Moderator Response:[DB] Off-topic & sloganeering snipped.
-
Global Warming’s Missing Heat: Look Back In Anger (and considerable disbelief)…
True enough, keitho, but of course if we do, in fact, know that the oceans are getting warmer, and we know that there's a top-of-atmosphere energy imbalance. Yes, there's uncertainty involved with both, and there's always the chance that aliens are manipulating our instruments or that we're brains in vats being fed a Matrix-like "reality." Science does not provide absolutes, regardless of the public clamoring for such. The question, then, is what happens when people who are convinced that we don't know what's going on encounter pretty solid data that says we do know? Do such people adhere to the standards they have for critical thinking in other people? The evidence--and there is plenty--suggests that some do and many don't.
-
Global Warming’s Missing Heat: Look Back In Anger (and considerable disbelief)…
an additional contribution to reduced heat in the near term can be derived from the cooler sea surface temperatures which reduces the amount of tropical thunderstorm activity which results in a decrease in moisture transport to the lower stratosphere. This effect is also compounded by a recent decline in stratospheric ozone. When there is less water vapor in the lower stratosphere the radiative forcing declines. this is seen as contributing to the reduction in atmospheric heating. Jeff Masters wrote an excellent article on this on his blog:
-
It's not bad
an additional contribution to reduced heat in the near term can be derived from the cooler sea surface temperatures which reduces the amount of tropical thunderstorm activity which results in a decrease in moisture transport to the lower stratosphere. This effect is also compounded by a recent decline in stratospheric ozone. When there is less water vapor in the lower stratosphere the radiative forcing declines. this is seen as contributing to the reduction in atmospheric heating. Jeff Masters wrote an excellent article on this on his blog: www.wunderground.com/blog/JeffMasters/stratospheric-water-vapor-decline-credited-with-slowing-global-warming
-
Jim Hunt at 00:51 AM on 14 September 2013Arctic sea ice delusions strike the Mail on Sunday and Telegraph
We have set our hearts on hauling the Mail in front of the Press Complaints Commission.
Should anyone here wish to help out or read all about it probably the best place to start is at "The Great White Con" -
empirical_bayes at 00:50 AM on 14 September 2013Global Warming’s Missing Heat: Look Back In Anger (and considerable disbelief)…
I'm having a hard look at the recent Fyfe, Gillett, Zwiers, "Overestimated global warming over the past 20 years" (Nature), with intent of doing so reported
- http://hypergeometric.wordpress.com/2013/08/28/overestimated-global-warming-over-the-past-20-years-fyfe-gillett-zwiers-2013/
- http://hypergeometric.wordpress.com/2013/09/06/p-values-are-random-variables/
and shared with the authors of the original (Zwiers). My emphasis is upon the statistical technique adopted, and my technical interest is how a Bayesian assessment of the same data might differ from their bootstrap-based result. This is just a note for future reference. I'm writing something up and sharing it for criticism by the authors, and, after I get their comments, I'll put it up on arXiv.org, with a link from http://hypergeometric.wordpress.com/.
-
keitho at 00:49 AM on 14 September 2013Global Warming’s Missing Heat: Look Back In Anger (and considerable disbelief)…
"but all over the world people are peering at the sky and ground, the oceans and the ice, and declaring that something seems amiss"
When I was studying medicine in the 70's there was a well known effect that most of us experienced. When studying a particular disease it was common to experience some of the symptoms ourselves even though we were perfectly healthy. It was because we were made aware of these symptoms and so could easily ascribe them in ourselves, albeit for a short period. I'm sure you get my point.
If the air isn't getting warmer and we don't know what the oceans are doing despite your "certainty" that something is going on then, objectively, nothing is going on. You really can't go on about "the science" if empirical measurements don't support your position.
-
Medieval Warm Period was warmer
Just a passing note: the first essay on history I did in college was over Helge Ingstad's Westward to Vinland. Well-written, but I can't recall what Helge said about the development of the name 'Vinland'.
-
MA Rodger at 22:35 PM on 13 September 20132013 SkS Weekly News Roundup #37A
ubrew12 @5.
As you sort of suggest, the changing pattern of precipitation under AGW is more defined than whether or not total global precipitation will increase.The links are to AR4, since when we have had five more years to add to the record which have included the two rainiest years on record. So it will be interesting to see what AR5 has to say on the matter.
-
shoyemore at 16:31 PM on 13 September 2013Global Warming’s Missing Heat: Look Back In Anger (and considerable disbelief)…
Tom Curtis @17,
My earlier comment has been removed, but it seems to me you are saying what I was trying to say, only you put it much better. I wll read and learn. Thanks. :)
-
spoonieduck at 14:20 PM on 13 September 2013Medieval Warm Period was warmer
Tom,
I'm aware of no Viking Saga stating that grapes were grown in Greenland. Around A.D. 1,000 the Vikings sailed West from Greenland, coming across a barren land they called "Markland", presumably Labrador. They sailed South and, as I can recall, they called their southernmost discovery, "Vinland" or "land of the grapes". We believe this is present day Nova Scotia where a Viking settlement was discovered at L'anse d'Meadows.
Note: The Vikings never grew domestic grapes, at least not in North America. The "grapes" they found may have been wild grapes, presently found no farther north than New England.
Possible explanations: 1. The Vikings misidentified their wild 'grapes'. 2. We are misinterpreting the word "Vinland". 3. The Vikings did discover wild grapes but, since then, wild grapes have disappeared from Nova Scotia for reasons other than climate. 4. The Vikings sailed as far south as New England. 5. Nova Scotia was significantly warmer then than now. Take your pick.
Prev 862 863 864 865 866 867 868 869 870 871 872 873 874 875 876 877 Next


