


 Arguments


Recent Comments
Prev 864 865 866 867 868 869 870 871 872 873 874 875 876 877 878 879 Next
Comments 43551 to 43600:
-
kar at 22:58 PM on 15 July 2013Climate Change and the Nature of Science: The Carbon “Tipping Point” is Coming
A general problem far beyond this article, is that too often the horizon of problems into the future is set to be like 87 years or may be couple of hundred years (until 2100 or a couple of centuries more).
Even quite a lot of science article fail to mention what David Archer told us in the The Long Thaw - it will last more than 100,000 years to reach back to preindustrial state of CO2 content in the air ... -
kar at 22:40 PM on 15 July 2013Climate Change and the Nature of Science: The Carbon “Tipping Point” is Coming
Is it not a error in the start of the 6th section? Where it should be to and not from?
There is written:
"... that there are 3.1 billion tons of extra carbon being added from the atmosphere ..."
Should been:
"... that there are 3.1 billion tons of extra carbon being added to the atmosphere ..."
... and it could be also be added in the end of the sentence: ... every year.
-
michael sweet at 20:47 PM on 15 July 2013Patrick Michaels: Cato's Climate Expert Has History Of Getting It Wrong
Ray,
I am still waiting for you to provide examples of the IPCC exaggerating the AGW problem. You suggested at 2 above the IPCC exaggerates the AGW problem. SInce you referenced WUWT above I presume you have not seen any posts there that document the IPCC exaggerates the AGW problem. If you provide no examples that would indicate that your suggestion of exaggeration was incorrect.
Please provide a link to a Skeptical Science thread that claims "the science is settled". There is much to learn about AGW. On the other hand, even the skeptics now admit that the temperature is increasing. The greenhouse effect and the contribution of CO2 is also no longer debated by scientists. If you want to suggest that we have to convince WUWT you will have to be more specific about what you claim is not settled. What exactly are you claiming is not settled? Please provide specific examples.
It is easy to make absurd claims if you are not required to back them up with specific examples.
-
Paul D at 20:27 PM on 15 July 2013Global warming games - playing the man not the ball
The fact is, climate science undermines the established economics and politics of the 'left vs right' meme for the last 100 years or so.
So it was always going to be a rough ride.Galileo experienced the same problem trying to get the political (religious) establishment to listen.
-
MA Rodger at 20:23 PM on 15 July 2013It's waste heat
old sage.
Your argued position here appears to rest on the method used to measure themal conductivity in fluids as described in your physics text book. Radation and convection effects are something such a method would require to reduce to insignificance because if not the measurement method would need amending to account for them.
Thus when you say radiation is only 5% the effect of conduction, that simply demonstrates a well designed method (although 5% due to radiation is actually pretty rubbish, to be honest).
But you are taking this 5% figure and asserting it to be some universal ratio of the relative importance of conduction and radiation. Such a use is nonsensical.
I would suggest you read the rest of that physics text book. This will allow you to make some very basic calculations for the size of radiative energy fluxes through the Earth's atmosphere and you will quickly discover that the 5% figure is entirely inappropriate.
-
Cornelius Breadbasket at 19:22 PM on 15 July 2013Global warming games - playing the man not the ball
There are many scientists on this site, and in particular menioned in this article that I'd like to nominate for the John Maddox Prize. I'm hoping that readers here may also make nominations.
-
Earthling at 16:44 PM on 15 July 2013Empirical evidence that humans are causing global warming
JasonB, "(i.e. the temperature would have actually declined without human GHG emissions)."
It would seem that we humans have probably done ourselves a favour by acting to avoid a decline in global temperature.
The LIA, wasn't a time I would have enjoyed living in, for me, the 40s were bad enough.
Thanks to all who replied, I'll consider the possibility that humans have caused somewhere around 74 to 122% of warming and compare it to the IPCC WG1AR5:
"It is extremely likely that human activities have caused more than half of the observed increase in global average surface temperature since the 1950s.""The greenhouse gas contribution to the warming from 1951–2010 is in the range between 0.6 and 1.4°C. This is very likely greater than the total observed warming of approximately 0.6°C over the same period. {10.3.1}""If it doesn’t get warmer over the next years, then it likely will be blamed on the increased share of anthropogenic cooling.".
-
Bob Loblaw at 14:56 PM on 15 July 2013Patrick Michaels: Cato's Climate Expert Has History Of Getting It Wrong
Ray makes two statements (in two different comments):
"If the rise is not statistically significant is it really a rise?"
"In my own field of science which is biochemistry, Student's t-test is routinely used as a measure of significance."
The unstated question is: not statistically significant compared to what? If you are as familiar with a Student's t test as you claim, then you will remember that an important step in the calculations is where you determine "observed - expected". In the case of a temperature trend, "observed" is the slope from the regression, and "expected" is the value from your null hypothesis. But what is your null hypothesis?
- if you want to see if the slope is non-zero, then your null hypotheis is zero and your expected value is zero. This is very common.
- if you want to see if the past warming trend has "stalled", or "stopped", etc., then your expected value is not zero, as your null hypotheis is that the trend has not changed. To use zero as the expected value is wrong - you should use the previous trend value as your expected value. This mistake is also very common.
For the case where a calculated trend is neither significantly different from zero, nor significantly different from the previous trend, then the data that you have is insufficient to distiguish between those two null hypotheses. Which is where Glenn and Tom's comments about short time periods become relevant.
If you are unaware that a t-test can use an expected value other than zero, then you've got some learning to do. If you are aware that an expected value can be non-zero, then you've got some explaining to do.
-
Ray at 14:36 PM on 15 July 2013Patrick Michaels: Cato's Climate Expert Has History Of Getting It Wrong
The link is http://en.wordpress.com/tag/werner-brozek/. In the article the author comments on the slope of the lines. As I stated I'm a biochemist not a climate scientist and I acknowledge that comments such as those by Tom Curtis and others are from those with more understanding of the science than I have. That said, the scientically trained layman can see that "the science is settled mantra" may be premature from some the findings reported.
-
Tom Curtis at 14:33 PM on 15 July 2013Patrick Michaels: Cato's Climate Expert Has History Of Getting It Wrong
Ray @23, you now show evidence of some statistical sophistication. Given that, I wonder how you can justify parsing:
"The hypothesis of no warming has not been excluded"
as:
"There has been no warming".
To my mind the later is a positive claim, in effect stating that the hypothesis of warming has been excluded by the data. And that is, of course false. In science, no hypothesis gets prefferential treatment. Not even the nul hypothesis, and failing to disprove the null hypothesis is not the same as proving the null hypothesis, no matter how many times deniers pretend to the contrary.
In this case, however, the null hypothesis is only disconfirmed if you cherry pick your start points to limit the data available; and if you exclude other known relevant data (such as ENSO states). I wonder how you would mark a student who, having tested a hypothesis and excluded the null, dropped half of the data and redid the test, then reported only the data used in the second test along with a confident claim that the failure of that data to exclude the null hypothesis showed that the hypothesis being tested was false (ie, "There has been no warming.")
-
Tom Curtis at 14:23 PM on 15 July 2013Patrick Michaels: Cato's Climate Expert Has History Of Getting It Wrong
Ray @20, first I'll note that Glenn Tamblyn's response is excellent. If you think carefully about what he wrote I need add nothing (though I'll add it anyway). In particular, he pointed out that for any period in the last forty years, even though the linear trend over that period is positive and significant (0.167 +/- 0.037 C per decade), there is a shorter period in which the trend is not statistically significant. If you interpret "the trend is positive but not statistically significant" as meaning there is no trend, then for each of those periods there both was a positive trend (because it is part of an extended period with a statistically significant rise), and no trend (because it is part of a period without a statistically significant trend). Thus, the common misinterpretation of lack of statistical significance is directly inconsistent. Logically, it cannot be true.
In fact, statistical significance speaks not to whether the observed trend is rising or falling, but rather how confident we can be about that claim. If the trend is rising but not statistically significant, that means there is:
- The observed trend is positive.
- A greater than fifty percent chance that the underlying trend is positive.
- A greater than 2.5% chance that the underlying trend is flat or negative.
That is all it means.
If we know that the trend is positive at the 90% confidence level but not at the 95% confidence level, then:
- The observed trend is positive.
- There is a greater than 95% chance that the trend is positive.
- There is a greater than 2.5% chance that the trend is flat or negative.
The reason it is a 95% chance rather than a 90% chance is because the confidence interval is symetrical, so there is a 5% chance that the trend will be positive, but larger than the upper bound of the 90% confidence interval, which is, of course, still positive.
Of course, those probability estimates are based only on the information in the temperature data alone (plus some well characterized statistical assumptions). If we include other data, such as the known relationship between ENSO oscillations and temperature, and the known ENSO fluctuations over the period, the probability that the underlying trend is positive becomes much greater that indicated the temperature data alone. Indeed, including the information about ENSO and other known short term influences shows the underlying trend since 1997 to by 0.209 +/- 0.085 C per decade (GISTEMP adjusted).
In any event, turning the claim that the trend is positive but not statistically significant, ie, the claim that:
- The observed trend is positive.
- A greater than fifty percent chance that the underlying trend is positive.
- A greater than 2.5% chance that the underlying trend is flat or negative.
into the claim that there is not positive trend can at best be construed as woefull ignorance, but in many cases is more likely to be deliberate misrepresentation.
-
Ray at 14:04 PM on 15 July 2013Patrick Michaels: Cato's Climate Expert Has History Of Getting It Wrong
Thank you for the comments in posts 21 and 22. In my own field of science which is biochemistry, Student's t-test is routinely used as a measure of significance. If I get a t value of p<0.5 then I can't claim the results didn't happen by chance alone. Certainly no journal in my field would accept a claim on my part that my finding was unequivocally real. Similarly no journal would accept my use of a 90% confidence interval to validate my findings. Interestingly there has been an evaluation of global temperatures from 6 major data sets (GISS, Hadcrut 3 and 4, RSS, UAH, NOAA) using data retrieved from Skeptical Science and the SkS Temperature Trend Calculator. Statistically significant warming at the 95% confidence limit has not been shown in any of the data sets for periods ranging from 18-23 years.
Moderator Response:[DB] "Interestingly there has been an evaluation of global temperatures from 6 major data sets (GISS, Hadcrut 3 and 4, RSS, UAH, NOAA) using data retrieved from Skeptical Science and the SkS Temperature Trend Calculator. Statistically significant warming at the 95% confidence limit has not been shown in any of the data sets for periods ranging from 18-23 years."
You'll need to provide a proof link for this assertion. As longtime commenter KR has observed many times in this venue:
When examining ANY time-span starting in the instrumental record and ending in the present, note that:• Over no period is warming statistically excluded. NONE.• Over no period is the hypothesis of "no warming" statistically supported WRT a null hypothesis of the longer term trends. NONE.• And over any period with enough data to actually separate the two hypotheses – there is warming. ALWAYS.Therefore, in the absence of a change in trend, the previous warming trend is therefore still in place.
-
Glenn Tamblyn at 13:29 PM on 15 July 2013Patrick Michaels: Cato's Climate Expert Has History Of Getting It Wrong
Ray
You are missing the point of Tom's comment. If we are talking about the 'statistical significance' of something, we are discussing how likely that something was to have occurred due to random chance or not. Not whether that 'something' happened at all. Tom is referring to the fact that the concept from statistics - 'statistically significant' - is misleadingly equated with the colloquial English word 'significant' when actually the two terms have very different meanings.
However, if one seeks to mislead people, not pointing out the distinction is all that is needed to con a reader who is unfamiliar with the meaning of the term from statistics.
Lets take Phil Jones' oft mis-represented comment about there hasn't been a statistically significant warming since x (I can't remember the year) He actually said that it wasn't statistically significant at the 95% confidence interval which is the usual standard measure. He also said that it was statistically significant at the 90% confidence interval.
His meaning, in plain English - 'There has been warming; the chances that this observed warming is not random are not greater than 95%; but they chances that the observed warming is not random are greater than 90%'
-
Tom Dayton at 13:22 PM on 15 July 2013Patrick Michaels: Cato's Climate Expert Has History Of Getting It Wrong
Ray, if you pick short enough periods in a time series with a low signal to noise ratio, you can get many or even all those periods to lack a statistically significant rise. But longer periods that contain those short periods do have a statistically significant rise. That apparent logical incompatibility is only apparent, when you understand what "statistically significant" really means.
-
Ray at 13:01 PM on 15 July 2013Patrick Michaels: Cato's Climate Expert Has History Of Getting It Wrong
Tom Curtis @12
Your comment
"The most typical misrepresentation in this sort of case is misrepresenting "the rise in temperature has not been statistically significant" as "there has been no rise in temperature".
If the rise is not statistically significant is it really a rise? If it is does this make statistical evaluation redundant?
-
barry1487 at 12:44 PM on 15 July 2013Patrick Michaels: Cato's Climate Expert Has History Of Getting It Wrong
There were plenty of predictions made in FAR (mostly Chapter 5) with far less climate data than today. A balanced scorecard, pointing out what they got right and wrong could make a very strong point in the debate. Worth an article at SkS?
(I know there have been articles on FAR surface temp projections, but there were many other predictions made, some of which I mentioned in my first post above) -
barry1487 at 12:36 PM on 15 July 2013Patrick Michaels: Cato's Climate Expert Has History Of Getting It Wrong
There is an unfortunate tendency for using global average surface air temperatures as THE measure of global temperature and it's not confined to laypersons.
I'm guessing that the focus on surface air temperatures is because 1), it is only recently that ocean heat content indicea have been collated, 2) impact of global warming (for humans anyway) will be experienced mostly at the surface.
IPCC reports have a strong (but not exclusive) emphasis on surface temperatures. AR4 Summary for Policy Makers has a few short paragraphs on ocean temperatures, for example, but much more on surface data. There are no ocean heat content projections in AR4, so it's no wonder people from all points of the debate have focussed on surface data.
-
chriskoz at 12:30 PM on 15 July 2013Climate Change and the Nature of Science: The Carbon “Tipping Point” is Coming
kmalpede@11,
Hi Karen,I'm interested in this play, however I have no idea if it ever comes to the theatre near me (Sydney AUS) let me know when. Maybe in the meantime, can you give us some info about it (review detailing the action) or perhaps some trailer or link to some online content so that we can watch and have a good feeling about its content. Thanks.
-
Glenn Tamblyn at 12:12 PM on 15 July 2013IPCC is alarmist
andrewii
This article discusses the findings by Lee Kump and colleagues wrt the rate of inctrease of CO2 during the Paleocene/Eocene Thermal Maximum, around 55 million years ago.
This period is considered a reasonable analogue for today. The world was originally warmer than today by perhaps 4-6 DegC, then it experienced a doubling or more of CO2 very quickly (in geological time scales). Temps climbed another 4-6 DegC, a small Extinction event occurred and an Anoxic event occcurred in the ocean.
Kump et al found that CO2 levels today are climbing 10 times faster than during the PETM.
-
Tom Curtis at 10:50 AM on 15 July 2013Patrick Michaels: Cato's Climate Expert Has History Of Getting It Wrong
Supak @14:
First, you should insist on using HadCRUT4 rather than HadCRUT3.
Second, find out the start year for Michael's predicted 25 years with no warming.
Third, from existing HadCRUT4 data, find the standard error on 25 year trends.
Fourth, bet that on the 25th year, the warming trend will be greater than two times the standard error for HadCRUT4 trends.
Alternatively, find the AR4 multimodel mean prediction with a HadCRUT mask (either version). Bet that the GMST as measured by HadCRUT will be within 0.2 degrees of that plus an adjustment factor based on ENSO as per Foster and Rahmstorf. His position will be that it is within 0.2 C of the 1996-2012 mean. Each year, there is a standard payout from the person the other person to the person where the temperature falls within "their" predicted range. Obviously if it falls in both, there is no payout.
-
Ken in Oz at 10:44 AM on 15 July 2013Patrick Michaels: Cato's Climate Expert Has History Of Getting It Wrong
There is an unfortunate tendency for using global average surface air temperatures as THE measure of global temperature and it's not confined to laypersons. ie people who should know better say things like "The world warmed by x degrees" or "The world has experienced no significant warming for x years" (suggesting air temperatures near the surface is equivalent to 'the world', when if fact most of the heat, whether during the periods when "global temperatures" are experiencing there normal (plus a bit) ups or normal (plus a bit) downs, goes into the oceans. And this increase in heat content hasn't slowed or stopped.
Warming of surface air temperatures is not the same as the world warming because air only holds a few percent of the heat the world has gained.
In my opinion climate science communicators who conciously or unconciously use air temperatures as the definitive measure of change to our climate system - or just as shorthand - are contributing to ongoing misunderstandings. If Pauchauri has been one of them I'm disappointed.
Back to scrutinising the 3% - Michaels' actual knowledge of climate makes him more effective at pushing the denialist/obstructionist line. Certainly he would know that the world continued to warm during the past 17 years and that is shown clearly in heat content with most of it in going into rising ocean heat, so therefore, to push his biased conclusion that preceded his formulation of his arguments, he would know to distract attention from heat content and keep the focus strictly on surface air temperatures. When the next el Nino sends that 'stalled' warming back into record territory, he will suddenly rediscover some of the natural processes that make that variability - processes that he currently avoids mention of in discussing why we can have a 17 year 'pause' without global warming having stopped or slowed.
-
vrooomie at 09:35 AM on 15 July 2013Understanding the long-term carbon-cycle: weathering of rocks - a vitally important carbon-sink
As a geologist, this thread finally feels like I've found my people....:-)
Thanks to the fellow geologists who've helped me refresh my phase reaction diagrams!
-
supak at 08:41 AM on 15 July 2013Patrick Michaels: Cato's Climate Expert Has History Of Getting It Wrong
@DSL, yeah, the Intrade markets were set up at .45, .55, .65, and .75 markets. I went long on them all, and did well, but I would have raked it in last month because I'd have been increasing bets every month on the higher ends until they paid off. You could get .65s for around a dollar a share usually.
-
supak at 08:35 AM on 15 July 2013Patrick Michaels: Cato's Climate Expert Has History Of Getting It Wrong
I emailed Mr. Michaels, and managed to get him to agree to a bet. But he won't use GISTEMP. He wants to use CRU. Any advice on the bet? I used to win a lot at Intrade on betting GISS and ICE, so I'm hoping to structure an even money bet on a reasonably marker of what he calls ""...a pretty good bet that we are going to go nearly a quarter of a century without warming."
Any suggestions are welcome, in order to help me resume my denier's tax.
-
KR at 07:54 AM on 15 July 2013It's waste heat
old sage - "...an informed guess"
Why guess? Trenbert et al 2009 is a fine place to start, to look at actual (measured) numbers for convection, evaporation, radiation, etc.:

I consider this particular diagram a basic starting point for energy balance discussions, regardless of whether or not you agree with all the numbers listed.
Thermals (convection) account for some 17 W/m2 leaving the Earths surface, evaporation/transpiration another 80, and IR radiation the majority at ~396 W/m2. The references on that paper (as well as similar works) lead directly to descriptions of how these quantities were measured.
That heating of the near-surface atmosphere results in an IR emission of ~333 W/m2 back to the Earth (again, a measured quantity). Absorption of IR at GHG frequencies occurs within a few 10's of meters at sea level - the effective radiating altitude (high up, much cooler) where emitted IR can escape to space is where GHG concentrations drop to a density allowing that escape.
Convection indeed has an important role - radiative transfer isn't terribly effective in comparison to convection/evaporation, and the convection in the troposphere allows much more of that near-surface energy to reach effective radiating altitudes - without convection the GHG would make the Earth much much warmer.
On the other hand, without GHGs and near-surface atmospheric radiation, all of the IR radiated from the surface would travel directly to space - 240 W/m2 from the surface, rather than the atmosphere as a whole. And that would correspond to a radiating suface temperature of about -18C, some 33C cooler than present.
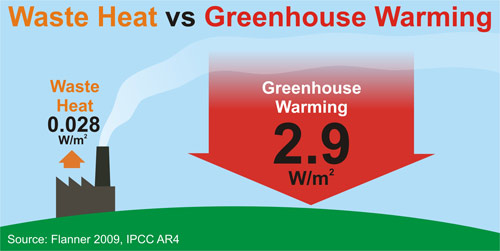
"...tell that to the fairies!" - Looking magnitudes, 2.9 W/m2 imbalance from atmospheric change is roughly 100x the 0.031 W/m2 from our energy release. Waste heat is therefore a near-trivial influence on current warming. I would suggest you listen to the measurements rather than your intuition. And note that Arguments from Incredulity are a logical fallacy; the actual data disagrees with your statements.
---
In short: Your estimates are wrong, the numbers show otherwise. Waste heat is a trivial influence with respect to GHG changes, convection is more than 15x smaller than radiation in terms of energy, GHGs don't need to be ionized plasma to radiate, and there is no missing energy sink. There is, in fact, absolutely nothing correct about your last post - all of your (qualitative, I'll note, not numeric) claims are contradicted by the data. I would suggest doing some reading before making additional claims (as you have been) that all of the science is wrong.
-
scaddenp at 07:32 AM on 15 July 2013It's waste heat
Old sage, as others have indicated, you are working from an absurdly incorrect understanding of what greenhouse house assets. It has nothing whatsoever to do with conductive properties, and everything to do with radiative properties of the gas. These are lab determined, first observed by Arrhenius. Downwelling radiation is also something that you measure (so you can check observation against theory). Your arguments are a nonsense strawman - a argument about something that science does not claim. You need to read up on what radiative physics actually asserts and how it is experimentally verified before trying to continue a conversation. I would recommend this excellent series for the text book background to the subject.
-
gws at 06:18 AM on 15 July 2013IPCC is alarmist
Andrewwii, when studying climate topics and associated facts, try not to view or read individual statements out of the larger context (note also that the video is pasted together from a longer one). It is easy to cherry-pick a single statement taken out of context and get confused by it, or even take it to mean somebody is dishonest or similar.
In this particular case, we are talking about a rise from a preindustrial level of 280 ppm to today's 400 ppm in roughly 200 years (average 1.2 ppm per year, accelerating; currently 2 ppm/yr). In that video, Michael Mann refers to the last time the CO2 level was that high (several million years ago) and how much time it took then to change average levels by roughly as much (e.g. by 100 ppm), "10s of millions of years" (long-term average data here). Taking an average slope (ppm CO2 change over time) from that graph over the last 100 million of years gives roughly 10 ppm/million years ((1300-300) / 100), so about a 5th to a 10th of a million times as fast as today. If you take a shorter period, say only the last 30 million years, the slope is less, nearly matching what Mann referred to.
So you see, it is easy to accuse him of saying something wrong. Human nature. It is more difficult though to stand back, look at the bigger picture, ask a clarifying question if possible, and avoid taking things out of context. So thanks for asking.
-
old sage at 05:50 AM on 15 July 2013It's waste heat
This thread starts off with the assertion that GHG's warm the earth to the extent of 2.9 w/m2 compared with .031 generated by man. (according to my calculation using 2012 energy output). Quite a straightforward calculation shows that .031 equates to raising the entire mass of the earth's atmosphere by 1/10th deg p.a. So GHG's raise it by 10 degrees p.a. - tell that to the fairies! The amount of energy dissipated by radiation from the earth's surface is a tiny fraction of that by conduction, convection (natural) and forced as the following basic physics illustrates:
1) Long established by theory and measurement we have values for thermal conductivity of gases at STP. Typical experiment has two horizontal parallel plates too close to allow convection and a temperature gradient. The correction for the contribution from radiation is about 5%. (Physics text books)
2) Natural convection has been well established to obey certain rules for all gases (monatomic, diatomic etc). For air, at 300 deg. K it effectively doubles the conductivity values established in 1 above.
3) Forced convection - the situation at the earth's surface - is where I make an informed guess. My old car boils if left idling for ten minutes with the fan off, at 30 mph, where the engine is dissipating at least ten times the energy, it is as cool as a cucumber. Perhaps the average wind at the earth's surface is less, but to bend over as far backwards as possible in favour of the GG fanatics, lets say it multiplies cooling by a factor of five rather than ten.4) Of this small proportion an even smaller proportion of the spectrum will find molecules with which to resonate. Whether the excited molecule simply exchanges energy with the surface or suffers a collision transfering to kinetic energy is neither here nor there, because the upshot is it will make an immaterial difference to the total energy transfer.
5) Contrast this with the situation at the edge of space where very hot molecules become ionised and each and every single one of them that moves then becomes a e/m radiator losing its kinetic energy in the process. This is where the business of transforming kinetic into radiant energy takes place, it is the lower world's ultimate heat sink.
We inhabit the coolant of an enclosed air-cooled machine, the heat source, the sun (and man), the heat sinks comprise moving media - the oceans - the poles and the unlit side of the earth. But, there must be another sink which provides a route out by radiation. Just as the sun's surface temperature determines the solar spectrum, so does the surface skin - the upper atmosphere ionised shell- of the atmosphere.Moderator Response:[TD] At least you are on some other thread than the one you started on. But the bulk of this comment by you belongs not on the waste heat thread, but on the other thread that Tom Curtis pointed you to earlier. Before you comment on that other thread, you really, really should read the orginal post there.
-
DSL at 05:49 AM on 15 July 2013IPCC is alarmist
Tough to say, Andrewii. While it's true that CO2 hasn't increased as rapidly as present in at least 300 million years, it would take some selectivity to make the math come out right on "1,000,000 times faster." For example, we could find a period where CO2 advanced 120ppm over the course of 150,000,000 years. Such a period might be found if one used the right analysis (e.g COPSE). Then one could say, "We've put up 120ppm in 150 years, one million times as fast as in period x." Or one could go the other route and find a much shorter period with a much more neutral trend. Without knowing the comparison period, it's hard to say what Mann is referring to.
It's hard to be alarmist with the rate of CO2. As Honisch et al. point out, it's possible there's no precedent for the current rate of increase. -
DSL at 05:29 AM on 15 July 2013Patrick Michaels: Cato's Climate Expert Has History Of Getting It Wrong
BTW, GISS L-OTI anomaly has been updated: .68. That's the second warmest June in the instrumental period, after 1998 (during the peak of the big 97/98 El Nino). No El Nino to help out. Seven of the eighteen warmest months in the instrumenal period that have exceeded June 2013 occurred in El Nino conditions. The first six months of 2013 have all been above .5. That's happened four other times: 1998 (El Nino), 2005, 2007, and 2010 (El Nino). ENSO MEI for June is neutral at best.
-
Daniel Bailey at 04:30 AM on 15 July 2013Empirical evidence that humans are causing global warming
@ Earthling:
Huber and Knutti (2011) quantified that human attribution as being 74% and 122% due to humans (with a best estimate of around 100% human attribution). In other words, natural variability is not responsible for the observed warming trend.
http://www.nature.com/ngeo/journal/v5/n1/abs/ngeo1327.htmlSince then, Gillett et al (2012) also examined the human attribution of the warming trend observed. They found that humans are responsible for 102% of observed warming from 1851 to 2010 and 113% of the observed warming from 1951 to 2000 and 1961 to 2010 (averaged together).
http://www.agu.org/pubs/crossref/2012/2011GL050226.shtmlAnd Sedláček & Knutti (2012) examined ocean and atmosphere warming to ascertain whether recent global warming is consistent with natural variability, or with external forcing (i.e unrelated to internal variability of the climate system). They found that both computer simulations and historical observations are incompatible with natural variability as a possible cause of ocean warming. I.e., natural factors/cycles are not the cause of the ongoing warming we can see and measure.
http://onlinelibrary.wiley.com/doi/10.1029/2012GL053262/abstractAnd Jones et al (2013) concludes that greenhouse gases have caused between 100% and 200% of the observed global surface warming over the past 60 years, and other human influences (primarily aerosols) have offset a significant percentage of that warming via cooling effects. Natural temperature influences have had a very slight cooling effect, and natural internal variability appears to have had a fairly significant cooling effect over the past decade, but little temperature influence over longer timeframes.
The results of this study are consistent with the wide body of evidence supporting the settled science that human greenhouse gas emissions are the dominant cause of the current global warming.
http://onlinelibrary.wiley.com/doi/10.1002/jgrd.50239/abstractEdit: Please read Dana's summary post for a more in-depth treatment:
http://www.skepticalscience.com/a-comprehensive-review-of-the-causes-of-global-warming.html
-
andrewii at 03:59 AM on 15 July 2013IPCC is alarmist
Woops, forgot the link: http://www.motherjones.com/blue-marble/2013/05/michael-mann-hockey-stick-climate-desk-live
-
andrewii at 03:58 AM on 15 July 2013IPCC is alarmist
Hi all,
This may be a dumb question, but I'm wondering if someone could clear up my confusion about the rate of change in CO2 concentrations we're seeing today vs. the rate at which they've varied in the past.
In this video, Michael Mann states that the rates today are changing a million times faster than what we've seen in the past, but this article above states that "atmospheric CO2 is increasing ten times faster than any rate detected in ice core data over the last 22,000 years."Thanks for your help,
Andrew
-
Tom Curtis at 03:31 AM on 15 July 2013Patrick Michaels: Cato's Climate Expert Has History Of Getting It Wrong
Ray @9,
1) The Australian newspaper says that Pauchauri agrees there has been no temperature increase over the last few years. That is dubious in that it is not true, and it is not what Pauchauri typically says on the issue. The Australian will not release transricpts of the interview to verify its claim, so it is likely that they have misrepresented some related comment by Pauchauri. The most typical misrepresentation in this sort of case is misrepresenting "the rise in temperature has not been statistically significant" as "there has been no rise in temperature".
2) NOAA claims a sea level rise of 2.9 mm/ year, with the most recent period being greater than that:

NOAA notes that adding the global isostatic adjustment would raise that rate of sea level rise by between 0.2 and 0.5 mm/year.
I note, however, that you are prepared to cherry pick data to create a misleading impression.
-
vrooomie at 03:31 AM on 15 July 20132013 SkS Weekly News Roundup #28A
I'd hit the "Like" button, if it were here!
Fracking is also used extensively in my home county, where there over 15 *thousand* oil and gas wells. It's also employed in oils wells, as well as CSG.
Folks around the Marcellus shale--NYC, the biggest population --are also fighting this method of draining every damn drop of oil, and molecule of natural gas.
-
rockytom at 03:29 AM on 15 July 2013Patrick Michaels: Cato's Climate Expert Has History Of Getting It Wrong
Concerning Michaels' claim to be "state climatologist of Virginia" there is no "State Climatologist" of Virginia.
-
vrooomie at 03:24 AM on 15 July 2013Patrick Michaels: Cato's Climate Expert Has History Of Getting It Wrong
Ray, you state, "Several comments from Dr Pauchauri such as that there has been no warming for 17 years..."
Please show the credible source of that alleged remark. I'll wager it doesn't exist. Secondly, sea levels do continue to rise. :Please link to the credible source that supports your assertion that they do not.
-
Ray at 03:11 AM on 15 July 2013Patrick Michaels: Cato's Climate Expert Has History Of Getting It Wrong
Several comments from Dr Pauchauri such as that there has been no warming for 17 years and that discussion of the science is essential suggest that all the forecasts from the IPCC may not be set in stone. For example sea level rises from IPCC are 3.1mm/year; data from NOAA for 2005-2012 is 1.1-1.3 mm/year which is a bit less than half. NOAA values from satellite altimentry and ARGO. Latter values actually about 0.3mm/year but a "correction factor" by NOAA of 0.9mm/year increases ARGO values. With error bars min and max values from NOAA are 0.2 -2.2mm/year quite different from IPCC. Is NOAA wrong? And why, if global temperature is increasing and ice melt is increasing, why are current increases in sea level rises not increasing also?
Moderator Response:[DB] "Several comments from Dr Pauchauri such as that there has been no warming for 17 years"
Please furnish a linked to a reputable source directly quoting Dr Pachauri on this. An approved transcript and/or unedited video will suffice. Until then this claim is unsupported and off-topic in this thread.
-
citizenschallenge at 02:52 AM on 15 July 2013Empirical evidence that humans are causing global warming
I've been on a roll and should pull back - but this is too good not to share
Reposted at:
Consensus part 2 - The Empirical Evidence
http://citizenschallenge.blogspot.com/2013/07/consensus-part-2-empirical-evidence.html
~~~~~~~~~~~~~~~~~~~
thanks, :-)
-
barry1487 at 02:26 AM on 15 July 2013Patrick Michaels: Cato's Climate Expert Has History Of Getting It Wrong
citizenschallenge,
I'm not aware of any studies of Antarctic sea ice thickness. Latest results on the increase in extent point to changing wind patterns, but no one really knows why it happening.
Also from FAR;
All models produce a warming; of the Earth's surface and troposphere (lower atmospheie) and a cooling of the stratosphere.
Confirmed over the satellite record (from 1979).
You can find other predictions at the source (Chapter 5).
-
citizenschallenge at 01:39 AM on 15 July 2013Patrick Michaels: Cato's Climate Expert Has History Of Getting It Wrong
Oh and about that surface snow/ice increases, doesn't that have a lot to do with more moisture in the air, warmer ocean temps, more snow fall...
and such dynamics that have been directly influenced by global warming?
-
kmalpede at 01:36 AM on 15 July 2013Climate Change and the Nature of Science: The Carbon “Tipping Point” is Coming
When Dr. James Hansen spoke after the reading of my play "Extreme Whether" in April, he made a similar point about well-meaning, intellligent people who can't "see" global warming and suggest we wait until we can. Our climate crisis presents a problem with the imagination as much as with conveying the science: how can we imagine the future so we can act in our defense before it is too late. In that regard, the play "Extreme Whether" will have another public reading, September 10 at 2pm at the Cherry Lane Theater in New York City, followed by a talk by Dr. Jennifer Francis--at that point, in Sept., this year's Arctic ice melt should be at its peak.
-
citizenschallenge at 01:35 AM on 15 July 2013Patrick Michaels: Cato's Climate Expert Has History Of Getting It Wrong
Regarding #2 Antarctic sea ice should decline.
"surface area" may be increasing... but just as with the Arctic, the thinning of ice says more than the "extent" of short-term winter ice.
====================================
http://www.scar.org/news/antarctic/ - 28 June 2013
More than half of the melting of Antarctica's ice occurs at just ten small ice shelves.
The results, which appear in Science, suggest that warm ocean currents are melting ice shelves predominantly at certain locations around the continent, to an extent that accounts for 55% of the annual meltwater. The findings will help scientists to tackle larger questions about how the Antarctic ice sheet might change in future and its contribution to global sea-level rise.
For more information, please read the Nature News item or read the full paper:
Rignot, E., Jacobs, S., Mouginot, J. & Scheuchl, B. Science DOI: 10.1126/science.1235798 -
old sage at 00:55 AM on 15 July 2013There is no consensus
Sorry folks, only joined this yesterday and not got the hang of it, will try to shift msgs!
-
barry1487 at 00:43 AM on 15 July 2013Patrick Michaels: Cato's Climate Expert Has History Of Getting It Wrong
Ray @ 2,
From the first IPCC report in 1990:
Models predict that surface air will warm faster over land than over oceans, and a minimum of warming will occur around Antarctica and in the northern North Atlantic
region...
Warming has occurred faster over land, with minimal warming in Antarctica.The warming is predicted to be 50-100% greater than the global mean in high northern latitudes in winter...
Warming has been nearly 3 times as much at the north Pole than the global mean.
Precipitation is predicted to increase on average in middle and high latitude continents in winter...
(Don't know if that has occured or not)
Aerosols as a result of volcanic eruptions can lead to a cooling at the surface which may oppose the greenhouse warming for a few years following an eruption...
This occurred a year later with the eruption on Pinatubo, and the influence on short-term temps was well-predicted by Hansen's 1988 model.
Patterns of climate change from models such as the Northern Hemisphere warming faster than the Southern Hemisphere and surlace an warming laster over land than over oceans are not apparent in observations to date...
They are now.
An average late of global mean sea level rise of about 6cm per decade over the next century (with an uncertainty range of 3 - 10cm per decade)...
Current rise is 3cm per decade, and acceleration may have been occurring (the trend for last century is 1.7cm per decade).
The simplest of these feedbacks arises because as the atmosphere warms the amount of water vapour it holds increases Water vapour is an important greenhouse gas and will therefore amplify the warming...
Specific humidity has increased since the 1970s.
The surface warming and its seasonal variation are least in the tropics....
Excepting the South Pole, that is the case, but this report also predicted minimal warming over Antarctica.
[Precipitation] the global average increases (as does that of evaporation)...
Global precipitation has increased over the last century.
The FAR (First Assessment Report) pointed out that there will be significant regional variation for various indices, which has also happened.
I picked the FAR, not just because it was the first report, but also because there was not comprehensive indices at that time for many components of the climate system. In the 22 years since then, much data has been collated, verifying the sign of almost all predicted trends.
There are a few unresolved predictions.
1) Tropical tropospheric temps should warm faster than the rest of the atmsphere.
This is not a GHG prediction, but a prediction that the tropicqal tropospheric temps should warm faster no matter what the cause. Observations are not uniform in confirming this, and it remains a very active area of research.
2) Antarctic sea ice should decline.
Over the periof of satellite measurements, it has increased, but if the record is longer extended, it has declined, with caveats.
-
old sage at 23:59 PM on 14 July 2013There is no consensus
If co2 is so important, please tell me where I can look up tables of absorption of characteristic frequency radiation plotted against co2 concentration in air at various pressures and temperatures.
(-snip-)
Moderator Response:[DB] Off-topic and sloganeering snipped. Please review this site's Comments Policy before submitting further comments (link adjacent to the Comment Box).
[TD] Specifically, put this comment on the thread that Tom Curtis pointed you to--not the waste heat one.
-
Joel-Snape at 23:13 PM on 14 July 2013Empirical evidence that humans are causing global warming
Earthling. Actually the warming potential from anthropogenic additions of CO2 are known, sufficiently understood and well-documented in the scientific literature. The standard equation for calculating the radiation-enhancement from CO2 is as follows: RF = ln*5.35(C\C1). The equation in question is derived from HITRAN, which is based on real-world observations (spectrometer/satellite measurements) and determines the radiative forcing characteristics of certain gases in the atmosphere, such as CO2 and CH4. The equation above gives us a radiative forcing of about 3.7W/sq.m for a doubling of CO2 corresponding to a warming of about 1C in the atmosphere. It's also worth pointing out that hardened skeptics such as Lindzen, Spencer, Nova, and many others, all agree with the 3.7W/sq.m of radiative forcing from a doubling of CO2, so it's not really that controversial. So despite claims to the contaray, the warming from human CO2 in the atmosphere is quantifiable and well-accepted - even by skeptics. As Jason pointed out, there's also the small matter that 97% of scientists agree that the planet has warmed since 1860 and that human CO2 has been a significant contributer to that warming.
-
michael sweet at 22:20 PM on 14 July 2013Patrick Michaels: Cato's Climate Expert Has History Of Getting It Wrong
As a follow up to CBD's comment, I notice that all the IPCC projections he mentioned are in error on the conservative side. Michaels claims that the IPCC overestimates the problem. Ray should compare when the IPCC overestimates the problem. I also note that the IPCC would be expected to have more missed projections because it has projected many more future issues than MIchaels.
I am not aware of any IPCC projections that are in error and overestimate the problem. If Ray would list several such examples it would be a learning experience.
-
JasonB at 22:08 PM on 14 July 2013There is no consensus
BTW, you must have missed this graphic on the page you were already asked to move discussions about waste heat to:
Please follow up there.
-
JasonB at 21:53 PM on 14 July 2013There is no consensus
old sage,
How can the greenhouse gas disciples ignore it?
I'm not sure what a word like "disciples" is supposed to mean when you're talking about scientific results that are accepted by every scientific body the world over, but to answer your question:
Because it has been weighed, it has been measured, and it has been found wanting.
In other words, why obsess about the possible impact of a demonstrably small contibutor to global warming while ignoring the elephant in the room who's effect, even without feedbacks, is indisputably orders of magnitude larger?
Prev 864 865 866 867 868 869 870 871 872 873 874 875 876 877 878 879 Next


