


 Arguments


Recent Comments
Prev 876 877 878 879 880 881 882 883 884 885 886 887 888 889 890 891 Next
Comments 44151 to 44200:
-
michael sweet at 11:40 AM on 23 June 20132013 SkS Weekly News Roundup #25B
Terranova,
I am not sure what your point was with your posts, but I have this response. You said " I've walked out of my downtown house in Charleston to be greeted by 2 feet of water in the streets". 8 inches of that was due to climate change fueled sea level rise. How much better would you have been with only 16 inches of water instead of 24? I can drive through 16 inches of water but 24 floods my engine. In general, the last 8 inches of a flood cause a disproportionate amount of damage. You are correct that 3.15 mm of sea level rise is not much to worry about. The increase in global temperature this year of about 0.02C is also nothing that bothers me. Unfortunately, these increases will continue for the indefinate future. 3.15 mm of sea level rise will be 1 foot more water in your street in 100 years, except that the rate is projected to increase substantially during that time. That is enough water to stop up the street drains in Maimi. Likewise the .02C rise will be 2C in 100 years, unless it also increases as projected. This will be over the safe limit of 2C when added to the 0.6C we have already experienced.
The sea level rise today was only about 10 micrometers. Who cares? That is less than the thickness of a piece of paper! -
tcflood at 10:41 AM on 23 June 2013Eschenbach and McIntyre - Seeing the BEST part of the Satellite Temperature Record?
Tom Curtis,
Thank you for taking the time to give this detailed answer. It's a big help.
-
SEAN O at 09:12 AM on 23 June 2013Jim Powell's Inquisition of Climate Science now available in paperback
Chris G, If Arrhenius is the Galileo of Climate Change, does that make Tyndall the Copernicus?
-
Terranova at 08:41 AM on 23 June 20132013 SkS Weekly News Roundup #25B
John,
You are correct on the NOAA link you provided. And, I am by no means trolling, and I am not even sure what sloganeering means in the context of my post. If I offended you, or any readers, I offer my sincere apologies.
Take this statement in the vein it is intended. As a working scientist, I feel that articles from sources such as Rolling Stone detract from the hard science attempted by SKS. Rolling Stone magazine is great (I read my sister-in-laws secondhand copies) when it comes to music and liberal politics, but not so much when it comes to science.
In the future I will restrict my comments to the "sciencey" stuff.
-
Chris G at 08:39 AM on 23 June 2013Jim Powell's Inquisition of Climate Science now available in paperback
Climate change has already has its Galileo. His name was Svante Arrhenius.
-
Tom Curtis at 08:27 AM on 23 June 2013Eschenbach and McIntyre - Seeing the BEST part of the Satellite Temperature Record?
Additional to the above, Chris Colose (I think) once posted a very interesting blog showing satellite images at different frequencies showing clearly how different altitudes became successively revealed. Very interesting inrelation to tcflood's question. I have tried to find it since with no success. If anybody could direct me to it, or the original data he used, I would greatly appreciate it.
-
Tom Curtis at 08:24 AM on 23 June 2013Eschenbach and McIntyre - Seeing the BEST part of the Satellite Temperature Record?
tcflood @24/25, the following is the microwave absorption spectrum of oxygen at different altitudes:
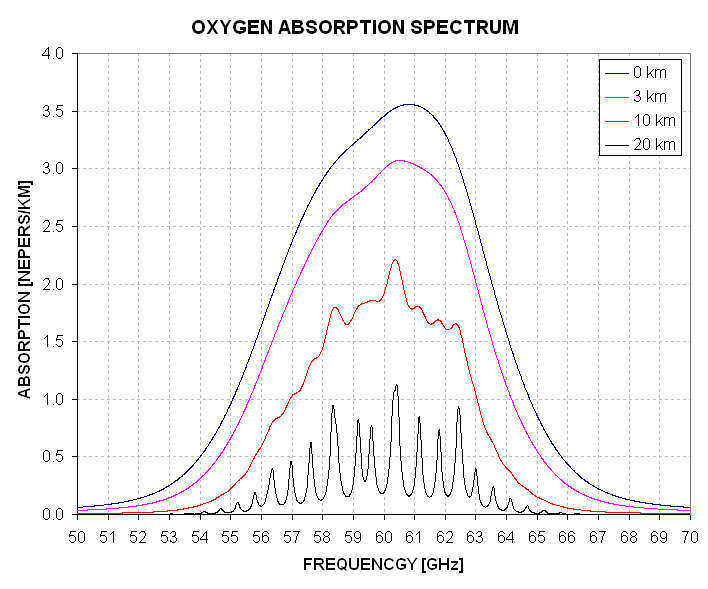
The absorption spectrum is a a function of absorptivity, which equal emissivity, so the above graph also tells you the relative strength of emission of O2 if all levels were at a constant temperature.
If you have an instrument on a satellite examining the emissions at 69 Ghz, you would know that it came almost entirely from the lower 3 km of the atmosphere. You know this because the lower 3 km will emit at that frequency, but the levels above that will neither absorb nor emit at that frequency (or at least, not significantly). In contrast, if you sampled at 60.5 GHz, you would know that the radiation comes mostly from 20 Km or above. That would be because O2 at those levels emitt microwaves, but also because they strongly absorb microwaves, thus filtering out the lower levels. By carefull selection of frequency, you can thus choose among a range of emission weights with altitude, which will be governed by the radiative transfer properties at that altitude as modulated by pressure.
If you have a spare $130, this book will give you all the information you desire (I suspect). Unfortunately, I could not find the original proposal for the MSU or AMSU instruments by google search. Should you be able to do so, they undoubtedly be able to give you far more detailed information.
-
tcflood at 05:50 AM on 23 June 2013Eschenbach and McIntyre - Seeing the BEST part of the Satellite Temperature Record?
To clarify what I don't know a little further, I am aware of pressure broadening. But even if each channel were measuring line shapes (peak widths), how would you be able to separate different band widths at a given frequency? Perhaps part of the answer is that different rotational transitions might have very different intensities as a function of pressure, but wouldn't they as a function of temperature at the same time? How does all of this get resolved?
-
tcflood at 05:16 AM on 23 June 2013Eschenbach and McIntyre - Seeing the BEST part of the Satellite Temperature Record?
I am having trouble understanding how the MSU works. Let me begin with what I think I do know, and let’s see if that’s OK.
The microwave radiometer measures radiance (intensity) of O2 which depends on the ambient temperature at which the molecule finds itself. Normally selection rules say a homonuclear diatomic molecule (like N2) with no electric dipole is transparent to microwave. OTOH, O2 is paramagnetic so the radiation can couple to the molecule’s magnetic dipole, hence leading to absorption and emission. The radiometer has several channels which detect microwave intensity with a voltage response that is digitized and stored.
Each channel has a voltage vs. atmospheric pressure curve that maximizes at a specific pressure and so specific altitude which is different for each channel. Your article is calling these the relative weighting function.
Here’s the question. What is different about what each channel is measuring, and how do that parameter and the voltage allow specification of the temperature and pressure? I assume each channel is somehow tuned to a different frequency by a few wavenumbers, but I’m not a spectroscopist and haven’t been able to deduce the answer. I haven’t been able to find it on the web either – everything stops short of that kind of detail.
-
Paul Pukite at 04:30 AM on 23 June 2013Another Piece of the Global Warming Puzzle - More Efficient Ocean Heat Uptake
I added an extra section on Watanabe's results to a blog post I had written on a proportional land/sea warming model.
http://theoilconundrum.blogspot.com/2013/05/proportional-landsea-global-warming.html
The gist is that I think it may be possible to infer this ocean heat uptake by comparing the land and ocean temperatures in a systematic fashion. There is a fractional value, f, that elates the land to sea surface temperature and which corresponds to the ocean heat uptake, i.e. lower values means that more heat is being sunk by the ocean.

I think Watanabe et all are correct in inferring that the ocean heat uptake is causing the plateauing of the global temperature. It is also clear that this cannot continue for the long term.
-
Hyperactive Hydrologist at 04:18 AM on 23 June 20132013 SkS Weekly News Roundup #25B
Really interesting interview with Bob Sanford regarding the flooding in Alberta and the role climate change has on the intensification of the hydrological cycle.
-
rugbyguy59 at 03:45 AM on 23 June 20132013 SkS Weekly News Roundup #25B
Terra@5: I wonder if the people of New York and New Jersey might have said the same thing....last year.
-
John Hartz at 01:29 AM on 23 June 20132013 SkS Weekly News Roundup #25B
@Terranova #5:
Although you did not provide a direct link to it, I presume that you found the 3.15mm/yr rate of seal level rise for Charleston, SC on NOAA's graph, Mean Sea Level Trend 8665530 Charleston, South Carolina. Am I correct?
-
Stephen Leahy at 01:09 AM on 23 June 2013Peak Water, Peak Oil…Now, Peak Soil?
Boswarm: Since I was at the conference, attended the sessions, interviewed a dozen people and wrote the article let me clarify a couple of things: Iceland has not recovered, it remains Europe's largest desert despite the amazing efforts of the soil cons service. That is what their scientists told me and I quoted them. I spent 2 wks there.
You seem to imply I made this stuff up. Were you at the conf?
FYI It is a 1000 word article, not a transcript of 3 days of talks
Phil L: the article does not mention earthworms, it's in the photo cutline and have no idea who wrote it. Nor did I write the headline. However more than one soil scientist has used the term 'peak soil'.
-
Terranova at 22:01 PM on 22 June 20132013 SkS Weekly News Roundup #25B
Rugbyguy, you're right. But, I just checked NOAA for Charleston's SLR and it is at 3.15 mm/yr. Not a lot to worry about.
-
Paul D at 21:25 PM on 22 June 2013The Consensus Project data visualisation - a history
Chriskoz@18, yes the original had the clusters of circles in a line.
We decided to reduce the width of this app to fit the current web site layout, which meant re-arranging the positions of the clusters.I'm working on a bar chart option in addition to the circles, although I can't say exactly when it will be available.
-
Tom Curtis at 21:17 PM on 22 June 2013The Consensus Project data visualisation - a history
chriskoz @18, click the "Interactive History of Climate Science" on the left bar (just under and to the right of the button for the "Consensus Project".
The interactive history starts with Fourier's classic in 1824, and runs through to 2012. In total, it has 266 Skeptic, 2376 Neutral, and 2493 Pro AGW papers, making the percentages 5.2% Skeptic, 46.3% Neutral, and 48.5% Pro AGW. Excluding Neutrals, that is 9.6% Skeptic, and 90.4% Pro-AGW.
From 1991-2012 inclusive, there were 252 Skeptic, 2100 Neutral, and 2355 Pro-AGW. That is 5.4% Skeptic, 44.6% Neutral, and 50% Pro-AGW, or excluding Neutrals - 9.7% Skeptic, and 90.3% Pro-AGW
On categorization, the Interactive History of Climate says:
"Skeptical Science takes a different approach to Naomi Oreskes' Science paper who sorted her papers into "explicit endorsement of the consensus position", "rejection of the consensus position" and everything else (neutral). In this case, the backbone of our site is our list of climate myths. Whenever a climate link is added to our database, it is matched to any relevant climate myths. Therefore, each link is assigned "skeptic", "neutral" or "proAGW" whether it confirms or refutes the climate myth.
This means a skeptic paper doesn't necessarily "reject the consensus position" that humans are causing global warming. It may address a more narrow issue like ocean acidification or the carbon cycle. For example, say a paper is published examining the impacts of ocean acidification on coral reefs. If the paper finds evidence that ocean acidification is serious, the paper is categorised as pro-AGW and added to the list of papers addressing the "ocean acidification isn't serious" myth.
There are a large number of neutral papers. Neutral does not mean to say each paper was unable to resolve the climate myth. Sometimes, a paper is relevant to a number of climate myths and the results are mixed as to whether it endorses or rejects all the myths. In many cases, the paper doesn't directly set out to directly resolve the myth or the paper has a regional emphasis rather than global. Papers that met any of these criteria are often categorised as neutral."
So, it differs from the Consensus Project in that it classified based on evidentiary contribution, whereas the Consensus Project classified based on endorsement. Further, it categorized based on support of any of 174 climate myths listed at SkS, so that many of the "skeptic" papers in fact are perfectly consistent with AGW.
-
chriskoz at 20:51 PM on 22 June 2013The Consensus Project data visualisation - a history
After having fended off MD's trolls, everyone should be pleased with my perfectly on-topic question:
In 2011, when I was first looking at SkS (that's well before the consensus project) I've seen the "bouncing balls" visualisations here. The visualisation back then, was also about how many papers were "pro-global warming" vs. how many "against" and "neutral". I remember the visualisation very well (a testimony how good such visualisation is a teaching tool): the balls were grouped along the line rather than in triangle; although I don't remember the precise number nor if "pro" vs. "against" amounted to 97%. I cannot find that old visualisation anymore. looks like the consensus project visualisation superceded it.
So, this visualisation is not new. But certainly, the data is new coming from Cook 2013. Finaly the question: what is the relationship between those two? What data was the old visualisation based on and were its categories defined somewhat differently than those in Cook 2013?
-
Paul D at 18:48 PM on 22 June 2013The Consensus Project data visualisation - a history
Don't feed the troll.
-
rugbyguy59 at 15:31 PM on 22 June 20132013 SkS Weekly News Roundup #25B
And guess what Terra.....it already is, and will increasingly be, more dangerous as increased sea levels exacerbate those existing reasons for flooding.
-
DSL at 14:31 PM on 22 June 2013The Consensus Project data visualisation - a history
I hope you do look around, JM< because you'll find that this site has more science-based discussion than any other site on the net -- by a long shot. When I say "science-based discussion" I mean arguments that are based on the published science, and that link directly to that science. The number of linked publications site-wide has to be approaching 10k. Several of the regular posters are published, and the site frequently gets guest posts from working scientists.
So when you post evidence-free rhetoric full of what you might think are sly insinuations, it really just comes off as sort of juvenile tough talk.
I am actually professionaly interested in how your current understanding of climate science has been developed, so I'd love it if you'd provide the evidence that led you to write the posts you've written so far. Who knows, maybe you know something that everyone here doesn't, at least where climate is concerned. I'd be willing to bet that everyone here will be more than happy to discuss any new evidence or fresh interpretations of existing studies. -
James Madison at 13:21 PM on 22 June 2013The Consensus Project data visualisation - a history
Rob, thanks.
Rob and Tom, although we disagree, I appreciate your patience and civility.
Refreshing really.
-
Rob Honeycutt at 13:15 PM on 22 June 2013The Consensus Project data visualisation - a history
James... If you wish to discuss the empirical evidence related to AGW you should do so on this thread.
-
Tom Curtis at 12:32 PM on 22 June 2013The Consensus Project data visualisation - a history
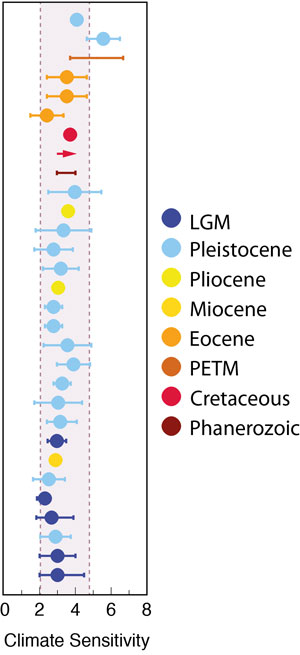
James Madison persists in discussing anything but the topic of this post. The reason is transparently obvious. Where he to discuss climate sensitivity, for example, at the "climate sensitivity is low" rebuttal, and write " If you look at the empirical data, it's simply not there", readers would just scroll to the top of the page and see climate sensitivity estimates from emperical data (not models) from thirty different studies (see below). They would then know immediately that he had not read the article, or not understood it; and that his points were based on thoughtless mouthings of denier talking points rather than actual knowledge of climate science.
Not content with showing his ignorance on one topic, James Madison proceeds to show it on several. He brings up the "no warming in x years meme" (@9). In doing so, he ignores the fact that the rate of increase of GMST over the last twenty years (his chosen time period) is 0.134 +/- 0.105 C per decade, ie, more than 80% greater than the twentieth century average of 0.072 +/-0.01 C per decade (Gisstemp, determined on the SkS trend calculator). In denier speak, warming faster than the rate in the twentieth century is a "pause" in the warming.
Again, by keeping his discussion carefully of topic, Madison avoids the comparison between his talking points and the rebutals which show already that his blatherings are without substance.
Finally he flaunts the fact that he has not read the comments policy by indicating he does not know the meaning of "sloganeering", which is defined therein. And why, after all should he read the comments policy. Though posting here is a privilige conditional on compliance with that policy, he has now shown repeatedly that he has no intention of doing so.
-
Rob Honeycutt at 12:08 PM on 22 June 2013The Consensus Project data visualisation - a history
James... When you make statements like this, "3) maybe, maybe not. What is to discuss? If you look at the empirical data, it's simply not there" you are clearly making a claim that is flatly untrue. You are making a statement from ignorance, and implying that the 30,000+ researchers who have done the hard work to explore the science of climate change don't know what they're doing.
-
Terranova at 11:18 AM on 22 June 20132013 SkS Weekly News Roundup #25B
John, now you are using Rolling Stone as a news source? Wow! Please read those articles and not just the headlines. Coastal cities with low elevations have historically experienced these problems. Nothing new here. I've walked out of my downtown house in Charleston to be greeted by 2 feet of water in the streets. Combination of a high tide, full moon, and some rain. Oh, by the way, a lot of the Charleston peninsula was built over a landfill. Building cities in low lying area is always dangerous.
Moderator Response:[JH] The introduction to this site's Comment Policy reads as follows:
The purpose of the discussion threads is to allow notification and correction of errors in the article, and to permit clarification of related points. Though we believe the only genuine debate on the science of global warming is that which occurs in the scientific literature, we welcome genuine discussion as both an aid to understanding and a means of correcting our inadvertent errors. To facilitate genuine discussion, we have a zero tolerance approach to trolling and sloganeering. [My bold.]
Please take the time to read the entire Comments Polcy and please adhere to it in your future posts.
-
Rob Honeycutt at 11:09 AM on 22 June 2013The Consensus Project data visualisation - a history
James... The point here, as is amply shown in the graphic, as is demonstrated by Cook 2013, is that nearly every research paper being produced on the topic of climate change (which express a position) agrees that human emissions are causing warming.
This is shown through models, it's shown through empirical evidence of all kinds, and is through basic physics. It has been demonstrated nine ways to Sunday, and back again.
I will reiterate my previous point where I said, please consider that perhaps you do not yet fully comprehend the full body of reseach on this complicated issue. Those who do understand, and have spent their entire professional careers working in this field, are nearly all in agreement on the broad aspects of climate change.
-
Riduna at 11:00 AM on 22 June 20132013 SkS Weekly News Roundup #25B
The dumbest claim I have found about global warming and its effects was "we will be able to adapt to overcome those problems" - a claim made on SkS!
-
James Madison at 10:25 AM on 22 June 2013The Consensus Project data visualisation - a history
Rob,
@9, (now 8) well, if you have a large warming showing in the empirical data over say, the last twenty years, I'll take a look. We can leave out the % caused by CO2 vs amplification vs other for the moment to, you know, keep it simple. We should aask them to put this in the app. (just tryin to stay on topic, boss)
@10, looks like you've been snipped, guess it's time to move.
Moderator Response:[DB] Yes, please stay on-topic. Literally thousands of other threads exist at this venue covering the near-entirety of climate science and the denial of it. Typo fixed.
-
Rob Honeycutt at 09:22 AM on 22 June 2013The Consensus Project data visualisation - a history
James... I was paraphrasing this comment: "...what is lacking is substantiation of the premise, that warming will be large, amplified through positive feedbacks and mostly caused by CO2."
-
James Madison at 09:05 AM on 22 June 2013The Consensus Project data visualisation - a history
Paul D,
whatsa "custom"?
ok, what's the purpose of the app if Post 1 is true?
-
Paul D at 09:01 AM on 22 June 2013The Consensus Project data visualisation - a history
Re: James
The blog post is about the javascript app.
'The Project' in this case is the app.
If you want to discuss the data the app uses, then take your custom to another blog post. -
James Madison at 08:36 AM on 22 June 2013The Consensus Project data visualisation - a history
sloganeering, now there's a technical term. Got me lost on that one.
-
James Madison at 08:32 AM on 22 June 2013The Consensus Project data visualisation - a history
Sorry for your misunderstanding Tom.
This goes directly to the Consensus Project, not to the other issues you mentioned.
1) yes, so what, I agree. what is to discuss?
2) yes, so what, I agree. what is to discuss?
3) maybe, maybe not. What is to discuss? If you look at the empirical data, it's simply not there.
As for misrepresentations or skeptics, etc., why would one waste the time? The data tells a much more objective story, now, doesn't it?
Now to revisit my question -
(-snip-)
Moderator Response:[DB] Actually, Tom Curtis is spot-on with his assessment of you. You would do well to listen to any suggestion he takes the time to write up. Further, as others note, take the discussion of the Consensus Project to a more appropriate thread as noted (use the Search function). This thread is about the app visualization. More off-topic sloganeering snipped.
-
Rob Honeycutt at 08:26 AM on 22 June 2013The Consensus Project data visualisation - a history
James Madison... Your position is internally contradictory (as well as off-topic, as Tom points out). You're ostensibly agreeing that 97% of pubished research agrees that AGW is real, and yet are saying that it's not proven. So, what is the 97% of research agreeing on?
Think of it this way: What are the chances that nearly all the published research has missed some critical element of climate that could explain everything we're ascribing to CO2? Are you really willing to bet the future on those odds?
And BTW, we can measure those elements we are ascribing to CO2. So, not only do these highly detailed measurements have to be wrong, we have to have something else that fully explains everything that CO2 explains.
Please consider that perhaps you do not yet fully comprehend the full body of reseach on this complicated issue. Those who do understand, and have spent their entire professional careers working in this field, are nearly all in agreement on the broad aspects of climate change.
-
Tom Curtis at 08:06 AM on 22 June 2013The Consensus Project data visualisation - a history
James Madison @1, it takes a certain sort of perverseness to come to a site with hundreds of posts dealing with the questions you ask, find a post on another topic, and then ask the questions there. I suggest, in answer to your questions that:
3) Climate sensitivity is very likely to be in the IPCC range of 2-4.5 C per doubling of CO2.
Your further questions should be on those posts so that you comply with the comments policy.
Alternatively, on this topic, topic we can discuss the continuing misrepresentations by leading "skeptics" of the level of scientific agreement on AGW; which have made both the paper and this post necessary.
-
James Madison at 07:37 AM on 22 June 2013The Consensus Project data visualisation - a history
OK, I'll bite. Nice project, but what really is the point of the exercise?
As, of course, paper don't care what you write on it.
Consensus or not, what is lacking is substantiation of the premise, that warming will be large, amplified through positive feedbacks and mostly caused by CO2.
See even here: http://www.climate.gov/. (-snip-)?
While increasing GHGs may or should, on net, warm the earth that is not the real question. The real question is, how much it will warm the earth. To date, I have not seen any “useful quantitative results” regarding that question.
Once those quantitative results are in, we can proceed to the next question: what should one do about it.
thank-you
Moderator Response:[DB] Off-topic sloganeering snipped. See this thread for an on-topic explanation as to why your snipped statement is wrong. Lastly, review the Comments Policy of this site for an understanding of the rules of this venue.
-
martin3818 at 06:25 AM on 22 June 20132013 SkS Weekly News Roundup #25B
I have just been playing Arround with you graphics.
Extremely cool!
-
Drinnanc at 05:15 AM on 22 June 2013The True Cost of Coal Power
A very good article and a good discussion. Do you know how the coal plant prices were calculated? Does the calculation include the cost of building the plant and associated transmission or does it assume the plant is in place? Do the renewable prices include the initial hardware costs?
There are externalities for renewable energy sources also.
One can always find things to add or take awy from an analysis like this. However, the conclusions usually stand when most of the factors are included like this study.
In my oppinion any utility executive promoting a new coal fired plant should be removed for obvious incompetatance. Does anyone think a new plant will ever be profitable when it's expected useful life is probably less than a decade.
-
billthefrog at 04:17 AM on 22 June 2013New paper on agnotology and scientific consensus
@12 Mal,
"arrognoramus"
I shall, of course, now claim to have thought that one up myself.
-
Glenn Tamblyn at 18:24 PM on 21 June 2013New paper on agnotology and scientific consensus
WheelsOC
I just read Kitzmiller v. Dover. Awesome!
It's not surprising that Climate Agnomaniacs don't go near a courtroom very often. While the Law is very different from Science, in both disciplines you learn a lot about logic and how to make (or fail to make) a case.
-
Tom Curtis at 17:59 PM on 21 June 2013New paper on agnotology and scientific consensus
Like WheelsOC @13, I learnt what I know of biology by first watching, and then participating in the creation/evolution "debate". From that experience, I have a healthy respect for the teaching power of agnotology, but a clear grasp of its limitations as well. Knowledge gained by refutation of particular arguments will be shaped by the arguments actually made. Thus somebody who learns biology through the creation evolution debate will learn a great deal about peppered moths and bombadier beetles, but very little most other insects. They will gain an indepth knowledge of population genetics, but only a cursory knowledge of ecology. And so on.
The consequence is a group of people very adept at refuting creationists arguments that have been made, but potentially vulnerable to new arguments that exploit the limit of their knowledge.
For that reason, while I can see a usefull role for agnotology as a supplemental part of a course on climate change, I would not want to see it as the lions share. Rather, having taught the subject either systematically (also), or historically, I would finish with a section discussing denier arguments as a means of teaching students to review and apply the knowledge they had previously gained.
-
WheelsOC at 17:22 PM on 21 June 2013New paper on agnotology and scientific consensus
Bedford suggests how how examining and refuting misinformation is actually a powerful way to teach climate science, sharpen critical thinking skills and raise awareness of the scientific method.
My own empirical (read: anecdotal) experience has been exactly this. When I began looking into Creationists' arguments about the validity of this-or-that facet of science which presented a challenged to (or appeared to support!) their beliefs, I had to then read what the scientists themselves were saying about these things. Looking into those "debates" (to use a generous term) gave me a much, much deeper understanding of evolution, biology, science generally, AND the philosophy of science than all of my formal schooling put together.
A lot of that knowledge carried over to serve me well when evaluating the "two sides" of the climate issue. Even if my knowledge of science hadn't been so greatly expanded through the experience, the similarities between so-called "skeptics of AGW" and anti-evolutionists was overwhelming. They displayed the same failures of critical thinking, the same tendency to misinterpret or misrepresent, and the same inability to back down despite overwhelming facts and evidence to the contrary. All they had to rely on was a wall of anti-knowledge: talking points that were asserted as facts but really had no factual basis. These filled up the spaces in their mental stockpile where real knowledge could have fit and influenced their worldview, and they're wedged in so tightly that they keep contrary facts out in the cold. For example, the Young Earth Creationists are absolutely sure that the Grand Canyon was both laid down and then carved out by the waters of Noah's flood. The climate denialists convince themselves that it's impossible to know what's going on with the climate system if that would mean acknowledging the full extent of anthropogenic warming. This anti-knowledge insulates them from the uncomfortable truths; hence the science must be unsettled and uncertain enough to allow for non-artificial factors, if they even admit that there's any climatary pattern to explain at all.
Quote-mining, selective citations, misrepresentations, conspiracy theories, appeals to crackpot 'experts,' and nice-sounding but utterly baseless assertions all contribute to the wall of anti-knowledge by providing factual-seeming nuggets that can be used like facts to construct an argument or defend a viewpoint. They're fact substitutes. Creationists and climate denialist gurus both have huge stockpiles of them from which the average mook could pick and choose to support whichever version of wrongheadedness they favored, which were then regurgitated into public discourse at every level (except the rarified atmospheres of the scientific literature, where the primary audience knows better). At least there is a silver lining to this proliferation of misinformation; resources like SkepticalScience come along and put the myths to rest in plain terms and with scientific references that leave the reader more educated and informed than they were going in. It's a good way to pluck the offending nugget out of someone's gullet before they spew it all over new venues. But that necessary service may not be enough to convince the public not to swallow those anti-knowledge nuggets in the first place.
Creationistm's biggest recent campaign, the Intelligent Design movement, was dealt a lethal blow in Kitzmiller v. Dover not only by the plaintif's scientific superiority and plainspoken rebuttals but also by the defense's own testimony which showed how terribly anti-science and religiously motivated their actions were. It has not been able to recover its pre-Dover glamor in the popular mind since that stunning court case. I can only hope something similar happens to take all the wind out of climate denialists' sails, and soon (assuming the necessary event isn't some kind of natural disaster). The more deeply entrenched these anti-knowledge campaigns become in the populace, the more we'll all suffer going forward and the less we'll be able to leave behind for the generations that follow.
-
KK Tung at 13:20 PM on 21 June 2013The anthropogenic global warming rate: Is it steady for the last 100 years? Part 2.
Two corrections to my post 179:Using your exact example and your exact method (with linear trend as a regressor for human), we repeated your experiment 10,000 times, and found that the true human answer lies within the 95% confidence level of the estimate 94% of the time. There are two errors in this sentence of mine: 94% should be 93%, and the (....) should be deleted, because we were using the exact method of Dumb Scientist, who used the exact human regressor. DS also pointed out this second error on my part. Sorry. I wrote that post on a small laptop while traveling without checking/scrolling the posts carefully.
-
Mal Adapted at 07:51 AM on 21 June 2013New paper on agnotology and scientific consensus
billthefrog:
I have been trying for some time - funny, my wife just chuckled as she walked past the screen - to ascertain if there is a word in the English language to describe this weird amalgam of arrogance and ignorance.
How about "arrognoramus" 8^D?
-
DSL at 07:01 AM on 21 June 20132013 SkS Weekly News Roundup #25A
By the way, Joe Bastardi's on the hook over at Rolling Stone (comment stream): http://www.rollingstone.com/politics/news/the-10-dumbest-things-ever-said-about-global-warming-20130619
Trying desperately to defend the main article's dig at him, and spreading it thick. -
Dumb Scientist at 02:52 AM on 21 June 2013The anthropogenic global warming rate: Is it steady for the last 100 years? Part 2.
Given your new example, which I think is unrealistic in the shape of the total global mean temperature not having any trend before 1979 and most of the trend occurring after, I would not have chosen to have a linear function as a first guess in the multiple linear regression procedure. I would choose a monotonic function that looks like the the total trend as a first guess, such as QCO2 discussed in part 1 of my post. Using your exact example and your exact method (with linear trend as a regressor for human)... [KK Tung]
Actually, both of my simulations used the (nonlinear) exact human influence as a human regressor, specifically to avoid this objection. You can verify this by examining my code: "regression = lm(global~human_p+amo_p)". Since correcting this misconception might alter some of your claims, I'll wait to respond until you say otherwise.
-
grindupBaker at 02:17 AM on 21 June 20132013 SkS Weekly News Roundup #25A
"Antarctic melting from underneath". Obviously. I presume it's useful for projection data if they can quantify it, to project the rate once it really gets going. Since ocean temp is 4.05 an increase to 5.55 to 7.05 for CO2x2 (depending on whether, say, 2.0-3.0 Celsius is final CO2x2 radiative balance restored after ocean equilibrium and whether oceans dissolve enough CO2 to slow it) should have an effect considering the huge proportional increase above the freeze/melt point of water (presumbly the -1.9C for sea water). Balmaseda, Trenberth, and Källén (2013) asserts 200+-40 ZettaJoules added to oceans since 1958. Since 11,000 to 17,000 ZettaJoules must be added to oceans before the oceans will permit the surface to restore its radiative balance of CO2x2 for my example +2.0-3.0 Celsius, it would be interesting to know how much ice melt for the trivial 200 ZettaJoules thus far.
"Global warming appears to have slowed lately" Plumer, Wonkblog, Washington Post states "the “missing heat” may be lurking in the deep layers, 700 meters below the surface" but SKS Posted on 25 March 2013 by dana1981states categorically "A new study of ocean warming has just been published in Geophysical Research Letters by Balmaseda, Trenberth, and Källén (2013)." and "...has been found in the deep oceans...". What is the certainty of this paper and if >90%, say, then why is Plumer, Wonkblog saying "may be lurking". The slope of B,T & K (2013) indicates 0.85 wm**-2 average 2000-2010. This seems crystal clear. I understand that the buoys' data of prior decades likely has suspect accuracy, but typically these random errors cancel well to near-zero if a large enough statistical sample is used and I see no reason why buoys' data of prior decades would affect the slope 2000-2010.
On the same topic when are you educated bods going to tell media suits and the public what "global warming" is so that this nonsense stops ? Typically for science, what the subject is would be outlined fairly early in a discussion of the science subject, not 20 years after "the science is settled".
-
ShaneGreenup at 00:44 AM on 21 June 2013New paper on agnotology and scientific consensus
"Bedford suggests how how examining and refuting misinformation is actually a powerful way to teach climate science, sharpen critical thinking skills and raise awareness of the scientific method."
Is this a good time to mention http://rbutr.com again?
-
Eric (skeptic) at 00:32 AM on 21 June 2013Citizens Climate Lobby - Pushing for a US Carbon Fee and Dividend
Sphaerica and Dumb Scientist, thanks for the replies. I like DS's conclusion as expressed in this sentence from the second link: "If competitiveness provisions were to be used as a sweetener to enable the adoption of domestic climate legislation, the WTO consistency of such provisions is, therefore, crucial."
If it works it reduces the need for a rigid global carbon fee agreement which probably would not pass, it incorporates the carbon issue into broader trade agreements which gives it more weight, and it incentivizes every country to raise their own fee. In poorer countries it seems to me that the workers there would effectively get a wage increase based on the energy intensity of what their country produces.
Prev 876 877 878 879 880 881 882 883 884 885 886 887 888 889 890 891 Next


