


 Arguments


Recent Comments
Prev 885 886 887 888 889 890 891 892 893 894 895 896 897 898 899 900 Next
Comments 44601 to 44650:
-
sylas at 14:55 PM on 5 June 2013Lu Blames Global Warming on CFCs (Curve Fitting Correlations)
The journal IJMP-B is a low impact journal, yes; but it serves well in its particular focus; which is mainly condensed matter physics, superconductivity and the like. The problem is most likely somewhere within the editorial board, allowing this otherwise respectable if low impact journal to be a soft touch for pseudoscientific climate denial. It is something the editorial board really needs to look at seriously.
Declaring my own personal interest: I'm one of the six people who helped put together a response to the nonsensical Gerlich and Tscheuschner (2009) at IJMP-B, with Joshua Halpern as the main author of the rebuttal piece.
-
JohnMashey at 14:26 PM on 5 June 2013Lu Blames Global Warming on CFCs (Curve Fitting Correlations)
1) The journal that published this also published Falsifiation Of The Atmospheric CO2 Greenhouse Effects within The Frame Of Physics, Gerlich, G. and R. D. Tscheuschner (2009). Needless to say, it did not accomplish that goal, but one has to wondre about the journal.
2) The most puzzling is why on Earth U Waterloo, generally a fine scholl in science and engineering, put out big press release on this. Professor ought to be free to publish what they can get accepted ... but I don't think a university is *required* to create a gushing press release for every paper. Sadly, this diminishes U W's reputation in my mind, anyway.
-
jyyh at 14:06 PM on 5 June 2013Lu Blames Global Warming on CFCs (Curve Fitting Correlations)
Thanks Dana for going by numbers dissecting this roadkill of a study.
-
Tom Dayton at 11:41 AM on 5 June 2013Imbers et al. Test Human-Caused Global Warming Detection
Stealth, to illustrate and augment the advice given you about modeling by other folks in this thread, I encourage you to read a brief history of modeling here at Skeptical Science, and for more the detailed history by Spencer Weart. Note that even in the 1820s, Fourier was using a model. Not a computerized model. Not a model as complex as the ones used today. Each improvement in the science involved an improvement in the models, but only relatively recently did they get "complicated" in modern terms. Even the earliest models were quite successful in predicting global temperature relative to other possible predictions such as "the Earth is frozen solid" and "the Earth is cooling drastically" and "the Earth is maintaining its temperature" and "the Earth will be as hot as the Sun in fifty years." Complication is needed only to fine tune the predictions by the desired amount.
You can try some simple models yourself by getting an introductory textbook such as David Archer's "Global Warming: Understanding the Forecast," or by taking notes while watching his free online lectures from his class at the University of Chicago.
Tamino has illustrated a simple climate model you can run without a computer if you have a lot of time, or with a spreadsheet if you don't mind using a computer. He also has a followup that's only a bit more complicated.
There are a bunch of other climate models that are simple enough for learning and teaching. One list has been compiled by Steve Easterbrook.
You also might be interested in Steve Easterbrook's comments on verification and validation (V&V) of climate models. Steve once did V&V for NASA.
-
GreenCooling at 11:40 AM on 5 June 2013It's CFCs
Apologies, the figure above with 3 graphs was adapted from Velders et.al. (2007, 2009), but it is actually figure 5-6 from the Scientific Assessment of Ozone Depletion: 2010, a collaboration of WMO, UNEP, NOAA, NASA & EC, see page 5.29 for associated explanation.
-
Dave123 at 10:49 AM on 5 June 2013Imbers et al. Test Human-Caused Global Warming Detection
Hi SASM-
My understanding of the magnetic impulse hypothesis is that the energy dumped into the upper atmosphere by a coronal mass ejection is supposed to radiate/convect to the ground, and this is being ignored in conventional measurement of TSI. That doesn't actually happen.
As this article indicates, the green house gases in the thermosphere reradiate 95% of the energy back into space....sort of an energy shield out of science fiction. (But it being cited by people who mince words as proof that AGW isn't real because in this case CO2 acts as coolant)
The article also note that as big as this energy dump was, comparted to the earth's outbound IR buget the amount is very small, and wouldn't ever be notice by anyone on the surface of the earth. Compare this qaulitatively with the feeling of the sun on your face or a cloudy night being warmier than a clear one.
"footnote: (1) No one on Earth’s surface would have felt this impulse of heat. Mlynczak puts it into perspective: “Heat radiated by the solid body of the Earth is very large compared to the amount of heat being exchanged in the upper atmosphere. The daily average infrared radiation from the entire planet is 240 W/m2—enough to power NYC for 200,000 years.”
-
Glenn Tamblyn at 10:33 AM on 5 June 2013Imbers et al. Test Human-Caused Global Warming Detection
Stealth
I come from a combined MechanicalEngineering/IT background. So lots of thermodynamics etc and software - although not modelling.
An important point to consider when thinking in terms of models is the scale (in space, time, magnitude) of the different factors. To take an analogy:
I install a new swimming pool in my backyard. To fill it I throw the garden hose in and turn it on. This may take daya to fill the pool. My family are impatient so they start using the pool before it is full.
If I want to model what will happen to the water level I have different factors to consider-
- volume and shape of the pool which might be complex but is static.
- Flow rate through the hose
- Volume of my families bodies and how much water they displace
- How often and when they use the pool
- how much they splash around and thus how many and what waves they make
- Whether the dog occassionally leaps into the pool chasing a frisbee.
Although there are multiple factors, they are not all equal. The Volume/Flowrate factors are the dominant factors and they are actually fairly simple to model. To a first order approximation that is all I need to model.
When I factor in the displacement of my families bodies there are multiple questions to be resolved - how often and when do they use the pool, fully submerged or only partly, do they all use it at the same time etc. But the magnitude of the total effect they can have is small compared to the total volume of the pool.
Then when I look at the impact of the waves they create it gets even more complex - all the factors previously plus what are they doing in the pool - just quietly floating, swimming laps, fighting, diving, splashing water out of the pool. Are they relaxed adults or hyperactive teenagers. How many high caffiene energy drinks have they had. Again much more complexity but now dealing with smaller scale phenomena; not really the average level of the pool anymore but the spatial distibution of its level in the form of waves.
But our first order approximation is still pretty close to the right result.
Climate modelling is similar. A range of basic processes that aren't as complex as people think, leading to a general result. Then additional details that add complexity and more detail to the result but don't significantly change the broad result.People often look at the complexity of weather and asume that this is the starting point for Climate modelling when it isn't. Climate modelling actually comes at the problem from the opposity direction - start with the broadest mechanisms then seek to progressively refine the result through more detail and complexity. Interestingly the history of Climate Models has been that the results produced by the very earliest models haven't changed much as they have been refined to the very much larger models of today.
The modellers have been trying to do two things by adding more features and detail.
- Try and determine whether any of these additional complexities have changed the broad conclusions of the simpler models. By and large they haven't.
- Try and determine in greater detail what the trajectory of the warming will be, what path it will follow to the final conclusion. This has had some success but not as well. Models of Arctic sea ice haven't captured the pace of melting very well, they aren't modelling changes in the Trade winds very well etc.
The problem is that if we want to compare real world changes with the model predictions, in shorter time frames it is harder to discern the broader trends from beneath the 'noise' of the smaller details in the data, and the models don't do as well at modelling the smaller details.
So some people fall into the fallacy of thinking that if the models can't capture the detail as well, that this in someway constitutes evidence that they can't model the basics. If I can't model the waves on my pool very well, then surely I aren't modelling the volume of the pool and the flow rate in the hose very well.
Also it is very easy to look at the complexity of weather and asume that this is the starting point for the level of complexity in modelling climate. However climate is actually the average of the weather and the average of the weather patterns are actually simpler than the details - storm tracks tend to run here, rainfall bands are here, ocean currents follow these tracks etc.
Then the underlying drivers for these patterns can be simpler still. Evaporation is strongest in the tropics so more upwelling of air happens there. Air cools and changes density at known rates with altitude, warming water by x degrees will change it's density by y. At it's simplest adding a certain amount of Greenhouse gas will restrict the flow of energy to space by X Watts/M2 , the Earths surface needs to warm by Y degrees to restore the Earth's energy balance.
-
scaddenp at 08:15 AM on 5 June 2013Imbers et al. Test Human-Caused Global Warming Detection
Stealth - if you are going to wallow in likes of Watts or McIntyre, then I hope you will try to ensure that you opinions are formed on the basis of published science and not misrepresentation of science. When you are presented with conflicted information, what method are you going to use evaluate truth here?
-
scaddenp at 08:11 AM on 5 June 2013Imbers et al. Test Human-Caused Global Warming Detection
Paul D - sorry, the paper has a data page which produces plots for various forcings. You can do say a lat/lon map for 2xCO2 with 100 year response and then compare that to an equivalent Solar forcing.
-
Manwichstick at 06:55 AM on 5 June 2013Imbers et al. Test Human-Caused Global Warming Detection
@SASM #23
modeling is always wrong (meaning it is never fully correct under all cases) and that the real world is different than the lab world, which is different than the modeled world, at least for aircraft and radars. I strongly suspect the climate is even more complex than what I have dealt with, which makes me very skeptical that climate scientists have a full grasp on the complexities of the climate.
I would like to chip in with a thought about climate modelling -big picture- which your comment reminded me of. A model by definition is "wrong", but lately I have been trying to use the word "incomplete" instead so that I don't create the impression that a model has no utility. I would agree that our planet's climate system is more complex than smaller scale models pertaining to stealth aircraft design - however that doesn't mean that climate models have less predictive power than the models you have dealt with.
I like to use the example of radioactive elements. The moment when an individual nucleus will blow is fundamentally unknowable. However, from this utter lack of causation knowledge comes a term "half-life" that is startilingly accurate in it predictions. Sometimes an infinite mess of choas when looked at in small chunks is freakishly predictable in the large scale. Like-wise, I think the earth's climate system is surprisingly reducable to a planet-wide, yearly average temperature, despite the appearence of innumerable interactions and parameters depending on how deep you go in the oceans, how high in the atmosphere, and with what 3-D pixel size resolution you care about. And I don't think we've seen a great increase in accuracy in our climate models since in the early eighties. Those simpler models spat out numbers with great "big picture" accuracy.
From a distance, the earth is a tiny speck of wet rock , with a thin coating of gas, circling a heat source. Dead simple to calculate its average temperature over long time scales... well, maybe having to guess a bit about aerosols...
Now models zoom in more, calculate more, they add more coupling between the various "spheres" (litho, cryo, atmos, oceans) but even after decades when you get the same big picture answer for the earth's average temperature, you realize these "complex" models are merely arguing over who/what/where gets the energy that is sloshing around our planet. Does chopping the energy units into smaller and smaller peices and putting GPS-like tracking on them as they move around really make that much difference? When you put a bubble around the earth and measure every thing that is going in and out - this is something much simplier to model than wing dynamics at different altitudes, or whatever cool classified things you were working on.
Stealth, earlier you said, "I’m sure CO2 does absorbs some IR wavelengths; ".
That is so important to focus on -CO2 MUST warm the planet. If you still have any doubts, visit a lab with an infrared microscope and exhale on it. You will get the same absorption pattern you see from satellites looking down at the earth. So, with no way to argue against increasing CO2 causing warming, the interesting questions become: warming where, how fast, will it be dangerous, is there anything that will cool us down, etc.
The questions we want climate models to answer now are much more specific: will the water level in this river go up or down in the next 30 years? What is the climate like on that exo-planet? Would you recommend I build my hut on this hectare of permafrost here?
You mentioned some of the websites you go to for information. I've recently become sad about the futility of the Anthony Watts site. I think of the wasted hours people put in there under the partial guise of growing our scientific knowledge. If the purpose is public opinion and political medling, then it is less wasteful - but I have found it to be a very irrelevant space for scientific knowledge as it pertains to climate change. It feels like I'm watching a movie starring teenagers who get deeper and deeper into trouble because they refuse to take the advice of the police.
-
funglestrumpet at 06:52 AM on 5 June 2013Communicating climate change at the Maths of Planet Earth conference
For an interesting insight into energy usage and what it could mean for climate change the website 'Our Finite World' run by Gail Tverberg, a highly regarded actuary, is well worth a visit. Her most recent post Oil Limits and Climate Change is, as you might guess, particularly relevant to sks followers.
Her take on energy supply indicates that soon we will not be able to maintain BAU simply because oil is becoming ever more difficult - and thus ever more expensive - to extract, to the point where it will be simply unaffordable for many. Unfortunately, this also means that we will not be able to feed the population as it now stands, let alone in the near future when it hits nine/ten billion. Gruesome as the thought is, it does mean that energy use will decline significantly and with it CO2 production. I suppose we should be glad, but I find little of cheer in the implications of same.
-
Paul D at 06:29 AM on 5 June 2013Imbers et al. Test Human-Caused Global Warming Detection
scaddenp@18
I might be missing something, but I can't see a mention of varying insolation in that Hansen paper abstract.
-
kiwipoet at 05:06 AM on 5 June 2013The 5 characteristics of global warming consensus denial
Good comment, jdixon1980. I've always thought the funding argument absurd because all scientists are dependent on funding, all researchers need grants. What about those physicists/mathematicians of M Theory with their eleven dimensional multiverse? What could be crazier than that? They have to keep juggling those eleven dimensions just to keep their funding going! And don't get me started on black holes! Now there's a racket!
John Hartz is right: stay clear and keep sane!
-
KK Tung at 04:50 AM on 5 June 2013The anthropogenic global warming rate: Is it steady for the last 100 years? Part 2.
Clarification to my post 127: There are so many parts to the yes or no question that you posed that my single "No" answer may not fully answer the question:
Forgetting for the moment whether the scenario in the thought experiment is plausible or not, do you agree that the thought experiment does show that there can be circumstances where the regression analysis can fail and missattribute warming due to anthropogenic emissions to the AMO? Yes, or No.
The answer is "No" to the first part of the answer: "do you agree that the thought experiment does show". The thought experiment is trivial and inappropriate as I explained later. The answer is "yes" to the second part of the question "do you agree there are circumstances where the regression analysis can fail".
-
KK Tung at 04:39 AM on 5 June 2013The anthropogenic global warming rate: Is it steady for the last 100 years? Part 2.
In reply to Dikran Marsupial's post 126: I am not sure if you understood what I was trying to say in my post 125. Of course when there is no AMO in your data you are not going to find an AMO using the method of multiple linear regression analysis (MLR). So the answer is No, not because of the fault of the method, but because you should not have used that method.
On the anthropogenic trend, the way you applied the MLR is to break up the nonlinear anthropogenic trend into a linear part and a quadratic part, using the two regressors, which were called by me in post 125 as linear and quadratic. If you ask the questionh, does the regression coefficient of quadratic in the MLR include the true value of the quadratic term in your anthropogenic trend, the answer is yes. And if you ask the question, does the regression coefficient of linear in the MLR include the true value of the linear part in your anthropogenic trend, the answer is also yes. So the MLR gives you the right answers. But what you were doing is to rename linear anthropogenic, and ask the question, does the regression coefficient of this newly named anthropogenic response include the true value of the anthropogenic response in the observation that you constructed, the answer is not necessarily, depending on how large your quadratic term is.
Please don't get me wrong. I am not here to defend MLR as a fail-proof method. It can fail, and we need to always on guard for that happening. But in this case it "fails" only because you gave your regressors wrong names.
-
Rob Honeycutt at 03:59 AM on 5 June 2013Imbers et al. Test Human-Caused Global Warming Detection
Stealth @23... I think you'll find people here to be very supportive of taking a genuinely skeptical approach to this issue. It is a very complex science, but there are some very fundamental elements that drive the scientific understanding of climate.
Primarily, the scientific understanding of climate change is not based on modeling or hockey stick graphs. It's based on the fundamental physics of atmospheric greenhouse gases that has been known for 150 years.
I think you'll find that climate modelers actually would agree with you when you state, "modeling is always wrong (meaning it is never fully correct under all cases)." That's why climate modeling is about establishing boundary conditions rather than attempting to specifically model exactly what the climate is going to do. That is why you'll always see climate scientists referring to "model ensembles" rather than any specific model.
-
Doc Snow at 03:29 AM on 5 June 2013Imbers et al. Test Human-Caused Global Warming Detection
On the question of the Sun, and its impact on Earthly climate, it's worth noting that the question of Solar variability has been revolutionized by satellite observations. Prior to the satellite era, variations in solar output were less than experimental error, and it was commonplace to use the term 'solar constant' to refer to a particular defined measure of solar energy:
http://en.wikipedia.org/wiki/Solar_constant
Since then, the term has fallen largely out of use.
However, that doesn't mean that measurement of solar output was non-existent prior to satellites. Indeed, the history goes back to the late 18th century at least:
http://doc-snow.hubpages.com/hub/Fire-From-Heaven-Climate-Science-And-The-Element-Of-Life-Part-One-Fire-By-Day
It's worth mentioning Claude Pouillet in this context; he was able to make a pretty decent estimate in the 1830s--better, in fact, than the formidable American astronomer Samuel Langley, some of whose data was so serviceable to Svante Arrhenius in calculating the first model of CO2-induced warming, back in 1896. I've written about Poillet, and Langley and Arrhenius, too--for those who may be interested, those stories are at:
http://doc-snow.hubpages.com/hub/The-Science-of-Global-Warming-in-the-age-of-Napoleon-III
http://doc-snow.hubpages.com/hub/Global-Warming-Science-And-The-Dawn-Of-Flight
-
tcflood at 02:02 AM on 5 June 2013Another Piece of the Global Warming Puzzle - More Efficient Ocean Heat Uptake
MA Rodger,
I just gleaned from the paper that they get the 0.6(+/-0.4) by assuming their OHC is complete and accurate and calculating back to what the outbout LWR must be. I have to say that it would be much wiser to just say we don't have a good number on the OLWR and carry on with our analysis of total global heat change and its relationship to average global near-surface air temperature. Perhaps the public needs to be trained to key on total heat changes rather than the AGNSAT (if possible).
-
tcflood at 01:47 AM on 5 June 2013Another Piece of the Global Warming Puzzle - More Efficient Ocean Heat Uptake
MA Rodger,
Thanks for taking your time to respond.
I'm mainly interested in the error analysis and am apparently having trouble with the math. The numbers in the figure are the same as in the paper. Please check me ...
SWR(in) - SW(out) - LW(out) = TOA imbalance
= 340.2(+/-0.1) - 100.0(+/-2) - 239.7(+/-3.3)
= 0.5(+/-3.9)
I have been trying to come to grips with the old denialist chestnut that there was no "missing heat." If the error in the imbalance is 8 x the value, perhaps the best answer is that the initial assertion was ill-advised becasue we can't say whether there was energy missing or not from our global heat accounting (including all the spheres - atmo, hydro, cryo, etc.). This then leaves us unencumbered to deal with "15 year heating pauses" as the natural result of changing O-A heat transfer patterns without getting sidetracked by the red herring of the "missing heat" cavil.
-
StealthAircraftSoftwareModeler at 23:25 PM on 4 June 2013Imbers et al. Test Human-Caused Global Warming Detection
Okay, there's a lot of information here that I would like to take a closer look, and it will take a little bit to go through it. This post and thread is exactly what I have been wondering about, which is specifically trying to address and measure how much warming is due to AGW. I’ve done a lot of general internet research over the last year or two and have been on this site, Real Climate, Anthony Watts’ site, Roy Spencer, Steve McIntyre among other sites trying to gather information and fuse it together into what I think it a coherent picture. I expect that mentioning some of these names on this site might be offensive, so I apologize in advance.
My general philosophy is that I believe none of what I hear and only half of what I see. My background is dual BS in Physics and Computer Science with 30+ years in software development and modeling, most all of it related to stealth aircraft -- real time software systems operating in real world environments to support pilot decision making process. It requires modeling aircraft, weather, terrain, weapons, sensors, threats and so on. Lots of optimization algorithms to maximize opportunity and minimize risk. It has been a fun and cool job, and very interesting. If I have learned one thing, it is that modeling is always wrong (meaning it is never fully correct under all cases) and that the real world is different than the lab world, which is different than the modeled world, at least for aircraft and radars. I strongly suspect the climate is even more complex than what I have dealt with, which makes me very skeptical that climate scientists have a full grasp on the complexities of the climate. This is not a criticism of climate scientists, it is just hat things are hard and complex. After all, if it was easy, then everyone would agree and there wouldn’t be much debate.
Give me a day or two to wallow in these links and I’ll post some more questions shortly. Thanks for the feedback.
-
Dikran Marsupial at 23:24 PM on 4 June 2013The anthropogenic global warming rate: Is it steady for the last 100 years? Part 2.
Prof. Tung wrote: "How do you know the true value for the AMO is zero?"
I know this by construction. The point of the thought experiment was to demonstrate that there are hypothetical sitiuations where the regression model used in your paper underestimates the effect of anthropogenic emissions on observed temperatures and missattributes this warming to AMO.
Forgetting for the moment whether the scenario in the thought experiment is plausible or not, do you agree that the thought experiment does show that there can be circumstances where the regression analysis can fail and missattribute warming due to anthropogenic emissions to the AMO? Yes, or No.
-
MA Rodger at 20:30 PM on 4 June 2013Another Piece of the Global Warming Puzzle - More Efficient Ocean Heat Uptake
tcflood @19 &20.
Stephens et al 2012 is paywalled for miseryly mortals like me. Yet the figures provided rather strongly suggest that the 0.6 W/m^2 is the intended take-home number.
However I have the feeling you are not just interested in Stephens et al 2012, but more in the TOA imbalance.
The 1.0 W/m^2 figure which JoeT @4 questioned with his introduction of the Stephens et al 2013 figure was introduced into Meehl et at 2011 for use in 21st century simulations and based on the present day 0.9 W/m^2 of Treberthetal et al 2008 and the 0.85 W/m^2 of Hansen et al 2005, the former an instrument-based study and the latter using models confirmed by OHC data, particularly Willis et al 2004 whose data for 0-750m OHC Hansen et al 2005 used to infer a 0.6 W/m^2 imbalance in this depth of ocean.
OHC was not as well measured back in 2004 as it is today. The Levitus 0-2000m OHC (graphed below) gives an average OHC rise equal to 0.8 W/m^2 of global warming over the last 8 years. To that must be added the OHC below 2000m and the ice loss & surface/atmosphere warming. So I would reckon that proposing a 1 W/m^2 TOA imbalance would perhaps be a tad high but not ridiculous.

-
Glenn Tamblyn at 20:13 PM on 4 June 2013Imbers et al. Test Human-Caused Global Warming Detection
Yeah Kevin, forgot that part.
-
Kevin C at 19:22 PM on 4 June 2013Imbers et al. Test Human-Caused Global Warming Detection
Glenn@19: I think you forgot the albedo factor (0.7), so your solar forcing variation should be even smaller - about 0.1W/m2. Similarly for the trend term.
-
dkaroly at 18:25 PM on 4 June 2013Communicating climate change at the Maths of Planet Earth conference
John, this should be an interesting conference. I will be giving a plenary talk on Thursday on "Modelling variations in extreme weather and climate events and understanding their causes". Unfortunately, I can't be at the conference when you give your keynote on Monday, but I hope to catch up with you on Thursday.
Response:[John Cook] Look forward to meeting and your talk, David.
-
Glenn Tamblyn at 17:07 PM on 4 June 2013Imbers et al. Test Human-Caused Global Warming Detection
jmorpuss
My reading of your link is that Atlant doesn't release electrons. It releases ionized particles, or possibly ionized atoms or molecules. And they are generating a Corona Discharge to produce them. It isn't simply the presence of a high voltage.
So on that basis I would expect that high voltage powerlines alone wouldn't generate any. Anything that caused arcing from such power lines might, but that is a fairly rare event. And the quantities of ionised particles needed to influence clouds would be substantial so anything coming from such arcing events would have miniscule impact.
-
Glenn Tamblyn at 16:59 PM on 4 June 2013Imbers et al. Test Human-Caused Global Warming Detection
Stealth
Solar output as measured by satellites is around 1366 W/M2 here at the Earths orbit around the sun. Over the 11 year solar cycle it varies by around +/- 0.5 W/M2 so less than 0.04% variation around its average. Over the history of observations this has declined slightly, by perhaps 0.1 W/M2
Comparing solar output strength to radiative forcing requires that we adjust for the fact that the frontal area the Earth presents to the Sun is only 1/4 of the Earth's surface are so this gives us a solar cycle variation at the Earths surface of +/- 0.125 W/M2 and a longer term trend variation of -0.025 W/M2.
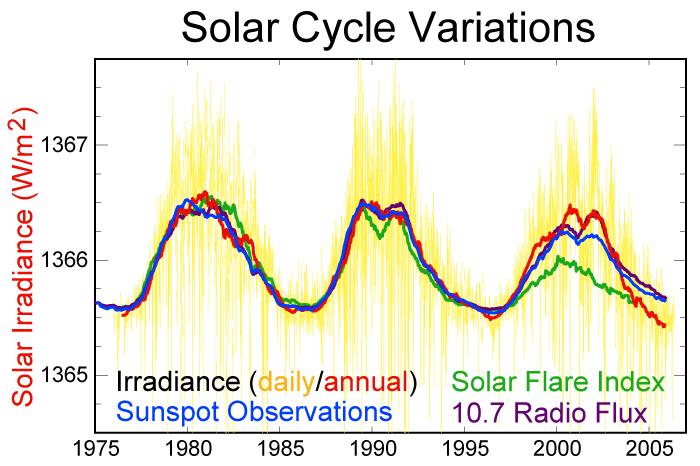
In contrast the direct forcing due to CO2 is given by the eqn
F = 5.35 ln(C/C0)
where C0 is taken as being preindustrial levels of 280 ppm. Currently we are at around 400 ppm. This gives a CO2 alone a forcing of 1.9 W/M2 since pre-industrial times.
So the complete solar cycle is only around 7% of the CO2 forcing and the long term trend change is only around 1.3% of the CO2 forcing, and negative.
-
KK Tung at 16:55 PM on 4 June 2013The anthropogenic global warming rate: Is it steady for the last 100 years? Part 2.
In reply to post 123 by Dikran Marsupial:
It appears that your entire case hinges on a misidentified word.
"The regression coefficient for AMOd is 2.7685 +/- 1.2491, note that this interval DOES NOT contain the true value, which is zero."
How do you know the true value for the AMO is zero? Must it be that in your mind you identified the 70-year oscillation as the AMO? But by construction your AMOd regressor does not contain any 70-year signal, nor does your observation. In fact there does not exist any 70-year signal anywhere in your example. So it trivially follows that you will not get any 70-year signal by multiple regression. It now becomes a word game on what you call your AMOd. You could just as well call it the "quadratic". Then you always get zero for the nonexistent 70-year AMO cycle in your MLR.
It is also easy to understand why your MLR yields a linear trend when the anthro component in your synthetic observation consists a linear plus a quadratic trend. Let's for a moment ignore the 150-year natural cycle; it does not affect the argument that I am making. Then your AMOd is just the anthro trend minus the linear trend, which is just the quadratic term. When you do the MLR with AMOd being the quadratic regressor, and you use a linear trend for your anthro regressor, observation then gets divided into a quadratic term that goes into AMOd and a linear term that goes into anthro. There is no secular trend left in the residual. The final adjusted anthro trend is the same as the regressed linear trend.
To put it in a different way, without the 150-year natural cycle (which is a red herring in your example), observation=linear+quadratic+noise. The two regressors you have now could have been called linear and quadratic. After one round of MLR, the two regressors plus noise give a good model of your original observation. Now let's rename linear the anthro regressor, and quadratic the AMOd regressor, and conclude: the MLR gives an erroneous linear trend when the true value is linear plus quadratic, and the true value of the AMO, which is zero for the entirely missing 70-year cycle, is not included in the 95% confidence interval of regression coefficient of AMOd.
There is no contradiction between the MLR result and their true values in your example. The contradiction arises only when you give them wrong names.
-
GreenCooling at 14:31 PM on 4 June 2013It's CFCs
Further to the above @10, I hope the following graphs may be of interest:
These Velders figures illustrate well the 'world avoided' by the Montreal Protocol CFC phase out (and the accelerated HCFC phaseout agreed in 2007), and the HFC projections by volume and CO2-e impact. While not at this stage likely, reducing HFC emissions well below the "low" projection is certainly possible with available technology and a lot more public awareness and political will.

This figure from the 2011 UNEP Synthesis Report "HFCs: A Critical Link in Protecting the Climate and the Ozone Layer" provides a good overview of where we've come from and where the relevant literature indicates we are headed, absent a more informed policy debate and resultant policy and market responses.

-
tcflood at 14:29 PM on 4 June 2013Another Piece of the Global Warming Puzzle - More Efficient Ocean Heat Uptake
Let me quickly add that I just found the "Trenberth can't account for the lack of warming" thread. I don't mean to say that the energy balance and ocean heating are not important, (they are very much so). It's that my working theory is that his comment was probably born of the facts that he may not have been working with an accurate number for the TOA net radiation, and there may not have been good data on ocean heat content at that time.
-
KK Tung at 14:16 PM on 4 June 2013The anthropogenic global warming rate: Is it steady for the last 100 years? Part 2.
In reply to post 117 by Dumb Scientist: I have to admire your single-minded determination to "prove" that the result in Tung and Zhou (2013) somehow had a technical flaw. You had created a highly unrealistic case and tried to demonstrate that the Multiple Linear Regression (MLR) method that we used gives an underestimate of the true anthropogenic trend most of the time. Before we start I need to reiterate the basic premise of parameter estimation: if A is the true value and B is an estimate of A but with uncertainty, then B should not be considered to underestimate or overestimate A if A is within the 95% confidence interval (CI) of B. I previously discussed this problem in my post 120 addressing Dikran Marsupial's MLR analysis in his post 57.
Not taking CI of the estimate into account is not the only problem in your post 117. A more serious problem is your creation of an almost trivial example for the purpose of arguing your case. Your synthetic global temperature (denoted "global") is fine. It contains a smooth accelerated warming time series (denoted "human"), a smooth sinusoidal natural variation of 70 year period (denoted "nature"), plus a random noise, which contains year-to-year variations:
global=human+nature+rnorm(t,mean=0,sd=0.2)
Your synthetic North Atlantic temperature (denoted "n_atlantic") is exactly the same as "global" but for a small "regional" noise of standard deviation of 0.1, half of that of global mean:
n_atlantic=global+rnorm(t,mean=0,sd=0.1)
I said this is an almost trivial example because if this small "regional" noise were zero it would have been a trivial case (see later). Even with the small regional noise, your n_atlantic is highly correlated with your global data at higher than 0.8 correlation coefficient at all time scales. This is unrealistic because it is highly unlikely that a high frequency noise in North Atlantic also appears in the global mean. For example, a blocking event that makes Europe warmer in one year should not show up in the global mean. This defect is caused by the fact that each wiggle in the global noise also shows up in your n_atlantic by your construction. To make your synthetic data slightly more realistic while retaining most of their features that you wanted we could either increase the standard deviation of the regional noise from 0.1 to 0.3---this change is realistic because the regional variance is always larger than the global mean variance:
(1) n_atlantic=global+rnorm(t,mean=0,sd=0.3)
Or we could retain the same combined standard deviation as your two noise terms in n_atlantic, but from a different draw of the random variable than the random variable in global:
(2) n_atlantic=human+nature+rnorm(t,mean=0,sd=sqrt(0.2^2+0.1^2))
For both cases we repeated your MLR and found that the true anthropogenic warming of 0.17 C per decade is correctly estimated to lie within the 95% CI at least 93% of the time for case (1) and at least 94% of the time for case (2). This conclusion is obtained by 10,000 Monte Carlo simulations.
The reason I said above that your example is almost trivial is that except for the small regional noise, n_atlantic is the same as global. The AMO index that you defined is n_atlantic minus its linear trend. So global minus n_atlantic is deterministic (when that small regional noise is absent) and is equal to the linear trend. You do not need MLR to show that when your AMO is regressed away what is left is the linear trend 100% of the time.
You can also make your example less deterministic and hence less trivial, by smoothing your AMO index as we did in our paper. Even with everything else remaining the same as in your post 117, you would find that with this single change in your procedure the true value of the anthropogenic warming rate is found to lie within the 95% CI of the MLR estimate 2/3 of the time.
In our PNAS paper, we said that because of the importance of the results we needed to show consistency of the results obtained by different methods. The other method we used was wavelet. Applying the wavelet method to your example and to all the cases mentioned here we obtain the correct estimate of the true value for anthropogenic warming rate over 98% of the time. The wavelet method does not involve detrending and can handle both linear or nonlinear trends.
For the realistic case considered by us in our papers, the anthropogenic warming rate was found to be approximately 0.08+/-0.02 C per decade by the two methods, which gives us confidence that our result was not affected by a particular method. The smaller error bars (compared to your unrealistic example) bound the true value far below the value of 0.17 C per decade of Foster and Rahmstorf (2011).
-
GreenCooling at 13:46 PM on 4 June 2013It's CFCs
As much as it pains me to correct such an eminent and respected scientist, I must humbly submit that Prof David Karoly is mistaken in saying on the ABC radio "AM" story cited by Tom @9 that "The replacement chemicals for chlorofluorocarbons are hydrofluorocarbons, which are used as refrigerants, have already got as large a greenhouse influence as the reductions in the chlorofluorocarbons.
As established by Velders et. al. Science (2012) "Preserving Montreal Protocol Climate Benefits by Limiting HFCs" (and reinforced by the 2011 UNEP Synthesis Report "HFCs: A Critical Link in Protecting the Climate and the Ozone Layer" ) the climate benefit inadvertantly acheived by phasing out CFCs to protect the ozone layer has been significant, yet is likely to be lost in coming decades if we fail to take effective action to prevent rapidly rising emissions of HFCs. The HFCs horses have not yet all bolted, but it is time to shut the gate.

Velders et.al. (2012) put it like this: "Total avoided net annual ODS emissions are esti- mated to be equivalent to about 10 Gt CO2/ year in 2010, which is about five times the annual reduction target of the Kyoto Proto- col for 2008–2012 (5). This climate benefit of the Montreal Protocol may be reduced or lost completely in the future if emissions of ODS substitutes with high GWPs, such as long- lived HFCs, continue to increase."
Preserving the climate benefits of the Montreal Protocol by urgently phasing out HFCs with a mix of policy tools including strict regulation such as end use bans, carbon pricing levies and inclusion in the Montreal Protocol to drive concerted global action is the largest, quickest, cheapest and most effective tool in the emissions abatement policy shed. But as atmospheric HFC concentrations continue to rise, time is running out, and greater attention to the non-CO2 forcers is required now.
Natural refrigerants such as ammonia, carbon dioxide and hydrocarbons stand ready to provide the needed solutions to meet our cooling needs, and the chemical companies that caused the CFC, HCFC and HFC problems have a new range of patented and attractively branded low-GWP 'HFO's' they are pushing to see adopted by anyone who still thinks they deserve to continue to be rewarded for doing so.
Prof Karoly is completely correct in saying "in fact, the global warming influence of these chemicals, the hydrofluorocarbons, is already growing more rapidly than the reductions in chlorofluorocarbons" (although he could have added that hydrochlorofluorocarbons, HCFCs, are also CFC replacements and are still rapidly increasing, in spite of being subject to a Montreal Protocol driven phaseout), but there is still more we could do to increase the reductions of CFCs & HCFCs by recovering them from the pipework and foams of our dead fridges and airconditioners respectively.
Lamentably few scientists understand the climate threat posed by HFCs, and fewer still are prepared to speak out about the need to urgently avoid their use and to rapidly embrace the readily available environmentally benign rerigerant solutions.
If we are to avoid the projected greenhouse impacts of HFCs wiping out those acheived by the CFC phaseout, it would be very helpful if Prof Karoly and others of similar standing were able to assist in clarifying the imperative of acting now to rapidly reduce the use and emissions of Ozone Depleting Substances and Synthetic Greenhouse Gases.
While Lu is completely wrong about CFCs, the debate now required is a good opportunity to correct the widely held yet mistaken notion that the F-gas problem is fixed.
-
tcflood at 13:13 PM on 4 June 2013Another Piece of the Global Warming Puzzle - More Efficient Ocean Heat Uptake
To anyone who might have the time and interest to reply.
JoeT @4 says Stephens et al. (2012) has the TOA imbalance at 0.6 +/- 0.4. The way I read the paper it looks like 0.5 +/- 3.1 Wm^-2. Can anyone explain if either of us is correct?
Where the uncertainty bars on the TOA net radiation bars come from for a model result.
On other sites I have seen the contention that the Trenberth “missing heat” was not a meaningful issue because of the large uncertainty in the TOA net radiation. I would be very interest in you take on this.
-
scaddenp at 09:54 AM on 4 June 2013Imbers et al. Test Human-Caused Global Warming Detection
Paul D - for modelling the difference, see Hansen 2005 "Efficacy of climate forcings"
-
jmorpuss at 09:30 AM on 4 June 2013Imbers et al. Test Human-Caused Global Warming Detection
If Atlant http://www.australianrain.com.au/assets/files/PDF/StatisticalModellingRainfall.pdf uses the electron released by the antenna to seed clouds, how much seeding dose high voltage power lines create ?
-
michael sweet at 09:28 AM on 4 June 2013Imbers et al. Test Human-Caused Global Warming Detection
Stealth,
The human contribution is not only GHG. Aerosols are also included as a human forcing. Keep in mind that aerosols are a negative forcing. That means that the GHG effect is more than 100% of the measured warming. The rest of the forcings add up to peanuts in the long term (probably negative). When coal is scaled back the aerosols will quickly be removed from the equation. That means more warming at first when less coal is used.
It sounds to me like you have just started looking at AGW. Read a lot more before you reach conclusions. There are a lot of open threads here at SkS.
-
Rob Honeycutt at 08:53 AM on 4 June 2013Imbers et al. Test Human-Caused Global Warming Detection
Stealth... If you're interested in the topic, you should definitely check out this lecture from Dr Richard Alley. It's a nice overview of climate science. And Alley's a pretty entertaining speaker.
http://www.agu.org/meetings/fm09/lectures/lecture_videos/A23A.shtml
-
Paul D at 08:44 AM on 4 June 2013Imbers et al. Test Human-Caused Global Warming Detection
Out of interest has there been any modelling in which CO2 levels are stable and solar input isn't?
I would think that the resulting changes would be different to that of CO2 changing, eg different types of weather patterns, different impacts on warming in different regions etc.
-
KK Tung at 08:33 AM on 4 June 2013The anthropogenic global warming rate: Is it steady for the last 100 years?
MY reply to Dikran's post 57 can be found here.
http://www.skepticalscience.com/news.php?p=3&t=123&&n=1975
-
scaddenp at 08:03 AM on 4 June 2013Imbers et al. Test Human-Caused Global Warming Detection
I dont think any model assumes "Sun and Other are that stable". Solar input has been measured since 70s and inferred from proxies before that etc. If you look at the IPCC WG1 report, you can see what the models use for the various forcings and how these have changed over time. The references will take you to the papers that tell you how these are estimated. You might want to look at Benestad and Schmidt 2009 for a statistical look at the climate and solar forcings.
-
Kevin C at 07:51 AM on 4 June 2013Imbers et al. Test Human-Caused Global Warming Detection
Well, if you are proposing a strong solar impact on temperature, then you have the problem that solar output has declined over the past 30 years when the climate has been warming most rapidly. If you want to argue for a stronger solar term, you are also arguing for a stronger anthopogenic contribution.
-
StealthAircraftSoftwareModeler at 07:15 AM on 4 June 2013Imbers et al. Test Human-Caused Global Warming Detection
Okay, I think I now see the baseline issue. I think a better way to say it is that the zero line on the top temperature anomaly is around 1985. In order to get to the temperature for any given date (future or backward) then add up all the component effects of ENSO, VOL, SUN, ANT, and Other. It does appear that if you add these up then you can compute the temperature for the second date. For example, to get the temperature for 1950 from 1985, we take the temperature anomaly of 0 deg C and add -0.1 deg C for ENSO component at 1950, then 0 for VOL, then about 0 for SUN, then about -0.3 or -0.4 for ANT, and about 0 for Other. Then we arrive at about -0.4 or -0.5 for 1950, which matches the top temperature graph. Is this correct? If so, thanks for taking the time to explain it.
I’ve done a bit of research into AGW just for fun. I’m not a “denier” per se since I’m sure CO2 does absorbs some IR wavelengths; I model some of this in aircraft detection and sensor computation for my job. My main question is “how much has CO2 contributed to global warming?” This set of charts seems to indicate that GHG is all of it over the last 100 years since all the charts (except ANT) wiggle about their respective zero line. I have a hard time believing that that Sun and Other are that stable. If you assume they are stable, then the conclusion has to be that GHG is the problem. I am curious as to how scientists have split out and determined that the Sun and Other are that stable.
-
Rob Honeycutt at 06:59 AM on 4 June 2013Imbers et al. Test Human-Caused Global Warming Detection
Sealth said... "That, in my book, isn’t trivial or negligible, so I do not see how you can make that claim."
Yes, it's not trivial if you are a tiny and highly sensitive piece of electronics several miles above the surface of the earth, or if you're a biological creature floating around in space susceptible to gene damage.
What is being discussed here is the radiative forcing on the climate system. Irradiance from the sun in coming in a ~1340W/m^2, and that varies ~0.25W/m^2 over the course of the 11 year solar cycle. Thus, the radiative change in forcing from solar activity is tiny compared to the net change of 2.8W/m^2 in anthropogenic factors.
-
John Hartz at 06:59 AM on 4 June 2013The 5 characteristics of global warming consensus denial
jdixon1980 #77:
A word of caution -- Trying to think like a die-hard climate denier may be dangerous to one's mental health.
-
Tom Curtis at 05:45 AM on 4 June 2013Imbers et al. Test Human-Caused Global Warming Detection
Stealth @5:
1) Volcanic contribution is not always zero. If you run a line across at the zero level you see that it is mostly positive, only becoming noticably negative near major volcanic erruptions (approx 1905, 1965, 1985, and 1992). The later two mean that the average is near zero over the baseline period as determined by eye.
2) The CME striking Earth in March 2012 was exceptional, but only released 26 billion kWh (93.6 x 10^15 Joules) of energy to Earth's upper atmosphere over three days. That represents an average 0.0007 W/M^2 energy over the three days. Only 5% of that energy actually reached the Earth's surface, the rest being radiated to space. Therefore the CME increased the Earth's energy imbalance for three days by only 10,000th of the minimum current Top Of Atmoshere energy imbalance. I would consider that inconsequential.
-
MA Rodger at 05:39 AM on 4 June 2013Imbers et al. Test Human-Caused Global Warming Detection
StealthAircraftSoftwareModeler @5.
Concerning the position of the zero on the vertical axes of figure 1 of the post. You say "That makes no sense based on the other charts" but the position of the zero is actually what makes those six panels sensible.
The top panel has its zero point set by the global temperature anomaly based on 1980-2000. As the caption explains - "The remaining panels show the individual temperature contributions to the top panel..." As the top panel of global temperature is well below zero at the start of the series (c -0.65ºC), the sum of all the contributions in the other panels must also total to that same value (of c -0.65ºC).
Because the anomaly base is 1980-2000, a period in which ther was quite a lot of cooling due to volcanic activity, you will find that the panel VOL plots a positive contribution to temperatures for the vast majority of the series. This means that for most of the period 1880-2010, volcanic activity resulted in a higher temperature in comparison with the base period 1980-2000.
Likewise the human impact ANT. Because human positive forcings were less before 1980-2000, the impact of those human forcings will be lower temperatures before that period. To describe it as "cooling" as you do requires the analysis to run backwards in time. Forwards in time, the usual way, 'cold' becomes 'hot' which is usually considered to be 'warming.'
And as plotted, the period 1945-65 is consistent with a rising human contribution.
-
dana1981 at 05:10 AM on 4 June 2013Imbers et al. Test Human-Caused Global Warming Detection
Stealth @5 - see here. In some cases it's perhaps more accurate to say there's no evidence or research supporting a link between your proposed solar variable and global temps.
Whether or not you buy it, Kevin and I are correct on the baselining issue. Just look at the top panel of Figure 1. The panels below add up to the model simulations shown in the top panel. The top panel has a negative temp anomaly before ~1970. All of the lower panels are plotted in terms of temp anomalies as well. It's just a baselining choice issue.
-
KR at 05:04 AM on 4 June 2013Imbers et al. Test Human-Caused Global Warming Detection
Stealth - Regarding zero point: If you are examining correlation/causation, the only thing that matters is the change, the anomaly. Baseline value makes no difference whatsoever for such studies.
Regarding solar winds and coronal mass ejections (CME): solar winds vary time-correlated with total insolation (TSI), any effect from solar wind appears (is folded in) as a larger contribution from the 11-year solar cycle, a larger solar attribution.
The energy in a CME is roughly that of 1/6 second of total solar output, and few of them actually strike the earth - not much of a contribution. And the frequency of solar flares is also tied to the 11-year solar cycle - that would again just fold into causation studies as a larger solar attribution.
-
Dumb Scientist at 04:10 AM on 4 June 2013The 5 characteristics of global warming consensus denial
(Moderators: This is the second time one of my comments showed up blank. I think it's happening when I type into the source box and don't click "basic" to preview before hitting submit.)
jdixon1980 @77: Stephen Schneider and Marshall Shepherd both pointed out that scientists who are only motivated by funding would deny that the science is solid. That would keep the gravy train coming: "the science is so uncertain; we need more funding."
Also, the recent consensus project shows that most papers in Web of Science containing the phrase "global climate change" don't bother to address human causation, just like most astronomy papers don't bother to address the fact that the Earth orbits the Sun.
If scientists were as motivated by funding as the conspiracy theorists suggest, more papers would take positions on human causation in order to get more of the funding gravy train.
-
StealthAircraftSoftwareModeler at 03:58 AM on 4 June 2013Imbers et al. Test Human-Caused Global Warming Detection
Can you respond with some links that point me to some of this scientific literature that asserts that solar wind, CME, etc have a negligible effect on climate? I am having a hard time believing this claim and I would love to see how someone proved this. I like to follow CME and solar weather for auroras, and the last X class CME that hit the earth dump more energy into the upper atmosphere in 24 hours than has been released by all of mankind over all of history. CMEs set up huge electrical currents in the ground and wires and can knock out the power grid, fry satellites, and force astronauts into protective and shielded quarters on the ISS. That, in my book, isn’t trivial or negligible, so I do not see how you can make that claim.
I’ve done a quick Google search and haven’t found any such documentation supporting your claim. Wikipedia states, “The IPCC acknowledges that there is a low level of scientific understanding with respect to solar variation.” (http://en.wikipedia.org/wiki/Solar_variation under the “Effect on global warming.”) I doubt the IPCC would say this if there was clear science to the contrary, so I really look forward to your references.
As for the zero point, still just don’t buy that the zero point is a re baseline for comparison as you can Kevin state. That makes no sense based on the other charts. All other factors (ENSO, etc) are relative to zero showing how they added or subtracted from the global temperature. Note how VOL is always negative, which makes sense. A volcano burps out a bunch of aerosols which reflects some sun light and cools the earth some amount. The ENSO can warm or cool the planet and they show that in their chart.
If you look at the five charts, you can see a global cooling trend from 1945 to about 1965. ENSO is near zero over this time span, VOL is also zero, and the SUN and Other are always near zero. In order to have cooling from 1945 to 1965, then ANT has to be negative as the authors have clearly shown on their chart, otherwise things just do not add up. If ANT is related to GHG, and GHG always warm the planet, then the ANT chart should never be negative. Hence the reason this paper seems incorrect to me.
Prev 885 886 887 888 889 890 891 892 893 894 895 896 897 898 899 900 Next


