


 Arguments


Recent Comments
Prev 908 909 910 911 912 913 914 915 916 917 918 919 920 921 922 923 Next
Comments 45751 to 45800:
-
Global Warming: Not Reversible, But Stoppable
John Hartz - Thank you for the very relevant reference. They discuss in particular one of the lowest cost CO2 removal schemes, biological drawdown:
Although there is large uncertainty about sustainable levels of bioenergy use (...), it can be expected that sustainability constraints will limit the use of BECCS [Bio-energy with carbon capture and storage] as CDR [Carbon dioxide removal] technology. In our analysis, BECCS deployment is effectively limited to a removal of 14–15 GtCO2 per year.
That works out to ~2 ppm/year, or roughly the rate of current emissions. Given the 550 ppm Mark Bahner discusses, that means 225 years of BECSS drawdown assuming no further emissions - with that drawdown competing with food production, and with its own energy/resource costs (including fresh water and soil nutrients that will be consumed in the process).
It might be a helpful addition to mitigation, but again - CO2 removal is no panacea. And even that (relatively) low cost sequestration is still more expensive than mitigation.
-
Tom Curtis at 11:18 AM on 30 April 2013Nils-Axel Mörner is Wrong About Sea Level Rise
An update to my post @48:
1) I have tracked down the source of Morner's claim that the ABSLMP shows a 5.4 mm per year sea level rise. If you take the average of the raw trends of all 16 AMSLMP stations from their time of construction to June 2011, it is 5.37 mm/year. These are the trends before any adjustment for local changes in height of the equipment relative to surveyor's datum points, and before reverse barometric adjustments.
The Australian Bureau of Meteorology reported these figures in their 2011 report, but then reported the size of the adjustments and the final adjusted figures. It is hypocritical of Morner to ignore those adjusted figures and then to criticize the BOM for not accounting for subsidence and/or the effects of ENSO (ie, barometric effects).
2) I have managed to track down the source of the data, and which data he selected in making his comparisons. Specifically, in addition to the 16 SEAFRAME (ABSLMP) sites, he uses the metric sea level data from the Permanant Service for Mean Sea Level (PSMSL). He only uses sites which continue significantly past 1990, or where two very close sites can be used to provide a significant record extending past 1990. I was able to determine this by looking at his Figure 1, and noting the four sites he shows in the immediate vicinity of Port Philip Bay (Melbourne). There are not four Revised Local Reference (RLR) records in that vicinity, ergo he must have used the metric data.
The key about using metric data is that it has not been adjusted to account for any local vertical movements of the tide guage. In contrast, RLR records are adjusted to a standard height datum and so adjust for any purely local subsidences or uplifting of the tide guage. (They do not account for changes resulting from subsidence or uplift of contintental plates, as near as I can determine.) Because metric data does not account for local land movements, it is considered highly suspect. The PSMSL state:
"Without the provision of full benchmark datum history information, records generally remain as 'Metric only' in the databank and not as 'RLR'. In general, 'Metric' records should NEVER be used for time series analysis or for the computation of secular trends. Without datum continuity their only use is in studies of the seasonal cycle of mean sea level. If there is any doubt about the datums for a particular record, the PSMSL would be pleased to supply clarification."
Of course, Morner has used those metric records so do exactly what the PSMSL has said you should never do, ie, compute a secular trend. He has gone on to criticize the RLR (ie, height datum adjusted) data from the SEAFRAMES because it disagrees with the the data for which he has no record of local relative height movements. This is the sort of gall I would expect from the man who published a photoshopped picture as "evidence" in a purportedlyh scientific paper.
3) Morner's figure 3 is a mishmash of different sorts of data. His 5.4 mm trend that he claims is reported by ABSLMP2011 is the metric version, as are his various Australian (2a, b and c) and World (3 a and b) tide guage records and are not comparable because of the effects of local land movements. In contrast, Church and White and the Topex/Jason satellite record are independant of local land movements, and have a reverse barometric adjustment and hence are comparable to the 4.3 mm year mean trend of the SEAFRAME tide guages. The suggested discrepancy between the SEAFRAME data and the satellite data is, however spurious on another ground. Specifically, the satellite data is not taken over the same period or the area.
Fortunately the ABSLMP2011 report shows the Topex/Jason trend from Dec 1992 to March 2011 (Fig 17). I have adapted that image by showing the approximately location of the ABSLMP sites, and their trend from construction to June 2011. The later was shown by colour picking from the location indicated by their trend on the index bar, and flooding their square with that colour so direct colour comparison gives a good idea of the relative trends:
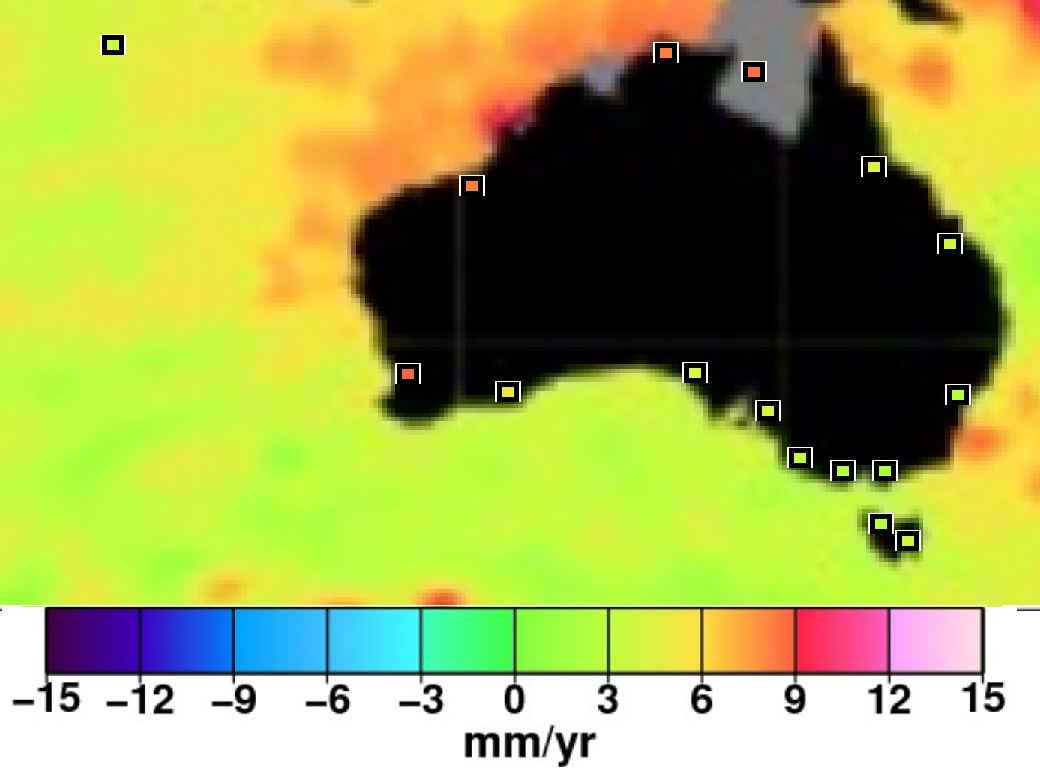
As can be seen, the only significant disagreement is at Hillarys near Perth (SW Western Australia). As it happens, the highest, second, highest, and fourth highest months on record occured between March and June 2011, the addition of which of which wold largely account for the discrepancy between satellite and tide guage records. Curiously, Morner commented extensively on the nearby Fremantle tide gauge record, but truncated his analysis prior to that notable surge in local sea levels (also visible in the Fremantle data). The difference at Hillarys between sea level trends to June 2010 and June 2011 is 1.6 mm/year. Adjusting the Hillarys trend down by that amount probably better reflects the time parity with the satellite record shown, and adjusts the trend to 7.4 mm/year (yellowy orange). There remains a small discrepancy, as also at Port Kembla in the reverse direction. Overall the satelite record tends to confirm the accuracy of the SEAFRAME data, and clearly refutes cliaimed overall Australian trends of 0.1 to 1.5 mm per year as made by Morner.
4) I previously mentioned the geographical bias of Morner's additional stations. They come almost exclusively from the east and south east coasts with their low sea level rises. The extent of the bias is shown in the figure below:

The area highlighted represents over 50% of the Australian coastline. As shown, the ABSLMP has 7 of 16 SEAFRAMES in that area, representing a slight East Coast bias. That bias is not consequential because the ABSLMP do not report a national average (for a reason). Morner, how does report a national average, increases the bias with his 36 station long records, and still further with his full 86 station count. In all, the most rapidly rising sea levels around the Australian Coast are represented by just 26% of Morners tidal guages. Despite this he purports that a simple mean of the stations will show the sea level rise around Australian coasts.
5) Much of Morner's criticism of the ABSLMP is based on the idea that twenty years is far to short a time to determine long term trends. (Despite that, he purports to find a significant five year trend in the Fremantle data, showing he is nothing if not inconsistent.) However, as a criticism of the ABSLMP, this is distinctly a straw man. They have this to say on the subject (in ABSLMP 2011):
"It is important to emphasise that as the ABSLMP sea level records increase in length, the sea level trend estimates will continue to stabilise and become more indicative of longerterm changes. Caution must be exercised in interpreting the ‘short-term’ relative sea level trends (Table 2) as they are based on short records in climate terms and are still undergoing large year-to-year changes."
(My emphasis)
In essence, Morner has taken the AMSLMP's own caution and expanded it, incompetently, into a "scientific" paper, taking care all the time to not mention the ABSLMP's original caveate.
It is no wonder he made sure to publish the paper in as obscure a journal as he could.
-
Tom Curtis at 09:37 AM on 30 April 2013Global Warming: Not Reversible, But Stoppable
Responding to Mark Bahmer's various posts:
Assuming a continuation of the average economic growth durring the post war boom years of 3% per annum, the global economy will have grown to thirteen times its current value. In contrast, the IPCC estimate of 25 times the 2007 value requires as sustained growth rate of 3.5%. Growth of a hundred fold requires an economic growth rate of 5.4% per annum, a figure not achieved for global growth since 1973 and extraordinarilly unlikely to be achieved as a global average over a century, even absent any negative effects from global warming:

Consequently the IPCC estimate is at least plausible, if a bit opitimistic. Yours are definitely over optimistic.
What is more, the standard assumption that you can increase CO2 in the atmosphere by 300 ppmv with no harmfull effects on economic growth is just bizzare. A certain consequense of such an increase is the loss of Arctic summer sea ice. An almost certain effect of such an increase will be the destruction of the great barrier reef. Another probable consequence will be the conversion of Amazon rainforest into a system of open forest and savannah. These large scale ecological catastrophes must inevitably have adverse effects on the human economy, and those effects will show up as reduced growth. In the latter half of this century, the economic issue is not whether we will be achieving 3% of 5.4% growth of the global economy, but whether we can avoid 3% to 5.4% contractions of the global economy, year in and year out.
Regardless of whether or not you consider the risk of a contracting global economy in the later 21st century with ongoing global warming to be real (and only the very foolish or thoughtless will dismiss that possibility out of hand), the fact remains that extra CO2 in the atmosphere has a cost. Consequently, if the cost of not emiting the CO2 equals the cost of removing it later; it is better to not emit it because it avoids that cost.
In addition to not taking into account the costs of increased CO2 concentrations (both to economic growth and as a raw cost), you fail to take into account the fact that various schemes to draw down CO2 from the atmosphere have an ecological impact as well. Simply framing it in terms of dollar values ignores half of the costs.
-
Mark Bahner at 08:38 AM on 30 April 2013Global Warming: Not Reversible, But Stoppable
KR #53: In my previous comment I mistyped - it should state "the world economy increases by a factor of 100x", not 1000x, to match Mark Bahner's post.
By comparison, the most agressive SRES emissions scenario (A1T) used in IPCC predictions of GHG levels indicates a maximum world GDP growth of only ~25x by 2100,...
OK, let's use the IPCC's numbers. Their economic growth numbers are very likely to be proven extremely wrong on the low side:
Third thoughts on economic growth in the 21st century
...but let's assume the economy grows by only a factor of 25 in the next 100 years. That means in the year 2113, it will be possible to remove 25 ppm of CO2 per year for an expenditure of 10 percent of the world GDP. (Since we now can remove 1 ppm for an expenditure of 10 percent of the world GDP...assuming $1000 per ton of CO2, which is probably too high, especially for 100 years from now.)
The concentration under the A1T scenario is projected to be about 900 ppm in 2113. Let's say they want to get down to 350 ppm. That would be a reduction of 550 ppm. At 25 ppm per year, they could get there in 22 years.
So once again, the Matthews and Solomon paper is based on a completely indefensible premise. They claim that global warming is "irreversible" over multi-century time frames (in fact 1000 years). This neglects the economic growth that's likely to happen even in the next 100 years (let alone the next 200+ years).
-
John Hartz at 08:18 AM on 30 April 2013Global Warming: Not Reversible, But Stoppable
@KR #52 & #53:
Suggest that you check out: Kriegler, E., Edenhofer, O., Reuster, L., Luderer, G., Klein, D. (2013): Is atmospheric carbon dioxide removal a game changer for climate change mitigation?Climatic Change (online) [10.1007/s10584-012-0681-4]
I believe it bears directly on your ongoing dialogue with Mark Bahner.
-
Global Warming: Not Reversible, But Stoppable
In my previous comment I mistyped - it should state "the world economy increases by a factor of 100x", not 1000x, to match Mark Bahner's post.
By comparison, the most agressive SRES emissions scenario (A1T) used in IPCC predictions of GHG levels indicates a maximum world GDP growth of only ~25x by 2100, with the lower emissions scenarios ranging from 11-16x. Those are based on quite reasonable assumptions and prior experience with the GDP growth of developing countries - I don't believe that 100x GDP growth by 2100 is even in the realm of possibilities. If it was possible, it would almost inevitably be accompanied by even more emissions, making a carbon capture approach more challenging.
Again, it seems to me that carbon capture is not a panacea, and that BAU is by far the more expensive path. Mitigation, emitting less to start with, is far less expensive than adaptation.
-
Global Warming: Not Reversible, But Stoppable
Mark Bahner - An interesting speculation. However, beyond hoping (1) the world economy increases by a factor of 1000x, and that (2) less than $1000/ton CO2 removal is achievable, this approach has more than a few issues.
First - the non-trivial cost of such removal invalidates Sarawitz and Pielke's major premise, that:
Unlike abandoning fossil energy, capturing carbon does not demand a radical alteration of national economies, global trade, or personal lifestyles.
10% of world GDP is a major hit. WWII in the US, which you use as an exemplar, required energy rationing, intrusive government control of all sectors of the economy, material substitution due to war needs, and so on. I would consider those radical alterations.
Second, the idea of forever continuing the use of fossil fuels hits the limits of just how many reserves are present, and how much exploiting marginal sources will cost. Not to mention making carbon removal a permanent and repeating cost to the economy, whereas moving to a non-fossil fuel basis removes both the carbon problem and the need for the removal at the same time.
Finally - carbon removal takes energy. Using a fossil fuel source is a net loss - entropy is a bear, and a fossil fuel based carbon removal to, as S&P suggest, produce new fuels, will inevitably produce a net increase in CO2. Non-fossil fuel power sources are required for a net gain, for a drawdown in CO2.
---
Face it - Just about every study made shows that mitigation, moving from a fossil fuel economy to one that isn't, will be far less expensive and altering of our lifestyles than adaptation, such as dumping CO2 we don't need to and then trying to remove it later.
Given the disparity in costs between mitigation and adaptation, these cries of economic hardship over mitigation are beyond silly. Business As Usual (BAU) with continued use of fossil fuels is the more expensive path, the one that will engender more hardship, more radical alteration of lifestyles. I find it just incredibly sad that those complaining most about the idea of mitigation are loudly beating the drums for a path that will actually cost us far more, and be more of a burden on rich and poor alike...
-
Rob Honeycutt at 03:35 AM on 30 April 2013Global Warming: Not Reversible, But Stoppable
Honestly, if they could actually develop and scale the technologies to remove CO2 from the open air (huge if in that), then fine. More power to them. But the cost of removing the CO2 absolutely must be borne by the emitters themselves. It should not be borne by the public at large.
Now, tell me if you think the fossil fuel industry would agree to such terms.
-
dana1981 at 03:28 AM on 30 April 2013Announcement: New Guardian Blog by Dana Nuccitelli and John Abraham
Perma-irony?
-
Rob Honeycutt at 03:26 AM on 30 April 2013Global Warming: Not Reversible, But Stoppable
Mark... I find it fascinating how the article you link states that "...a shift to carbon-free energy remains the Platonic ideal" whereas there are, very clearly, existing and fully developed technologies to do this. The rate of growth in solar and wind are much greater than that of other FF energy sources. And, there are currently no – exactly zero – CCS power plants currently operating (AFAIK).
It seems to me the "Platonic ideal" is completely opposite to what the article reports, which is not unusual, given that it comes from Roger Pielke Jr.
-
Mark Bahner at 03:04 AM on 30 April 2013Global Warming: Not Reversible, But Stoppable
Rob Honeycutt:
"Mark Bahner... Aren't you ignoring the fact that the relative cost of removing the CO2 would also rise with the growth of the world economy?"
No, I'm ignoring the fact that the cost of removing a metric ton of CO2 would likely fall with the growth of the world economy. That is, what might cost $1000 per metric ton to remove in 2013, will likely fall to a small fraction of that, as humans learn how to do it more efficiently.
Oops. Lunchtime is over. :-( I'll try to address your other comments later tonight or tomorrow.
-
Rob Honeycutt at 02:53 AM on 30 April 2013Global Warming: Not Reversible, But Stoppable
Mark Bahner... Aren't you ignoring the fact that the relative cost of removing the CO2 would also rise with the growth of the world economy? And at the same time, you have CO2 emissions continuing to rise, so can you actually remove CO2 as fast as you're adding it? And why not just skip that entire process and just not put it into the atmosphere in the first place?
If the cost of removing it is $1000 per ton, why not just tack on, say, 10% of that same cost ($100/ton) as a tax on carbon emissions, as a tax and dividend plan, then the economic impact would be negligable at worst, and potentially would fuel very rapid, and economically beneficial, technological development.
And hey, let's not wait. If the issue is that we're going to have to pull those CO2 concentrations down, add that $100/ton tax today. That would clearly be the most economically advantageous course of action, bar none.
-
Mark Bahner at 02:31 AM on 30 April 2013Global Warming: Not Reversible, But Stoppable
I don't want to have to guess what you mean, could you be more specific? I am not sure what premise Matthews and Solomon could have made that would be demolished by asking, or even answering, such a question about the economics of the far future.
It's basically pretty simple. Matthews and Solomon are completely wrong in claiming that global warming is "irreversible". If adding CO2 to the atmosphere warms the planet, then taking CO2 from the atmosphere will cool the planet.
Human beings know how to remove ambient CO2 from the atmosphere. It's simply a question of what the cost is, and whether human beings are willing to pay that cost. Whether human beings are willing to pay the cost of removing CO2 from the atmosphere in turn depends on how much money humans have.
In a recent edition of The Atlantic, Daniel Sarewitz and Roger Pielke Jr note, "While the cost of air capture is largely speculative—current estimates range from $20 to $2,000 per ton of carbon dioxide removed—..."
Let's take a number in the middle of that range...about $1000 per metric ton of CO2 removed from ambient air. Since there are about 7.8 billion metric tons of CO2 per ppm in the atmosphere, that means it would take $7.8 trillion to remove 1 ppm of CO2 from the atmosphere.
That may seem significant now (about 10 percent of world GDP for 1 ppm removed). But by 2100 or 2200, the world GDP could easily be 10, 100, or even 1000 time larger than it is today.
If the world GDP is 100 times larger than today, it follows that 10 percent of the world GDP could remove 100 ppm of CO2 from the atmosphere per year. The U.S. spent about 10 percent of its GDP on the military during the Cold War period of the 1950s to 1980s, so obviously 10 percent of GDP isn't crippling. If the world GDP is 100 times larger, then spending 10 percent of GDP for 10 years would remove 1000 ppm of CO2 from the atmosphere.
Therefore, global warming is only "irreversible" if world economic growth stops in the near future. Economic science indicates that is unlikely. So it's not surprising that Matthews and Solomon ignored likely future economic growth.
-
CBDunkerson at 00:22 AM on 30 April 2013Announcement: New Guardian Blog by Dana Nuccitelli and John Abraham
dana @17 - Is it really still irony when it happens every time? :]
-
Tom Dayton at 22:23 PM on 29 April 2013The History of Climate Science
GlacialErratic, I agree you should look at the Start Here page, to learn how to quickly and easily find information here on Skeptical Science.
The short answer is that the Earth's orbital changes (Milankovich cycles) cause really, really slow variations in the amount of the Sun's radiation that hits the northern hemisphere. During the parts of the cycles that increase that radiation on the northern hemisphere, the snow and ice melt a bit more, which reduces the amount of radiation being reflected to space, which increases the radiation being absorbed by the ground and water, warming them and in turn warming the atmosphere, which increases the warming of the oceans. The warming oceans hold less CO2, so the CO2 in the atmosphere increases, which leads to even more warming, which melts the ice and snow more, and so on. Details are on a post about Shakun et al.
There is a good series here, about the last interglacial.
-
michael sweet at 20:15 PM on 29 April 2013The History of Climate Science
Glacial erratic,
It is common knowledge that the ice ages in the past were caused by variations in the Earth's orbit around the sun. This is called the Milankovitch cycle. I am surprised that you recognize what a glacial erratic is and do not know about ice ages. If you google "ice age causes" you will find lots of information you can use. Perhaps you will want to read the "start here" button so that you are not asking basic questions that everyone else already knows.
-
GlacialErratic at 16:50 PM on 29 April 2013The History of Climate Science
Last year, while planting a tree, I found a glacial erratic in my back yard. When I called the university they told me the last glaciers receded about 17,000 years ago. I would just like to know what caused that warming.
Any help would be appreciated.
-
Composer99 at 11:12 AM on 29 April 2013The History of Climate Science
Re: hyperlink to Spencer Weart's book:
-
AndrewMF at 07:37 AM on 29 April 2013Nils-Axel Mörner is Wrong About Sea Level Rise
Thanks Tom!
-
rockytom at 06:13 AM on 29 April 2013The History of Climate Science
I can vouch for the American Institute of Physics (AIP) website for Spencer Weart's essays, especially on the historical aspects of climate science. If I knew how to link it I would. One can "Google" or "Yahoo" it.
-
Tom Dayton at 23:38 PM on 28 April 2013CO2 was higher in the past
There is an excellent article in Science News about new research to figure out exactly what mix of factors was responsible for the greenhouse gas mix being sufficient to overcome the really faint Sun 2.5 to 3.8 billion years ago (the Archean period). It even involves fossil evidence of raindrops, to infer raindrop shape and speed!
-
Tom Curtis at 10:45 AM on 28 April 2013Nils-Axel Mörner is Wrong About Sea Level Rise
I forgot to link to the Australian Climate Commission Report cited by Morner.
-
Carl Sargon at 10:35 AM on 28 April 2013Guemas et al. Attribute Slowed Surface Warming to the Oceans
Rob, thanks for the quick help - I didn't check back until now.
It important to realize that the warming of the deep ocean will not affect global surface temperatures for hundreds of years. It's the heat that accumulates in the upper ocean that is exchanged with the atmosphere during ENSO events.
Yes, I've heard that the deepest ocean currents take hundreds or thousands of years to make a complete circuit - I was more curious about how much heat might get stashed away in the ocean depths - delaying surface warming - rather than the heat popping back up at the end of a long, slow circuit along the ocean bed.
Do you think they model the deepest ocean precisely enough to say? I've heard, for instance, that "regional" Arctic ocean models are much higher resolution than full planet ocean models (Dr. Maslow - that's one reason he expects Arctic summer sea ice to disappear much sooner than "full planet" GCM modelers).
I suppose if we get a big El Niño again soon, like in 1998 or 1983, and heat comes pouring back into the atmosphere contributing to a big surface warming jump of almost 0.2ºC, then I'll lose some interest in how much heat can be squirreled away in the deepest ocean. Until then, I'm going to try to read up on this topic.
 Moderator Response:
[RH] Fixed image width.
-
Tom Curtis at 10:22 AM on 28 April 2013Nils-Axel Mörner is Wrong About Sea Level Rise
AndrewMF @47, the reported sea level rises by the Australian Baseline Sea Level Monitoring Project (ABSLMP) are measured by SEAFRAMEs (SEA-level Fine Resolution Acoustic Monitoring Systems), as illustrated below:

Two important features are the GPS system (CGPS) and satellite telemetry antenna used to check for subsidence or uplift of the pier on which the seaframe monitor is built. Also important is the barometric pressure sensor. Australian SEAFRAMEs include an additional downward facing radar to monitor the distance between the pier and the wave surface.
The reported sea level rises from the ABSLMP included adjustments for subsidence and uplift and (importantly) reverse barometric pressure. The later is important because Morner claims the ABSLMP reports ignore the effect of the transition from the 1998 El Nino to generally La Nina conditions over the last few years, a transition which would raise the directly measured sea level. However, that effect is a consequence of reduced barometric pressure in Australia in La Nina conditions, and so is directly accounted for with the inverse barometric pressure adjustment (and explicitly discussed in ABSLMP reports).
In prefference to measurements from this system, Morner suggests we take the average trend over different time periods of several stations (inaccurately reported as an average trend since 1900); or the average over different time periods from a non-geographically representative set of tide stations. He also insists we take the average since 1900.
The ABSLMP has been in operation since 1991. If Morner was going to use the other tide station data to check its accuracy, he would report the trends since 1991 where available. By not doing so, he makes an apples an oranges comparison. It is quite possible that the average sea level rise since 1900 show a trend of 1.5 mm/year (as reported by Morner) but that the ABSLMP correctly report a recent rise of approx 4.88 mm/year to June 2011 (taking the average from the start data of different tide gauges which range from May 1990-Sept 1993, hence not quite accurate)
Finally, Morner attributes a claimed rate of sea level rise for Australia to the Australian Climate Change Commission. I am unable to find a source of that claim. The report cited by Morner claims a 3.2 mm per year global rise based on satellite data, and the average of the Australian stations shown (in figure 8) is just 4.3 mm per year (to 2008, with the same caveat about start dates). Absent evidence to the contrary, it appears Morner has set up a strawman.
-
AndrewMF at 08:20 AM on 28 April 2013Nils-Axel Mörner is Wrong About Sea Level Rise
He's back: http://www.eike-klima-energie.eu/fileadmin/user_upload/jaeger/Moerner_Parker_ESAIJ2013.pdf
Present-to-future sea level changes: The Australian case
Abstract:
We revisit available tide gauge data along the coasts of Australia, and we are able to demonstrate that the rate may vary between 0.1 and 1.5 mm/ year, and that there is an absence of acceleration over the last decades. With a database of 16 stations covering only the last 17 years, the National Tidal Centre claims that sea level is rising at a rate of 5.4 mm/year. We here analyse partly longer-term records from the same 16 sites as those used by the Australian Baseline Sea Level Monitoring Project (ABSLMP) and partly 70 other sites; i.e. a database of 86 stations covering a much longer time period. This database gives a mean trend in the order of 1.5 mm/year. Therefore, we challenge both the rate of sea level rise presented by the National Tidal Centre in Australia and the general claim of acceleration over the last decades. 2013 Trade Science Inc. - INDIA
Published in "Environmental Science, An Indian Journal" ISSN : 0974 - 7451 Volume 8 Issue 2
-
Chris Colose at 07:59 AM on 28 April 20132013 SkS Weekly News Roundup #17A
Here's a full interview with Hansen that may be of interest
http://www.cbc.ca/news/politics/story/2013/04/26/pol-hansen-oliver.html -
MA Rodger at 06:45 AM on 28 April 2013Guemas et al. Attribute Slowed Surface Warming to the Oceans
grindupBaker @15.
If you are wanting to warm the oceans by 2.8ºC you would require a lot of energy, about 15,000 ZJ I calculate. With the TOA yielding 7 ZJ or so per annum and presumably declining as the centuries go by, it's gonna take a dickens of a time to reach that equilibrium temperature if the oceans do increase in temperature by the same temperature as the surface.
Perhaps a little question may assist in illustrating that your model of ocean warming is probably a little awry.
If average surface temperatures above the oceans are close to 14ºC and the earth’s core below the oceans has a temperature in excess of 5,000ºC, how is it that the deep oceans manages to remain so cold?
-
william5331 at 06:40 AM on 28 April 20132013 SkS News Bulletin #9: Alberta Tar Sands and Keystone XL Pipeline
I don't get what the Canadians are thinking of. If they are determined to go down this path, why are they shipping crude to America. Why don't they refine it themselves and sell the Americans diesel, petrol lubricating oil and so forth. It's not enough that they are completely ignorant of what climate change is going to do to their agriculture in the near future. They are also economically incompetent. They are in great need of a representative form of government.
On a related topic, for a take on Canada's ecological credentials, read Farley Mowat's book Sea of Slaughter. I suppose at least Canada shows consistancy. Did you see what the Canadian justice system did to Percy Schmeiser. Sorry, I know this is a political comment but in the end, everything is political.
-
grindupBaker at 05:13 AM on 28 April 2013Guemas et al. Attribute Slowed Surface Warming to the Oceans
As example (but highly plausible) value for illustration only, if "final" (exc. natural periodic vagaries) Dr. Hansen "best estimate" average surface temperature +2.8 degrees C is required in order to balance in & out TOA radiation then it seems logical that "Global Warming" will stop when the oceans are ~+2.8 degrees C warmer than a hundred years ago, or whatever is the base line for this. I read currently the deepest 80% ocean is 2-6 degrees with avge. ~4.4 and that substantial mixing takes centuries. If so, deepest 80% increases from present 4.4 to ~7.2 degrees and that is a significant rise vis-a-vis the melt-freeze point of water on this Celsius scale. I think (unless there's some science that shows deepest ocean does not get warm when the surface stays warms for millenia) that is one of the most significant points that a layperson might understand.
-
Rob Painting at 14:19 PM on 27 April 2013Guemas et al. Attribute Slowed Surface Warming to the Oceans
Carl - the most likely scenario is that surface warming will rapidly increase when the climate returns to an El Nino-dominant period (or positive phase of the Pacific Decadal Oscillation, if you like). It's not impossible that La Nina will continue to dominate, but it's not what we expect, and is not a robust prediction of climate modelling.
It important to realize that the warming of the deep ocean will not affect global surface temperatures for hundreds of years. It's the heat that accumulates in the upper ocean that is exchanged with the atmosphere during ENSO events. So, based on the period of observations, and climate models, the natural oscillation of global weather (La Nina-neutral-El Nino) will likely continue - and we're about due for the positive phase of the PDO. The Earth might have other ideas however.
Perhaps the salient point glossed over in these discussions is that global warming (the energy absorbed in all the global heat reservoirs) typically increases much faster during La Nina-heavy periods - due to greater heat uptake by the ocean, and slows down during El Nino - as a large flux of heat leaves the oceans and warms the atmosphere on its way out to space.
-
Carl Sargon at 14:00 PM on 27 April 2013Guemas et al. Attribute Slowed Surface Warming to the Oceans
It doesn't take much temperature change in the deep oceans below 2000 m to soak up a HUGE amount of the "radiative imbalance" heat - e.g. another 0.1° C warming would probably double the new heat stored there in the last 50 years.
What's the chances that some weird feedback mechanism (more La Nina's, or faster flow of the slow-moving bottom-hugging ocean currents, or increased area of down-welling ocean currents, something) will sequester all of the next 20 years of otherwise surface-warming excess heat into the deep ocean ? How confident are the appropriate scientists that the slowdown of surface warming is just a natural variation ("whoops, a couple extra La Nina's this decade...") - as opposed to some multi-decade preconditioning of the Eath before a huge surface warming spike hits after the oceans have reached some critical threshold ?
The overall warming of the planet might be accelerating, as expected with rising CO2 levels and continuing radiative imbalance, but is it possible the global surface temperature plot can remain steady for 2 or 4 more decades, before shooting up to some expected equilibrium temperature ? Do they have strong expectations for the shape of that plot, or mainly just the endpoints ?
If I'm reading a few quotes by Trenberth correctly, he seems to have a strong expectation for "equilibrium" surface, upper ocean, deeper ocean temperature profiles, so if the deeper ocean heats up faster now, there will be less warming needed there later, so faster warming later of upper ocean, surfaces ?
-
student28 at 06:02 AM on 27 April 2013Food Security - What Security?
The effect of extreme weather events in the context of food production scares me. If our population will be over 10 billion by the year 2065, how is it possible to shy away from industrial produced agriculture? The prices will sky rocket with drought looming ahead. How can sustainable food growth make its way back into the market when there are so many people to feed, many of which go hungry every day. Population seems to be the largest causal factor, in my opinion, when it comes to climate change. As this post shows, we are already seeing droughts, floods, and heat waves decrease the stability of mass food production and infrastructure (which is seen to be essential in transportation of crops.)It is hard not to feel despair when information is presented to me like this. I try to feel empowered, because I am gifted with this knowledge and can pass it on to others who might not realize the many effects that climate change has on the security of our lives.
-
John Hartz at 05:07 AM on 27 April 2013Be part of a landmark citizen science paper on consensus
Many thanks to all who contributed.
PS - I am particularly anxious to see how much George Soros donated.
-
Andy Skuce at 04:24 AM on 27 April 2013Global Warming: Not Reversible, But Stoppable
grindupBaker:
I agree that we should be more careful in how we use "global warming" in a casual way to refer to warming of the surface temperatures and/or warming of the oceans, particularly the deep oceans. This is especially true now, as more research indicates that the recent slowdown in the rate of surface temperature increase is more than fully compensated for by warming in the oceans.
On the other hand, I think that "heat up the planet" is fine in non-technical discourse, since everyone can safely assume that, since we are talking about climate change, the 'planet" means the bits we and other life forms inhabit and that we are not particularly concerned with the warming effect on the solid, rocky Earth. Neither should we object to casual use of "heat up the planet" on the grounds that parts of the atmosphere, like the stratosphere, are experiencing anthropogenic cooling.
-
empirical_bayes at 02:44 AM on 27 April 2013Be part of a landmark citizen science paper on consensus
Congrats! I'd chip in, too, but didn't see it 'til now.
-
jdixon1980 at 00:55 AM on 27 April 2013Be part of a landmark citizen science paper on consensus
I'm with Philippe - just clicked on the post this morning!
-
EliRabett at 23:42 PM on 26 April 2013Malaria: biting into the climate change debate
There is an important point missing her. Malaria has two reservoirs, mosquitos and people. You can wipe it out in an area by decimating the parasite in EITHER of the two.
Artemisinin triple combination therapy can wipe it out in humans before it ping pongs back to the bugs, but there are more pressing issues than climate change at this time. First, Artemisinin resistant strains are starting to appear mostly in SE Asia, probably associated with "cut" drugs. Second, we need a cheap test for infection because right now the more expensive Artemisinin based therapy is being over used.
(snip)
Moderator Response:[Sph] Agreed, but still a violation of the comments policy.
-
grindupBaker at 17:16 PM on 26 April 2013Global Warming: Not Reversible, But Stoppable
My prior post would have better said example +0.9 degrees C since that is the red line value. Example value makes no difference to the comment text though.
-
Paul D at 17:12 PM on 26 April 2013Be part of a landmark citizen science paper on consensus
That is very impressive fund raising!
Three cheers for those that dug deep.
-
grindupBaker at 17:12 PM on 26 April 2013Global Warming: Not Reversible, But Stoppable
I disagree with point (2). Even if the graph C red line with flat temp next 300 yrs was correct I would disagree because "Global Warming" isn't changes in surface temperature, it's increase in the ocean heat content. Dr. Trenberth says in lecture 2 yrs ago there's 0.9+/-0.4 wm**-2 radiation imbalance and I believe him to be likely close enough because he seems knowledgeable. If temperature goes flat it's just because ocean mixing happens to match radiation imbalance. It would even be possible for radiation imbalance and temperature change both to be ~0 as much as is noticeable with "Global Warming" continuing, the heat just passes through unobtrusively (depending on the superbness of instrumentation & theory). As example only, if +1.5 degrees C happens to be the final average surface temperature then I see no reason why "Global Warming" would stop until the deep oceans entirely are +1.5 degrees C than they were a hundred years ago, or whatever is the base line for this. Furthermore, I think it's important not to mix'n'match phrases like "heat up" and "Global Warming" and also the trite ones bandied about (not in this post or comments) because that's going to confuse the heck out of non-scientists - when you say "heat up the planet" they'll think temperature of the bits they see. And "the planet" has a middley bit you know, apparently there's some molten rock. Shouldn't be calling "the ecosphere" "the planet". It really needs mention of the ecosphere, perhaps even some reference as to how deep in the earth and oceans is being considered.
-
Philippe Chantreau at 15:47 PM on 26 April 2013Be part of a landmark citizen science paper on consensus
Dang! This was so quick that I didn't even see the original post, only the amended one with the "goal reached" update!!!
Congratulations John and team. For one like me who has followed SkS since the early beginning, the evolution of the site is quite impressive. The collective publication record of the contributors is starting to add up too.
-
dana1981 at 14:48 PM on 26 April 2013Announcement: New Guardian Blog by Dana Nuccitelli and John Abraham
Agnostic @16 - I believe you do. I certainly did! Probably several dozen commenters linking to a terrible cherry picking blog post response by Tisdale on WUWT.
Ironically cherry picking was the main subject I raised in my first Guardian blog post, and WUWT and Tisdale respond by...cherry picking data.
-
dana1981 at 14:46 PM on 26 April 2013Be part of a landmark citizen science paper on consensus
The paper will be published in a couple weeks. We'll have a whole lot more to say about it then.
-
DSL at 13:20 PM on 26 April 2013Be part of a landmark citizen science paper on consensus
Oh yah: congratulations, well done, etc. What's next?
-
DSL at 13:19 PM on 26 April 2013Be part of a landmark citizen science paper on consensus
What a hoot. I was thinking, "Well, I'll have to wait till May 1, and then I'll pitch in." Yah, so much for that.
-
Riduna at 12:28 PM on 26 April 2013Announcement: New Guardian Blog by Dana Nuccitelli and John Abraham
Congratulations! By any standards, impressive. Do I hear expressions of fury from the region of WUWT?
-
Glenn Tamblyn at 10:49 AM on 26 April 2013Be part of a landmark citizen science paper on consensus
Thanks for all the support guys. 9 hours! Awesome
The paper will be worth it. Hopefully JC will have more details on publication date soon.
-
dana1981 at 10:26 AM on 26 April 2013Be part of a landmark citizen science paper on consensus
Thanks to all who donated! Very cool to have a citizen science paper open access-funded via crowd sourcing, and within 9 hours! Great to see so much support of this important work. I think everyone will be very pleased with the quality of the research and conclusions.
-
John Cook at 10:16 AM on 26 April 2013Be part of a landmark citizen science paper on consensus
Just letting you all know our goal of $1,600 was met. As Dana published this blog post at 1am my time, we got halfway while I was blissfully sleeping. While I was on the train to campus, the donors quickly got us fully over the line. Thanks to all the donors, I'm blown away by the generosity and passion shown by SkS readers. Will publish a blog post with more details soon.
-
John Hartz at 10:08 AM on 26 April 20132013 SkS News Bulletin #8: Alberta Tar Sands and Keystone XL Pipeline
Synapsid:
The environmental/progressive community in the US and Canada is fully engaged in a multi-faceted effort to slow and eventually halt the extraction of fossil fuels in North America. It is quite capable of adressing coal, oil, and natural simultaneously.
Prev 908 909 910 911 912 913 914 915 916 917 918 919 920 921 922 923 Next


