


 Arguments


Recent Comments
Prev 928 929 930 931 932 933 934 935 936 937 938 939 940 941 942 943 Next
Comments 46751 to 46800:
-
slasher at 20:41 PM on 28 March 2013Tung and Zhou circularly blame ~40% of global warming on regional warming
what if the 0.08/decade increase is not attributable to new emissions but the effect of deforrestation, deforrestation has been occurring at a significant rate since 1850s which corresponds to the data set time period
-
tobyjoyce at 20:08 PM on 28 March 2013Polynomial cointegration refutes AGW
Hendry & Pretis published a comment on Beenstock et al in February 2013 in Earth System Dynamics.
http://www.earth-syst-dynam-discuss.net/4/219/2013/esdd-4-219-2013.html
It constitutes a full refutation of their paper.
Abstract:
In their analysis of temperature and greenhouse gases, Beenstock et al. (2012) present statistical tests that purport to show that those two variables have different integrability properties, and hence cannot be related. The physics of greenhouse gases are well understood, and date from insights in the late 19th century by Arrhenius (1896). 10 He showed that atmospheric temperature change was proportional to the logarithmic change in CO2). Heat enters the Earth’s atmosphere as radiation from the sun, and is re-radiated from the warmed surface to the atmosphere, where greenhouse gases absorb some of that heat. This heat is re-radiated, so some radiation is directed back towards the Earth’s surface. Thus, greater concentrations of greenhouse gases15 increase the amount of absorption and hence re-radiation. To “establish” otherwise merely prompts the question “where are the errors in the Beenstock et al. analysis?”.
We will demonstrate several major flaws in their approach, such that none of their
claimed conclusions has any evidential basis.Section 2 uses an uncontroversial example to highlight the dangers of approaches
20 that fail to address all the complications inherent in statistical analyses of observationaldata.Section 3 applies the reasoning to the apparently more controversial case of the
relationship between greenhouse gases and temperature. -
Tom Curtis at 18:59 PM on 28 March 2013The two epochs of Marcott and the Wheelchair
KR @19, I am certainly not arguing that the original paper did not adequately communicate the lack of robustness in the reconstruction over the last two centuries. In addition to the passage you quote, they showed several graphs emphasizing the point.
Nor am I necessarilly criticizing the article above. If that article was written as an introduction to the paper for a scientifically literate audience who could be expected to understand about uncertainty and robustness, and to look up the paper for themselves, it is quite appropriate.
Here, however, because SkS is trying to reach not just the scientifically literate, SkS needs to explicitly canvas the issues regarding robustness; and also the method actually used by Marcott et al to determine their headline result. This is particularly the case in that the interpretation of the uptick as representing the twentieth century warming, and Marcott et al as another hockey stick is being widely played around the web. Both interpretations are false, and easilly shown to be false. Not providing the correct information, therefore, merely allows "skeptics" to score cheap points on the paper without addressing the substantive issues that it raises, ie, that:
1) Temperatures now are in the upper range of Holocene temperatures and will rapidly exceed temperatures experienced throughout the Holocene in this century; and
2) Temperatures at the start of the 20th Century where close to minum Holocene values, such that temperatures have gone from near minimum to close to maximum Holocene values in just one century, thus reversing 4 thousand years of temperature decline in just one year. That rate of change is likely unprecedented throughout the Holocene.
-
chriskoz at 18:51 PM on 28 March 20132013 SkS News Bulletin #5: Alberta Tar Sands and Keystone XL Pipeline
Well written piece on Planet 3.0 by our own Andy Skuce.
I argee with the analysis therein: it's not the co2 numbers that matter in that debate but the symbolic approval of the investors to continue/increase the financing of these industries. The industries would not go ahead witrhout those investments. KXL itself maybe small step of increased emissions but will lead to a "giant leap" when investment monies go behind it.
-
chriskoz at 18:38 PM on 28 March 2013To frack or not to frack?
Did they measure the d14C in this elevated level of methane around fracking wells? The lower than background d14C would confirm that the source is fosil fuel rather than active biosphere, therefore settle the question of leaks that FF industries are obviously denying despite rumours.
Or are the expected isotopic differences too small to measure?
-
Rob Painting at 16:54 PM on 28 March 2013New Research Confirms Global Warming Has Accelerated
GrindupBaker - Dr Trenberth was lamenting the inadequate state of global observations. He was not literally saying the heat was missing - just that we lacked the ability to measure where it was i.e the deeper ocean. In essence, he was urging scientists to work harder on solving this problem. Contrarians have predictably twisted the intent of Dr Trenberth's words, but that comes as no surprise.
The ARGO network has remedied the inadequacy of the ocean measurements to some extent, but they still only measure down to 2000 metres - whereas the the global oceans are over twice that depth on average.
Still a lot of work to be done, and a deep-ocean observation system would be desirable but, as Balmaseda (2013) has demonstrated, the observations show that global warming has actually accelerated over the last 16 years.
This implies that the climate sensitivity (the temperature increase with a doubling of atmospheric CO2 concentration) is at the higher end of the range of estimates.
-
JasonB at 16:44 PM on 28 March 2013A Detailed Look at Renewable Baseload Energy
vroomie,
I already tried making that point (here and here) but apparently discovering that he was wrong about fuel supply by a factor of 150 was not enough to make JvD question his level of subject knowledge. He never addressed my point about the potential penetration level of nuclear power after I showed France was not the good example he thought it was, either.
Regarding the "uranium from seawater" idea, "The total amount of uranium recovered in an experiment in 2003 from three collection boxes containing 350 kg of fabric was >1 kg of yellow cake after 240 days of submersion in the ocean." (Wikipedia, citing Seko et al. 2003.) That suggests that you would need 55,000 tonnes of fabric per reactor, submerged in seawater for 2/3 of the year, in order to collect enough uranium for that reactor for one year. Practical? You be the judge.
JvD, quoting The Australian, apparently quoting Hansen, said:
Even in Germany, which pushed renewables heavily, they generated only 7 per cent of the nation's power.
The thing about true sceptics rather than "fake skeptics" is that we allow facts to change our minds rather than mindlessly accepting arguments from authorities that we happen to like. In this case it's entirely possible that The Australian is accurately reflecting Hansen's opinion (although I wouldn't automatically assume that), but even though I respect Hansen greatly I'm not going to simply take his word for it, especially since it's not an area that he is an actual authority in.
In fact, in 2011, 20.5% of Germany's electricity supply was produced from renewable energy sources, compared to 17.7% from nuclear, and Germany has far from the highest percentage of renewable power generation of any country in the world, or even the EU!
JvD has repeatedly tried to portray SkS as portraying the "contrarian" position when it comes to renewables and nuclear power, and himself as holding the "scientific" position. Normally, to disavow someone of that notion, I would point them to a well-written and researched article on SkS. In this case, the article I would point JvD to... is this one! He hasn't argued against any of the reports presented, he has merely stated that it was "per definition" that "Intermittent renewables cannot provide baseload power". If only SkS realised that it could debunk all those skeptical claims by saying they were wrong "per definition"!
Since JvD is in Europe, it's surprising that he overlooks one significant benefit that Europe has, which is Norway's massive potential for pumped hydro storage. Fully developed it could single-handedly power all of Europe for weeks, allowing Europe to easily take advantage of large amounts of intermittent renewables. Indeed, pumped hydro storage construction is booming in Europe, with this decade set to the the largest growth in capacity on record precisely to accommodate intermittent renewables.
-
John Hartz at 14:08 PM on 28 March 2013New Research Confirms Global Warming Has Accelerated
@grindupBaker:
Unlike most SkS authors, I am not a climate science wonk and therefore am not able to respond to your question. I suspect that others will do so however.
-
grindupBaker at 11:56 AM on 28 March 2013New Research Confirms Global Warming Has Accelerated
mehus@19 dana1981@20 John Hartz@21 I inferred from Kevin Trenberth lecture on Utube that "missing heat" was discrepancy between radiation imbalance (KT stated 0.9 wm**-2) & delta ocean heat expected from it. If so, volcanos aerosols & others would not affect "missing heat". Did I misunderstand what the discrepancy was ? Was it rather a discrepancy twixt the underlying physics, or models, & prior delta ocean heat measured ?
-
The two epochs of Marcott and the Wheelchair
Tom Curtis - "The question then becomes, why did you not communicate those uncertainties and lack of robustness?"
I believe that uncertainty was sufficiently stated in the original paper, with "...this difference is probably not robust."
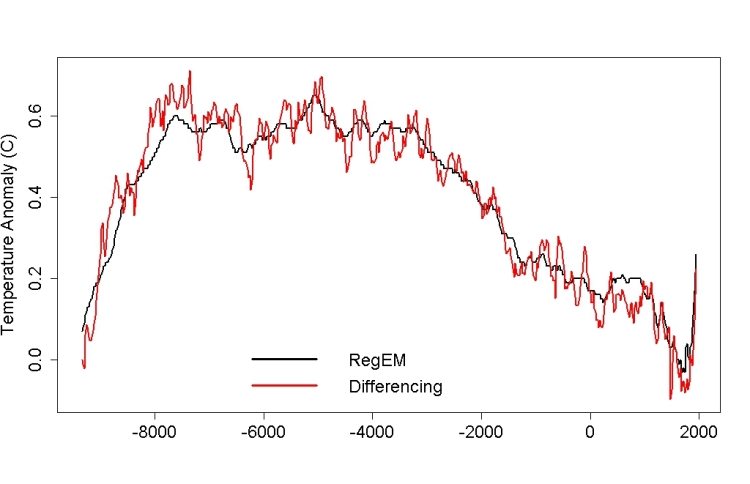
Personally, after examining both the paper and in particular Tamino's analysis, my initial response is confirmed - the size of the uptick is to some extent an artifact of the processing. The RegEM processing (which would have been my preference, quite frankly, with infilling rather than increasingly limited spatial data) and the Tamino differencing methods are far more likely to reflect the ground truth.
And, of course, the alignment with current temperatures was done over 500-1500AD, not over the last 500 years, with the Mann 2008 and HadCRUT3 data aligned as per overlap.
Which leaves the deniers frantically looking for some possibility of current temperature swings being natural (good luck with that!) rather than the result of our actions.
-
The Big Picture (2010 version)
tcflood - Regarding reflection (albedo), in the SW frequencies it's about 30% reflection. Again, a number that is easy to find if any effort is put forth, and one of the components leading to the 240 W/m2 average insolation. Why have you not looked this up???
I hate to say this, but since you have not actually posed any questions or concerns regarding the greenhouse effect, but rather talked a lot about uncertainties without either quantifying said uncertainties, or conveying much of substance, I would at this time regard you as a concern troll.
I would be more than willing to be proven wrong, mind you - but that's going to take some actual questions or assertions on your part, rather than vague 'concerns' and run-on postings.
-
Tom Curtis at 10:28 AM on 28 March 2013The two epochs of Marcott and the Wheelchair
KR @11, that is correct. However, as Marcott et al show (Fig 1E), there results are fairly robust to choice of recent reconstruction; and as Tamino shows, are robust even for direct matching to the instrumental over the period of overlap provided the method of differences is used rather than simple averages.
-
Tom Curtis at 10:25 AM on 28 March 2013The two epochs of Marcott and the Wheelchair
Eli @14, I agree. However, when the graph of the reconstruction is not robust (in the last two centuries), we should clearly stat that rather than focussing of trivia of shape. It is a matter of clear science communication. If we do not do it, we create hostages for the deniers. People whose understanding of the graph is superficial, and hence who are likely to be persuaded by superficial criticisms.
-
Tom Curtis at 10:21 AM on 28 March 2013The two epochs of Marcott and the Wheelchair
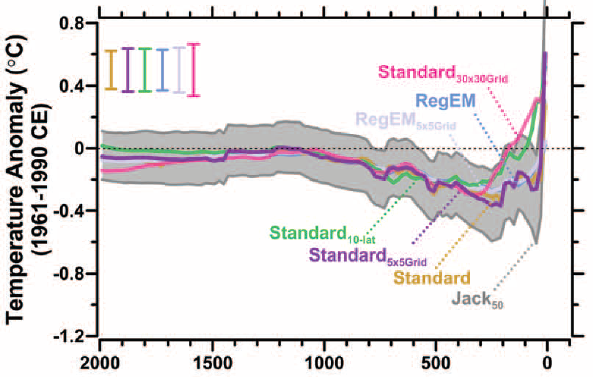
Jos Hagelaars @15, I will accept your word that you were aware of the uncertainties, and presumably lack of robustness, of the uptick at the end of the Marcott graph. The question then becomes, why did you not communicate those uncertainties and lack of robustness? Given that there are serious issues about the robustness of the reconstruction over the last few centuries, why is that issue never canvassed in your article? Why is the word "robust" not even mentioned?
In your article you write:
"The temperature reconstruction ends mid-20th century, so the rapid temperature rise since 1850 is clearly visible in the graphs presented in their study. And what do we see? Again something that looks like a hockey stick as in the graph from Mann et al 2008."
"[S]omething that looks [as much] like a hockey stick as in the graph from Mann et al 2008." Really?
(Source)
Everything beyond the uptick visible in the RegEM reconstruction is an artifact of the drop out of proxies with time. Therefore the hockey stick like appearance of the graph that you are focussing on is an illusion - an artifact of a poor statistical technique.
As it happens the mean uptick in the resconstruction using the method of differences and simple averaging only reaches an anomaly value relative to 1961-90 of -0.04 C. (That is not clear from Tamino's graph, as he uses a different baseline.) That lies outside the lower range of the 2 sigma error margin of the Standard 5x5 method shown in the main graph. The mean uptick using original published ages for the proxies is only -0.1 C relative to 1961-90, or 2.5 Standard Deviations below the uptick actually shown. That is probably the best estimate of the mean temperature from 1930-1950 using the Marcott proxies, and is a value exceeded by greater than 50% of Holocene temperatures. It compares well with the HadCRUT3v value of approximately -0.06 C for the same period.
Again, this is not an issue of uncertainty, but of robustness. The Marcott et al uncertainty estimates do not capture the effect of averaging without regard to the drop out of proxies. More precisely, the show the influence of the reduced number of proxies, but do not account for the influence of the relative temperatures of the proxies that drop out. That is why Marcott et al indicated the twentieth century temperatures were not robust (ie, that they were likely to change significantly as the result of improved or different methods), rather than that they are uncertain (ie, that improved proxy sets are likely to narrow the estimate within the current estimated uncertainty range).
This can be seen with the table of values and 1 sigma uncertainties for the different methods tried in Marcott et al:
Method
1940 Anomaly
(Degrees C)
1 sigma
(Degrees C)
Standard 5x5 0.6 0.28 Standard 30x30 0.42 0.16 Standard 10 lat 0.52 0.25 Standard 0.28 0.23 RegEM 0.02 0.63 RegEM5x5 0.05 0.13 Jack30 0.65 0.34 Jack50 0.60 0.40 The values which all estimates overlap within 2 Sigma is 0.1-0.31, well above the probable values for the period. Further, only half of the methods (Standard, RegEM, RegEM 5x5, and Jack50) have 2 sigma uncertainty ranges that overlap the probable values.
Further, it is not true that the "After the year 1850, the influence of man-made emissions is clearly visible in Marcott's figure". First, this is not true because the rise in temperature to 1940 is primarilly (though not exclusively) due to natural causes. Second, it is not true because the rise to 1940 is well within the range of variability demonstrated by Mann et al 2008's reconstruction over the preceding 2000 years. Third, it is not true because even the start of the rise is not a robust feature of the analysis carried out by Marcott et al., as seen in Fig 1 C of the paper:
In that figure, depending on which of several plausible methods you use, the rise starts as early as 1650. That is because the rise in those methods is primarilly an artifact of the drop out of proxies, and hence cannot be used to determine the timing of the real rise.
Using the differencing method, a better estimate can be obtained, but then the rise starts 1750 or 1800 depending on whether you use original published ages or Marcott's redating of the proxies. (See the fourth figure in my post @8.)
Finally, although you did quote some of the passage I quoted from Marcott et al, you did not explain the reasoning behind the quote. You did not show how the analysis by Marcott et al allowed them to reach their conclusions.
This is crucial. By leaving people with the impression that Marcott's conclusion was based on the spurious spike, you also leave them vulnerable to believing McIntyre has refuted Marcott when all he has done is quibbled about some fringe issues. More generally, by not showing the why of the reasoning, you have left people reliant on authority, or there own ability to interpret Marcott et al (which is not the clearest paper when it comes to describing methodology).
I do not know you or your blog. You may write for scientifically trained or technically minded people who can be rellied on to look up the paper for themselves, and examine the ins and outs of reasoning. Skeptical Science, however, is aimed at the general audience. In principle, most blogs should be readable and understandable by a person with only ten years of schooling, and a moderate facility with science. For those readers, in cross posting, the basics of Marcott's reasoning and the pitfalls in his method should have been explained.
The still need to be, in an addendum to the post.
-
tcflood at 09:54 AM on 28 March 2013The Big Picture (2010 version)
The problems with your understanding of the presentation of the greenhouse effect presented above is that you missed the context. I stated that this is a direct quotation of an email to a contrarian and my comments about something not making sense are directed to him. I had hoped that you would read carefully enough to discern the context and figure out the gist of his ideas that I was rebutting.
Also, KR (193)
95-99: emissivity is not a black body for purposes of a discussion where we are ignoring reflection?
Also, Sphaerica (188, 190)
If you take the time to actually read what I have written, you will see that all of your criticisms are baseless because all of what you are contending is missing is actually there.
Oh, and also, I didn’t say that computational mechanisms might be crude, I said that the computational mechanisms of coupling spheres might be crude. Do you really think that I think that “some guy thought it up over a weekend, and then just stopped there and started plugging in parameters?” But then you have actually read some of the code so I would clearly be foolish not to accept your assertions about the validity of models.
I was hoping to have found a place where I could ask honest questions and have honest discussions. All I am getting are corrections of errors that are from faulty reading of what I have written and insufferable condescension.
Like Arnold didn’t say, “I won’t be back.”
Moderator: please remove me from your site.
-
Bob Lacatena at 09:41 AM on 28 March 2013Stratospheric Cooling and Tropospheric Warming
tcflood,
I just noticed that the phrasing of your question was also inaccurate. No one says the statosphere must cool for the troposphere to heat. The real fact is that the nature of CO2 (unlike other forcings) will heat the troposphere and cool the stratosphere, independent of each other, for the reasons explained above.
This is different, for example, from an increase in solar insolation, which would warm the surface and atmosphere directly, causing the earth to radiate more (more in, more out), but would leave the atmosphere unchanged (except for whatever effects the increase in incoming radiation would have directly on the stratosphere).
Or consider the case of less ice, such as when the ice sheets retreat at the end of a glacial period. Less ice reflects less radiation. With less radiation reflected in the visible spectrum, the earth will heat more, until it emits enough IR to compensate for the increased absorbed radiation. The earth is receiving and will emit the same total amount of energy, but more of it must be in the IR (and the planet is warmer). But this would have minimal effect on the stratosphere.
This is one reason why stratospheric cooling is itself a signature -- a fingerprint -- that adds one more bit of evidence that CO2 is the cause of our current warming. The theory predicts stratospheric cooling, and we see it, when other warming mechanisms would not show this.
-
vrooomie at 09:22 AM on 28 March 2013A Detailed Look at Renewable Baseload Energy
CBD: I was thinking that the realists had taken sway of this wildly-divergent thread and I thought some FACTS were called for, on the part of the person who was making geologically-inconsistent claims. Being a geologist, I thought I was going to help.
There I go, thinkin' again.
Sorry. Back to the crazy...;)
-
dana1981 at 08:43 AM on 28 March 2013NASA Retirees Appeal to their Own Lack of Climate Authority
Harold, your prelim report has some serious problems. The claim that climate sensitivity estimates are based exclusively on climate models is just wrong - see here. The risk management discussion I've already addressed in this post. Your argument is no different than saying "I don't think I'm going to get into a car accident, so I'm going to drive around without auto insurance." Except it's worse, because the odds of very damaging climate change are even higher than the odds that you'll get into a car accident.
I keep wondering what you would think if a group of climate scientists spent a few months reading about the space shuttle program, decided that we could not have reached the moon with the technology available in the '60s and '70s, wrote a preliminary report saying so, and then went around to political conferences saying that the moon landing must have been faked.
-
The Big Picture (2010 version)
tcflood - You've raised many questions: I would direct you first to The Discovery of Greenhouse Warming, and in particular The Carbon Dioxide Greenhouse Effect; which proved clear explanations of many of these issues with links to primary references.
For another overview, RealClimate's post on The CO2 problem in 6 easy steps is also worth reading.
For tropospheric/stratospheric questions I will echo Sphaerica's suggestion.
---
However, I'm a bit concerned.
You state "Your analysis of the earth's blackbody (bb) radiation (bbr) and its interaction with the atmosphere makes no sense to me." (emphasis added) - but after several paragraphs describing these interactions, you have raised no issues whatsoever in that regard. I would hesitate to go further in that regard until you actually pose some kind of question or concern, rather than roughly restating the obvious.
[ Note: The Earth is not a black-body (emissivity of 1.0), but in the IR wavelengths associated with thermal radiation at surface temperatures, it has an emissivity of 95-99% depending on local surface; and that calculation matches measurements. ]
-
Bob Lacatena at 08:09 AM on 28 March 2013Stratospheric Cooling and Tropospheric Warming
tcflood,
This is a response to this comment from The Big Picture...
You asked:
Does anyone have a good physical explanation (like I have presented above, not mathematical) of why the stratosphere must cool for the troposphere to heat during the greenhouse effect?
Yes.
As explained earlier, there are two answers to this.
Molecular Reasons
Let's start with the first, in which there are two interlocking mechanisms at work. One is the absorption and emission of IR by CO2. The other is the transmission of energy between molecules as a result of a collision.
So in the lower troposphere, where the air is dense, there is a lot of CO2 to absorb IR. But there are also far more O2 and N2 molecules, and so many collisions, such that energy is quickly transferred through collisions to O2 and N2 molecules. What was vibrational energy in the CO2 molecule turns into translational (and perhaps very slightly rotational) energy in an O2 or N2 molecule.
Of course, everything is rate of reaction:
1) * + CO2 --> CO2*
2) CO2* + O2 --> CO2 + O2* (O2* is just accelarated, not "excited", O2)
3) CO2* --> CO2 + *
4) O2* + CO2 --> O2 + CO2*
Equation 1 happens a lot, but is dependent on the concentration of CO2 and * (IR photons in the right wavelength).
Equation 2 happens a lot more, but is dependent on the concentration of excited CO2* molecules and O2 (or N2) molecules.
Equation 4 happens pretty much, and is dependent on the concentration of unexcited CO2 and O2 (or N2) molecules.
Equation 3 happens not so much in the denser parts of the troposphere, because equation 2 happens so often and so frequently that excited CO2* doesn't have much chance to re-emit IR. Of course, it does happen, but then what matters is rates of reaction, and which equations dominate the system in which states.
As we move into the less dense upper troposphere and stratosphere, we find that there is less IR to absorb, and also with more rarefied air, less collisions. So the relative rates of equations 1 and 2 go down, while 3 and 4 go up. We reach a point where rather than absorbing IR and heating the surrounding atmosphere (1 and 2), the surrounding atmosphere is "heating" (exciting) CO2 which then is able to emit the IR (in all directions, obviously), some of which makes it into space.
So, on a molecular level, this explains why CO2 cools the stratosphere but warms the troposphere.
Emission Reasons
I've thought about this less, so my explanation will be somewhat vague... and honestly, we've recently had a discussion (argument) about both of these reasons, and which is more correct (molecular or this one, for which I don't have a good name)...
As you have recognized, the earth must emit exactly as much as it absorbs, once it achieves equilibrium. This means that at a warmer temperature it will still emit the same level of radiation, but the profile of that radiation will have changed. This can be seen in figures 2 and 3 of this original SkS post above. What it means is that the same total amount of radiation is emitted, but the spectrum will have less emissions in the "CO2 window". This in turn means that there is less IR for the CO2 in the stratosphere is to absorb (again, equation 1 happens less often in the stratosphere, but it does happen) and so equations 1 and 2 are even less likely to happen.
Summary
1. Raising CO2 in the troposphere increases the chance of IR being absorbed and transferred to the surrounding atmosphere.
2. Raising CO2 in the stratosphere increases the chance of energy being "stolen" from the stratosphere and emitted as IR into space.
3. Raising CO2 in the troposphere changes the profile of outgoing radiation, such that there is less radiation in the CO2 IR band for the stratosphere to absorb to "stay warm."
-
scaddenp at 08:02 AM on 28 March 2013The Big Picture (2010 version)
I think model discussion should be moved to "are model reliable" thread.
Moderator Response: [DB] Yes; please move the individual components of this discussion to the most appropriate threads. This has gone beyond the topline scope of this thread for multiple topics. -
Bob Lacatena at 07:47 AM on 28 March 2013The Big Picture (2010 version)
tcflood,
Does anyone have a good physical explanation (like I have presented above, not mathematical) of why the stratosphere must cool for the troposphere to heat during the greenhouse effect?
Good question. The moderators are going to yell at us for being off topic, and ask us to take it to another thread... which I'll do. Please look here for your response.
-
Bob Lacatena at 07:45 AM on 28 March 2013The Big Picture (2010 version)
tcflood,
What do you mean by "this stuff is about back radiation being non-physical because of some cut-off?" To what does that refer?
There are some flaws (deficiencies?) in your discussion of the behavior of the atmosphere. The "all directions" thing shows (sorry) a very low level understanding of a complex system. In particular, there are many types of molecules, and collisions happen many times faster (in the lower atmosphere) than re-radiation. The first effect of CO2 is that CO2 absorbs IR, then passes that energy on to an O2 or N2 molecule (which has limited ability to emit energy as radiation), thus heating the surrounding atmosphere rather than simply re-emitting the radiation in all directions.
Too, the density of the air changes, so you need to profile the atmosphere as an infinite series of layers. Because of the difference in density and composition (to a very small extent), the behavior of each layer is different.
You say:
...climate sensitivity ... cannot be estimated by one simple calculation of a fractional change in power transmitted by one CO2 molecule.
Yes, and no. You are right, estimating equilibrium climate sensitivity requires a far more complex model (or clever paleo studies). But at the same time, you know that an understanding of just a few chemical equation gives you a good starting point to predicting the behavior of a solution of chemicals. There are things you can do with that and things you can't. Who is claiming otherwise?
This is just a quick comment on your post... let me write another answering your question. It's related to where I started in this comment.
-
tcflood at 07:34 AM on 28 March 2013The Big Picture (2010 version)
Sphaerica; (185)
To greater or lesser extents, I have done some of several of the tasks on your list. As a calibration point for your second item 2), let me present here the content of an email I sent to a Swedish mathematician whose post on the greenhouse effect I ran across on the web.
(Beginning) Your analysis of the earth's blackbody (bb) radiation (bbr) and its interaction with the atmosphere makes no sense to me. Let's take the average temperature of the entire surface of the earth as a steady state value with insolation (shortwave, sw) as the energy input and thermal radiation (long wave, lw) from the earth plus the atmosphere and everything in it as the energy output to space. For simplicity, let’s ignore reflection. Clearly, the sw power in must equal the lw power out for a temperature steady state.
Everyone seems to agree that it is a reasonable approximation to think of the earth as a bb radiator with a frequency distribution as a function of temperature as given by Planck. No one believes the atmosphere is a bb radiator. Greenhouse gases (ghg) absorb the earth's bbr at their respective specific vibrational frequencies and this energy is equilibrated among the usual statistical degrees of freedom of the molecule and its immediate environment, each event infinitesimally increasing the local temperature of the air. At that given temperature, the ghgs and only the ghgs re-emit at the same specific vibrational frequencies (not bbr) at a rate that depends on the local temperature of the air and at frequencies characteristic of the specific molecule. However, this radiation is emitted in all directions so almost half of it works its way back to the surface.
Now, since the earth is a bb, it is a "perfect" absorber of any wavelength independent of the temperature of the bb. The emission wavelength profile is temperature dependent but the absorption is not. This is because absorption is almost exclusively from the vibrational ground state (large majority of molecules) to the excited state, while emission must originate form an excited state that must be thermally populated. The absorption and emission probabilities are identical; that is, if there were equal populations of ground states and excited states, the emission and absorption rates would be identical. So there is no problem with the earth reabsorbing the lwr coming from the ghg molecules in the air, since it emitted those frequencies in the first place.
I can't figure out what all this stuff is about back radiation being non-physical because of some cut-off, but it doesn't seem to have any place in the real physical picture.
Also, the climate sensitivity is the amount that the earth's average surface temperature goes up for a doubling of the concentration of ghgs (in CO2 equivalents). It is the shift in the earth's steady state temperature which is the outcome of all physical phenomena in the total atmospheric air column as a result of that one change. It cannot be estimated by one simple calculation of a fractional change in power transmitted by one CO2 molecule.
In fact if you look at the spectrum of light passing into space at the top of the atmosphere (which has been done by satellite) there is very little radiation that makes it into space at the vibrational frequencies of the ghgs. This means that the earth's surface must become warmer in order to increase the power transmission of the remaining frequencies in order to re-establish the thermal steady state. (End)
Does anyone have a good physical explanation (like I have presented above, not mathematical) of why the stratosphere must cool for the troposphere to heat during the greenhouse effect?
-
Bob Lacatena at 07:34 AM on 28 March 2013The Big Picture (2010 version)
tcflood,
I have downloaded the GISS Model-E source code (it's freely available). As a computer programmer with a background in both modeling and chemistry, I was readily able to read much of the code (although not many people could, and it's so much code and so complex that the most I could do is to browse).
But it's like anything. If you understand how the models work (really understand, not just "have an intuitive feel" -- one which is probably very wrong) and what methods are used to overcome what problems, then you understand better that these models are far, far more reliable than you give them credit for.
Example: Cartisian to polar coordinates. That's kindergarten work for a climate model. A model needs to divide the surface of the earth into cells, but it's not possible to divide the surface of a sphere into equal sized "squares". It's non-Euclidean geometry. There's an entire area of research focused on the various ways of trying to approximate the equal division of the surface of a sphere. You don't have to, but if you don't, your cell-programming is vastly complicated because the dimensions, sides, angles and area of every cell will be different from its neighbors. All of this must be taken into account by a climate model.
Note that very little is "parameterized," and what is parameterized makes sense. It's done either because the input data just isn't available, or because the computational power required to work from the physics is overwhelming and yet does not improve the quality of the solution.
I will correct you... The computational mechanisms are very, very, very far from crude. DIfferent groups work on different models which are interconnected because no one group has the power to work with the complexity of the whole thing, but even so, each module has the complexity that decades of effort by teams of very, very bright people could put into such a thing. Do you really think some guy thought it up over a weekend, and then just stopped there and started plugging in parameters? Does that make any sense with how you know the rest of the world works?
Climate modeling is very, very advanced, very intricate... and very fun.
Links to pursue more about models:
- Real Climate FAQs on Models Part I and Part II
- GISS GCM Model E (documentation and source code)
- Comunity Earth System Model
- Climate Prediction
- Educational Global Climate Modeling
- Earth System Grid Federation
- Monash Simple Climate Model
- Climate Modeling 101
- A post by Isaac Held on one solution to one issue in Radiative Convective Modeling (this is a great, if ancient and simple, example of how modeling can work, under the hood)
- Links to GISS field studies
- System for Atmospheric Modeling
- Stella
There are millions of more links, but... I would advise understanding the climate science (as per my earlier post) first, as well as perhaps beginning to learn more about programming.
[FYI, I have very little time, but I have been working on and am eager to finish a series of posts on the models. Push me and get me to do it!]
-
Tom Dayton at 07:32 AM on 28 March 2013NASA Retirees Appeal to their Own Lack of Climate Authority
Harold, regarding your group's contention #3 "Computer models need to be validated before being used in critical decision-making. Our manned aerospace backgrounds in dealing with models of complex phenomena have convinced us that this rule must be followed to avoid decisions with serious unintended consequences":
Of course the models need to be validated. But your implication that they have not been validated is incorrect. For details, read Steve Easterbrook's postings on model validation. Steve is a computer scientist who used to work on software validation at NASA. So you should respect his opinion on this topic since your group is touting their own experience at NASA as a reason everybody should trust them despite their lack of background specifically in climatology. If you disagree with his opinion, you should comment on his posts there, where he can directly address them.
-
tcflood at 07:08 AM on 28 March 2013The Big Picture (2010 version)
Thanks John Hartz for your compassion – I am feeling a little overwhelmed. (And I am a “he”.) Rest assured, though, I am working on my homework. In the meantime maybe I can inquire about some issues that are bothering me.
Tom Dayton hit it on the head when he said “your uncertainty … comes partly from your suspicion that the innards of those models are so complicated that nobody really knows how they work.” I would add “or if they really are working.” Please note, this is just thought gnawing at my gut - it is not an assertion. I have read large parts of “An introduction to Three-Dimensional Climate Modeling (2nd Ed) by W. M. Washington and C. L. Parkinson to try to get a more intuitive feel for how the models work. I got a good review (in truth, lost on me) of how to move differential equations from Cartesian to polar coordinates, but not much else.
I have not worked hard enough at it yet, but have not yet been able to find what the input and output of these models are, so I have no idea of what is empirically parameterized and what is calculated from the initial conditions by basic principles. Thus, I have no response to skeptics when they claim the desired output is predetermined by the input. Correct me if I am wrong, (now there’s a thought ;-) but I got the impression that the computational mechanisms coupling the different spheres (atmosphere, hydrosphere, cryosphere, …) are crude (probably a consequence of computational limitations) . If so, might this be a place where the results could become distorted?
Moderator Response: [TD] For continued discussion of the narrower topic of model reliability, let's please move this discussion to the post "Models are Unreliable." (I will obey my own request.) -
bjchip at 06:24 AM on 28 March 2013To frack or not to frack?
I've been looking carefully at the drilling/fracking thing and while I reckon that the fracking CAN be done safely under sufficient regulatory scrutiny, the effect is to supply a seive. The Boston leak study is a deal killer. The lack of effective regulation is a political problem and is solvable.
The fracked gas (ANY gas actually) can only be used as a bridge if the leaks are plugged. That needs a financial incentive, and further regulation. The price of gas can't be the only thing keeping people vigilant about the leaks, there has to be a price on the leaks. The CO2 tax idea, on CO2 equivalents - from fossil sources (because a cow absorbs the CO2 it emits as part of the normal cycle, just like tree, fire, CO2, tree)... that CO2 tax has to be in the price of the gas, and the penalty for leaks has to be far far higher... so the economics of sealing them becomes "persuasive".
Otherwise we are at the mercy of those attempting to reshape our our planetary environment to support the return of giant lizards.
-
Harold H Doiron, PhD at 05:59 AM on 28 March 2013NASA Retirees Appeal to their Own Lack of Climate Authority
dana1981,
It has just come to my attention that your critique of the work of The Right Cimate Stuff research team in your January 24, 2013 post that started all of these comments, did not directly address the one-page summary of findings from our year-long investigation that was the subject of a January 23, 2013 press release that you quoted. Our investigation findings, concurred with by all of our team members, were published on Jan. 23, 2013 at the link: http://www.therightclimatestuff.com/SummaryPrelimReport.html
Your critique was focused on answering questions that were posed in an introductory overview tutorial article written as background for visitors to our website that might not be familiar with the basic issues in question and that is found at the link:
http://www.therightclimatestuff.com/CurrentOverview.html
To the extent that any of the questions posed in that introductory article were addressed by conclusions of our investigation, those conclusions can be found at:
http://www.therightclimatestuff.com/SummaryPrelimReport.html
The introductory overview assessment article that you criticized was written by one of our members as a starting point situational description for our investigation. By accident, I now see that the Oct. 2012 introductory overview article title appears like it might be "the report" for which the one-page summary is published at the first link provided above. The " investigation findings" or conclusions in the one-page summary at the first link provided above were not derived from the Oct 2012 article posted at the 2nd link provided above.
I apologize for any confusion this may have caused. My CPAC 2013 presentation that Tom Wysmuller provided links for in comments above, was focused on the one-page summary conclusions of our investigation.
-
JosHagelaars at 05:24 AM on 28 March 2013The two epochs of Marcott and the Wheelchair
@Tom Curtis #8
After reading Marcott's paper a couple of weeks ago and looking at their data (supplemental info), it was quite clear to me what they meant with the phrase 'probably not robust'. It was also quite obvious to me that the 1940 data point has a value of 0.6 °C. It is even visible in the graph in figure 1: the blue 'uptick' line of Marcott et al is placed before (on the left side) of the red line of HadCRUT4. Also, the uncertainty of the Marcott 1940 data point is given by its 1-sigma value of ~0.3 °C, the 68% range. The 95% range comes down to 0 to 1.2 °C. As comparison, the 1-sigma value of the year 6010 BP is ~0.13 °C, quite a bit lower. You should plot the 1-sigma values against time to get an impression.
So, in my opinion I did pick up the uncertainty, I just don't see this as a problem. There is a large scientific uncertainty regarding this so-called uptick, it is clearly presented in the data of Marcott et al (the 1-sigma) and it is mentioned in their paper.
However, scientific uncertainty is not the same as 'now-we-know-nothing'. When I look at their graph I still see a rise in temperature and it still corresponds to Mann 2008. I see no reason to change that after reading all the blogs that go into some of the details and were the uncertainty is based upon. Besides that, I think there is proof that shows us that the uptick is not an aberration: the instrumental data.About your 'Very importantly' part.
Of course this comparison of Marcott et al with the 2000-2009 decade and ICPP A1B is not based on the uptick. This is my text:
- "The average temperature of the last decade was higher than the temperatures have been for 72% of the past 11,000 years"
- "i.e. unprecedented, as many as 5 to 12 standard deviations above the mean of the temperatures in the Holocene."
No reference to the uptick at all, only to the Holocene data. The text you copied from the paper is also present in my text.When referencing to the 2000-2009 decade, Marcott et al mention Brohan et al 2006 (ref 34).
http://www.st-andrews.ac.uk/~rjsw/papers/Brohan-etal-2006.pdf
This paper is about HadCRUT3, but about the sea and land surface temperatures.Regards,
Jos Hagelaars -
BWTrainer at 04:46 AM on 28 March 2013To frack or not to frack?
Another issue to consider is what I would call the "Keystone effect", where opponents of the pipeline argue that approval of it will ramp up and solidify tar sands extraction. Likewise, every new natural gas pipeline, and evey new well drilled, further entrenches the fossil fuel regime. These companies are making investments designed to pay off over decades. Natural gas may very well make sense as a bridge fuel, but that's certainly not how industry looks at it, nor do the politicians they support. If they build the infrastructure, they're not just going to give it up if scientists say "sorry folks, burning any more natural gas isn't safe". Bridges are designed to be crossed, not parked on. We have a carbon budget we need to stay under, not just get to it in 2040 instead of 2030.
I would say we need to stop all new drilling right now while exploting all the currently drilled wells to truly use as a bridge. I've seen new infrastructure put in place in a matter of weeks to months; we can resume drilling at a later point if/when we have better data as to its safety
-
CBDunkerson at 04:26 AM on 28 March 2013A Detailed Look at Renewable Baseload Energy
Don't be silly vrooomie. Doncha know we can get all the uranium we want from the oceans? And there will be zero environmental damage as a result. And we don't have to worry about diminishing returns because as the uranium near the pumping stations is extracted it is instantaneously replaced by ocean mixing. And it absolutely positively will not cost ludicrous amounts of money.
-
grindupBaker at 03:48 AM on 28 March 2013New Research Confirms Global Warming Has Accelerated
Fascinating. I wasted 2 hours last week trying to find detailed ocean current mass & velocity info to figure out whether kinetic energy is significant. I gather it isn't, from a totally uninformed estimate by me I suppose it's maybe ~4 decimal orders of magnitude less than the magnitudes of heat changes ?
-
Bob Loblaw at 02:34 AM on 28 March 2013New Research Confirms Global Warming Has Accelerated
barry @ 41:
Averaging can hide a lot of sins, so your point about variable conditions is quite important.
As a further complication, one must keep in mind that both atmospheric and oceanic energy transfer is dominated by turbulent mixing, not conduction. Although it is a reasonable simplification to think of the transfer of thermal energy in a conduction-like model - where flux is related to the temperature gradient using a turbulent transfer coefficient - it is quite possible to have time-averaged flux moving in the opposite direction to time-averaged temperature gradient.
I'll start by only considering a one-dimensional case - the vertical (because that's the primary direction to think about when we're looking at ocean-atmophere fluxes). Instantaneous turbulent thermal transfer is the result of instantaneous vertical movement (of air or water), multiplied by the thermal energy content. Gradients are irrelevant - in this instantaneous case. To get the average flux over time, you need to average the instaneous variations in (motion x heat content). You can also get fluxes of other things the same way - by measuring humidity, CO2, or whatever. For atmospheric fluxes, measurements of this type are called "eddy correlation" or "eddy covariance", and you can actually buy systems off the shelf. By averaging over time, you can also get the average vertical velocity (which should be zero if you aren't in a plume) and average temperature - and gradients if you measure at more than one height.
The catch with such measurements is that the turbulence that transfers the energy is not independent of the temperature gradients. The atmosphere changes in its stability - a strong vertical temperature gradient can either increase turbulence (if it is warmer below - warm air wants to rise) or decrease turbulence (cold air below - tends to resist upward movement). [Note: I've greatly simplified this explanation of stability - I can go into more detail.] You can have a long period of cold air at the surface with little turbulent mixing and little energy transfer, followed by a short period of a warm surface and lots of turbulence and energy transfer - ending with a time average of warm over cold, but a time average of upward energy transfer. Thus, by looking at time averages, it looks as if energy flow is going against the gradient. This is not a problem with the physics (no 2nd Law violations here!) - it is a problem with the simplified model of looking at time averages, and expecting turbulent transfer to look just like conduction.
The same can happen with oceans, although the density changes with temperature and the stability considerations for turbulence are not the same. Oceans also add salinity, which affects density and motion.
[And this is the sort of detail that Roger Pielke Sr. seems to be unable to understand... which is why I said earlier that he didn't seem to know what he was talking about]
-
vrooomie at 02:28 AM on 28 March 2013A Detailed Look at Renewable Baseload Energy
JvD, re: your dogmatic statement of "inexhaustible suppleis of uranium and thorium fuel:" 9ref. Comment #361.)
They may well be immense, but do they measure in the "trillions of tonnes?" I'd appreciate hard, known data supporting that number.
This link shows on the order of 5.5 BILION tonnes of known U235 reserves, FAR away from your asserted "trillions of tonnes."
http://www.world-nuclear.org/info/Nuclear-Fuel-Cycle/Uranium-Resources/Supply-of-Uranium/#.UVMczBzOuuI
-
EliRabett at 02:02 AM on 28 March 2013The two epochs of Marcott and the Wheelchair
As Eli has been pointing out, the uptick at the end of Marcott to the Wheelchair, (new version here) is about as relevant as the proxy reconstructed part of the Hockey stick. They are both covered by the instrumental record, which is reliable and the CMIP5 models.
-
Bob Lacatena at 01:34 AM on 28 March 2013The Big Picture (2010 version)
Oh, and somewhere in there, find time to study the carbon cycle, although at this point, anyone who disputes the anthropogenic origins of increased CO2 is really in total and complete denial. It's the most glaring and inarguable fact there is.
-
Bob Lacatena at 01:32 AM on 28 March 2013The Big Picture (2010 version)
tcflood,
As John H has said, you've been given a lot to pursue, but if you are a trained chemist, then you should have the capacity and the interest to do the following, and I would highly recommend it:
1) Completely restrain from making any judgment
2) At least peruse Spencer Weart's The Discovery of Global Warming to understand how deep climate science is (it is not young or immature).
2) Study the physics at the molecular level (vibrational modes of CO2, CH4, H2O, chemical and radiative interactions, etc.)
3) Study the physics at the atmospheric level (concentrations, chemical reactions, energy and content transport mechanisms, etc.)
4) Study the observational science, including: (a) paleoclimate methods such as O18, ice cores, ocean sediments, (b) how satellite and radiosonde measurements are done, and introduce error, (c) how ground observations are done
5) With that foundation in the physics and chemistry, study the impact of the oceans, including currents, heat transfer and chemistry (acidity), and physically constrained, large scale "oscillations" (like ENSO, PDO, etc.).
6) With that foundation in the complete climate system physics and chemistry, study the feedback mechanisms (methane release, ecosystem changes, ice/albedo changes, Hadley Cell expansion, H2O and clouds, etc.)
7) With that foundation in the physics and feedbacks, study the ice ages, what we know, and what we guess and why. Be sure to search for and look at actual scientific papers, not just summaries and encyclopdic articles.
8) With that foundation in the climate system physics, study the climate models themselves (there is a wealth of information available) in detail, to see how they incorporate the physics, how the allow for "unknowns", how they compensate for uncertainty, etc. to accurately model the earth climate over various time scales.
9) With that foundation in the full body of knowledge about climate science -- while recognizing that you have only touched the surface of these many branches, while there are thousands of expert scientists, like yourself, trained in far, far, far more detail in each of them -- go back and look at your own questions, and decide for yourself if they are (a) naive, (b) ill-phrased, and (c) easily answered, once you know what we actually know about the physics, and how each aspect of the physics and other knowledge builds upon the foundations.
-
John Hartz at 01:07 AM on 28 March 2013The Big Picture (2010 version)
@Everyone:
We have collectively given tcflood enough homeowork to sink a battleship. Please resist the urge to give him more. He/she is very polite and is open to learning more about climate science and related matters.
-
Tom Dayton at 00:14 AM on 28 March 2013The Big Picture (2010 version)
tcflood, as an augmentation to the list of successful predictions that JasonB gave you, you might watch Ray Pierrehumbert's 2012 AGU lecture on successful (and unsuccesful) predictions; the Cliff Notes of that lecture have been typed up by Steve Easterbrook. For more details, read science historian Spencer Weart's "Discovery of Global Warming."
I suspect your uncertainty about the uncertainty of climate models comes partly from your suspicion that the innards of those models are so complicated that nobody really knows how they work. So you should note that the list of successful predictions includes the most important ones having been made before those fancy computer models existed--all the way back to the 1800s. The early and successful projections were made decades before it was technically even possible to measure global temperature, so most definitely climatologists have not been merely modeling to match existing global temperature observations. Instead, they model with fundamental, empirically supported, physics; they set up the Earth, then turn on the Sun and let the system evolve.
The fanciness in the models merely fine tunes the simple and robust projections. Sufficiently scary projections can be made by hand calculating--as they were done before computers existed--and even many of the refinements can be done quickly with merely a spreadsheet to prevent hand cramps from penciling it all out. Just two examples are Tamino's "Not Computer Models" and its followup "Once is Not Enough". For more examples, borrow or buy the short textbook by David Archer, "Global Warming: Understanding the Forecast". To accompany or replace that book, you can watch David's U. of Chicago class lectures for free. An explanation of models is summarized in a small set of short videos by the National Academy of Science.
In case you've been reading blog gossip about climate models' computer code being of poor quality, you should read Steve Easterbook's excellent posts.
-
Alexandre at 23:17 PM on 27 March 2013Recursive Fury: Facts and misrepresentations
Sphaerica at 02:29 AM on 27 March, 2013
'nuff said.
-
Lanfear at 22:50 PM on 27 March 2013Most of the last 10,000 years were warmer
AWS - Automated Weather Station. More information is in the last link of my message @20.
-
CBDunkerson at 21:08 PM on 27 March 2013A Detailed Look at Renewable Baseload Energy
JvD wrote: Oh dear, another group of top experts - the PRESIDENT’S COUNCIL OF ADVISORS ON SCIENCE AND TECHNOLOGY - concluding the opposite from SkS:
"Achieving low-carbon goals without a substantial contribution from nuclear power is possible, but extremely difficult."
We interrupt the ongoing crazy for a brief reality check.
The SkS position, as described in the post above, is that renewable energy sources can be used to produce substantial baseload power. Your position is that they cannot and that nuclear must be used to reduce CO2 emissions. The quotation you supplied states that renewables can be used, albeit with difficulty, to achieve low carbon goals without nuclear. Which agrees with the SkS position... and directly contradicts yours.
Thank you. We now return to your regularly scheduled irrational nonsense.
-
JvD at 20:07 PM on 27 March 2013A Detailed Look at Renewable Baseload Energy
Michael Sweet. If I have alienated anyone, I am sorry for that. I guess I am simply following Dr. Hansens advice to start getting fed-up with people who like to impose their will on everybody else, endangering the planet.
Besides, I will turn your argument around and state frankly that you alienate me. I've been reading most of your comments on this thread, and you have been repeaing almost every anti-nuclear myth out there, even after other commenters and myself have given you the evidence that shows you are wrong. Now who's alienating who?
Finally, I hope that anyone who feels alienated by me uses the energy that that gives to look hard for evidence that destroys the credibility of my position, because by doing that you will learn infinitely more about the subject matter than simply relying an the assertations and opinion expressed by the anti-nuclear advocates who are active on SkS.
Learning about inconvenient truths and exposing one's one indoctrination is always a painfull proces. But it must be gone through. I hope people don't project the shagrin caused by exposing one's own indoctrination onto me.
Moderator Response: [JH]You are skating on the thin ice of sloganeering. Please cease and desist or face the consequences. -
JvD at 20:01 PM on 27 March 2013A Detailed Look at Renewable Baseload Energy
KR: "In the meantime, crusading for a single black/white all/nothing solution, attacking other approaches with a blind eye to your own, is not going to be a useful part of the discussion - it's a False Dichotomy fallacy. We have to consider and perhaps implement all options, while being realistic about which issues are myths, and which are real and significant. "
You'll note in my comments that I am not against solar and wind power, or any other low-co2 energy source. The false dichotomy you are presenting is ... false!
-
michael sweet at 19:59 PM on 27 March 2013A Detailed Look at Renewable Baseload Energy
JvD,
As you have pointed out several times, the IPCC has supported the use of renewables for generation of power. By definition, the IPCC position is the consensus scientific position. You are simply wrong when you claim that your position is the only scientific one. You have ignored the problems that nuclear has and alienated people, like me, who would support nuclear if a suitable argument was presented. You have damaged the nuclear position at this web site by your extreme views and wild claims. I am much more skeptical of nuclear after this exchange with you than I was before. I suggest you work on your message or you will not convince anyone.
SkS is a site where the science of climate change is discussed. The solutions are mentioned but are not the main goal here. SkS is not going to take an official position on nuclear either way. You have hijacked this forum for the past week. You appear to me to have alienated more people than you have convinced. No-one has supported your position. At least three posters have stated that your style alienates them. Why don't you take your positions to a site where it is more appropriate to discuss nuclear as long as you like? At Real Climate they do not allow nuclear to be discussed because of people like you.
-
JvD at 19:14 PM on 27 March 2013A Detailed Look at Renewable Baseload Energy
Here is a letter sent by Hansen to Obama. Further evidence that SkS is in urgent need of overhauling it's contrarian position on energy matters:
===
"It would be great if energy efficiency, renewable energies, and an improved (”smart”) electric grid could satisfy all energy needs. However, the future of our children should not rest on that gamble. The danger is that the minority of vehement antinuclear “environmentalists” could cause development of advanced safe nuclear power to be slowed such that utilities are forced to continue coal-burning in order to keep the lights on. That is a prescription for disaster.
"There is no need for a decision to deploy nuclear power on a large scale. What is needed is rapid development of the potential, including prototypes, so that options are available. We have to avoid a “FutureGen” sort of drag-out. It seems to me that it is time to get fed-up with those people who think they can impose their will on everybody, and all the consequences that might imply for the planet, by putting this R&D on a slow boat to nowhere instead of on the fast-track that it deserves.”
-
JvD at 18:34 PM on 27 March 2013A Detailed Look at Renewable Baseload Energy
Nuclear power is critical if we want to have any hope of ameliorating AGW, because intermittent renewables cannot provide more than a minor fraction of electricity needs, let alone energy needs, and no baseload power. The latest comments above continue to deny this. It is certainly not up to me to support my position - which is the consensus position. It is up to you - and SkS - to prove that you are right, which is the contrarian position. I've given ample evidence, which has been roundly ignored here. That is a great pity IMO.
Perhaps while you are busy collecting credible evidence for your unsupported position about the ability of intermittent renewables to work without nuclear power or other baseload sources, you will also tell Dr. James Hansen that he is wrong. After all: James Hansen is firmly on my side of the line separating fact from fiction. This is what Dr. Hansen has to say on the subject:
====
"We should undertake urgent focused research and development programs in next generation nuclear power," said atmospheric physicist James Hansen, head of NASA's Goddard Institute for Space Studies and adjunct professor at Columbia University's Earth Institute in New York.
While renewable energies such as solar and wind were gaining in economic competition with coal-fired plants, Professor Hansen said they wouldn't be able to provide baseload power for years to come.
Even in Germany, which pushed renewables heavily, they generated only 7 per cent of the nation's power.
"It's just too expensive," said Professor Hansen, an expert in climate modelling, planetary atmospheres and the Earth's climate.
-
Glenn Tamblyn at 16:17 PM on 27 March 2013New Research Confirms Global Warming Has Accelerated
bjchip
Further to Rob P's comment, some thoughts.
Winds can be part of what drives the gyres, just as blowing on water can move it. So changes in any of the regular winds such as the trade winds can potentially change the speed of a gyre. Any circular water flow will tend to push water in towards it's center - sea levels are higher at the centre of the gyres as a result. If water is being pushed towards the centre it has to go somewhere and down is the only option. So a gyre can create a downwelling at its centre. Change the speed of the gyre and you would change the speed of the downwelling, and thus the amount of heat carried with it.
-
Glenn Tamblyn at 16:02 PM on 27 March 2013New Research Confirms Global Warming Has Accelerated
Craig @31
"...surely ultimately the two pools would be at the same level...". Yes, but the ultimately is the time lag. In the shorter term they aren't.
Prev 928 929 930 931 932 933 934 935 936 937 938 939 940 941 942 943 Next


