


 Arguments


Recent Comments
Prev 935 936 937 938 939 940 941 942 943 944 945 946 947 948 949 950 Next
Comments 47101 to 47150:
-
jyushchyshyn at 10:08 AM on 22 March 20132013 SkS News Bulletin #4: Alberta Tar Sands and Keystone XL Pipeline
How can I even respond to all this without knowing that my comments will be deleted?
Moderator Response: [DB] Do as bill advises below: consult the Comments Policy, take it to heart and always compose your comments to comply with it. You will then have no issues with moderation, as similarly do the vast majority of participants in this venue. -
Klapper at 09:50 AM on 22 March 2013It warmed before 1940 when CO2 was low
@Scaddenp #10:
Exactly. My crude reconstruction of TSI (albeit based on a good correlation between ACRIM and smoothed SSN) shows that the lower end of the TSI estimate discussed in the post above is more likely to be correct. Here's the quote from this post on TSI:
"As you can see, in the early 20th Century, from about 1900 to 1940 there was an increase in TSI from about 1365.5 to 1366 Wm-2"
My estimate for delta TSI from 1900 to 1940 is 0.36W/m2. Just round it off to 0.4W/m2. This posts starts out by saying the increase is 0.5W/m2, but because there have been higher estimates, ups that to 1W/m2 delta TSI, without justification in my mind.
Let's summarize what I think we agree on for this period 1910 to 1945:
1. We agree the CO2 forcing results in approximately 0.15C warming
2. We agree that the cooling effect from aerosols trends is low
3. We agree the period is long enough to detect the climate signal
4. We agree the observations are coherent from dataset to dataset and the warming over this period is SAT is approximately 0.5C
5. We agree the error in the observed warming is approximately +/-0.14C
If the above 5 points are true then we just have one major point to agree on: delta TSI. Of course these are back of the envelope calculations but that's the starting point of this post in the first place. My real point is that I think you have a problem with your models in this period, which is a good one to evaluate as I've discussed above and it's not enough to just say it's within the margin of error and call it a day.
-
Klapper at 09:20 AM on 22 March 2013It warmed before 1940 when CO2 was low
@Tom Curtis #9:
Actually I'm talking about the 1910 to 1945 period. I tried to reset my period to match the discussion by SKS in this post, which was probably a mistake. See my all my comments over at another thread:
http://www.skepticalscience.com/jones-2013-attribution.html
(-snip-). Read my other posts on aerosols since I agree with you that aerosol component had low leverage in the 1910 to 1945 period. I checked the trend calculation also from 1915 to 1945 since that avoids the effects of the Katmai eruption at the beginning of the period. It doesn't really change much from trends calculated for SAT in the 1910 to 1945 period; the numbers to 2 significant digits are between 0.15 and 0.14C/decade.
As for the point on solar minimums, 1910 is a solar minimum and so is 1945, so I'm including 3 complete solar cycles in my solar analysis, which is another advantage to analyzing this period (along with minimal aerosol input). If you wanted to be nitpicky, the trend 1912 or 1913 to 1945 would be a better one to evaluate since it's more "perfect" in isolating the solar cycles to complete ones, but as I've noted the 1915 to 1945 trend is really no different than the 1910 to 1945 one in the observations.
Actually, although my most recent comment sets aerosol cooling to zero, we should be careful about minimizing aerosol leverage in this time period. While it is true there was only one major volcanic episode, the anthropogenic component was more coal, less oil (hence more sulfur dioxide), plus emission controls were nil in that period. Total fossil fuel consumption in the period 1910 to 1945 was about 1/4 to 1/5 the consumption rate from 1970 to 2000, but it was pretty dirty. I'm only saying this to note I know the anthropogenic aerosols from this period can't be directly compared to the emission rate per fossil fuel input as later in the 20th century.
In the end the 1910 to 1945 period is a good period to check your climate sensitivity for the following reasons:
1. We have reasonable low error limits on CO2 growth
2. We have poor direct information on aerosols, but the fossil fuel consumption rate is low, and there is only one major volcanic episode, so we can assume aerosol cooling is not significant.
3. We have good correlation of the three observational SAT datasets
4. The period includes complete solar cycles (and I would argue we have reasonable reconstructions of TSI but that may be a point of argument for some).
In short, what's not to like about 1910 to 1945?
Moderator Response: [DB] Moderation kvetching snipped. -
scaddenp at 07:56 AM on 22 March 2013It warmed before 1940 when CO2 was low
Klapper, can see if I have the argument right?
Observed warming is consistant with published model hindcasts for this period (especially when difficulties with forcing estimation is accounted for).
However you are discounting this because the forcing that the models use do not match your own fairly crude estimates of forcings which you prefer to estimates based on published papers?
Is this a fair summary? If so then I think you should presenting direct critique of relevent forcing papers, outlining where you think they have overlooked or made errors.
-
Tom Curtis at 07:47 AM on 22 March 2013It warmed before 1940 when CO2 was low
Klapper @8,
1) What is missing from your argument above is stratospheric aerosols from volcanoes (B in the graph below):

The distinct lack of major volcanism between 1915 and 1960 is a major factor in the rapid warming in the early twentieth century.
2) Your trend calculation ignores that 1910 was very close to a solar minimum while 1940 is close to a solar maximum. Simply taking the trend while ignoring the difference in the position in the solar cycle underestimates by about half the change in TSI between the two periods.
-
Dumb Scientist at 06:13 AM on 22 March 2013Tung and Zhou circularly blame ~40% of global warming on regional warming
I'm sorry, I don't understand why you object to Tung and Zhou 2013 assessement. Taking the temperature of the earth in 1910 and 2013 and joining the dots, we get a total temperature rise of 0.8°C, as confirmed by the Hadcrut 4 Global Mean temperature. Isn't that an average of 0.08°C per decade? Isn’t that what the IPCC claims is the extent of Global Warming? [Watson]
The IPCC and virtually all scientists agree that the Earth's surface has warmed by ~0.8°C since 1900. However, Tung and Zhou call this anthropogenic warming and claim that it's been steady before and after 1950. That's just unphysical, because our radiative forcings spiked after 1950. As I explained, this circular conclusion is actually a result of their assumption that they could subtract the AMO without subtracting anthropogenic warming signal after 1950.
Meanwhile, the extended period of cooling by almost 0.3°C from 1880 to 1910 has never been explained by conventional climate science. CO2 didn't rise much in that period, but it definitely didn't fall, and yet the temperature declined for 30 years! You might like to offer that explanation today.
Whack-a-mole time. When Judith Curry made a similar argument regarding 1910-1940, Gavin replied:
"Your statement is equivalent to stating that we can't find someone guilty of a crime today because some other cases in the past are still unsolved. It is a non sequitur. It is precisely because we have more information about changes today than we have about changes longer ago that attribution gets easier. We know for the recent period that ocean heat content went up, not down. We don't know that for 1910-1940. We know for the recent period that the stratosphere has been cooling. We don't know that for 1910-1940. We know for the recent period that solar has been flat. We don't know that for 1910-1940. Etc. ...
You appear to be demanding a level of certainty about 1910-1940 that doesn't exist before you will accept the level of certainty about recent trends that does. I fail to see how that makes sense. Each attribution problem is unique, and while the same techniques can be used , and the same logic applies, the answer, or even whether an answer can be sensibly given depends entirely on the specifics of the case." [Gavin Schmidt]
After 1940 there is another AMO explicable cooling phase that is always explained away by a magical process involving the increase in light reflecting aerosols. ...
Your numerous uncited claims seem to be aimed at someone who disputes the existence of natural multidecadal variability. But as I wrote to a colleague, I just object to Tung and Zhou's assumption that detrending the AMO removes the nonlinear anthropogenic trend, which led them to unknowingly subtract signal after 1950.
I also mentioned multidecadal variability in a comment on the webpage associated with the video in this article. Kevin C's response doesn't involve anthropogenic aerosols and suggests that contributions from multidecadal oscillations are small, and so do other analyses. In the original version of this article I also referenced Isaac Held's analyses of internal variability, which are highly recommended.
-
Tung and Zhou circularly blame ~40% of global warming on regional warming
Tamino has examined the AMO data several times, and in this post he states:
I regressed global temperature on AMO, and of course I get a strong correlation (nobody disputes they're correlated, but causation can go either way). I also allowed for lag in the impact of AMO. The best-fit lag for AMO was -3 months. Yes, negative -- suggesting that global temperature is cause, not effect.
I also regressed global temperature on AMO and a time trend. This time the best-fit lag was -2 months. Again negative.
I even detrended both global temperature and AMO nonlinearly (with a "slow" lowess smooth) and repeated the regression, to see whether AMO might at least account for some of the short-term fluctuations (just as ENSO does). Again the best-fit lag was -2 months. Which again suggests that global temperature is partially the cause, even of the short-term fluctuations in AMO, not the other way around.
[Emphasis added]
Cause precedes effect - and global temperature changes precede the AMO. Tung & Zhou in their analysis are removing a significant portion of the global warming from the global warming, artificially decreasing the trends. It's an easy mistake to make in MLR, but it is still a mistake.
-
ubrew12 at 04:35 AM on 22 March 2013Tung and Zhou circularly blame ~40% of global warming on regional warming
Article: "The... AMO... is a long-term fluctuation in N. Atlantic sea surface temperatures" Sea SURFACE temperatures. Why would such temperatures NOT reflect the global surface temperature trend? Indeed, as the article states: "...anthropogenic global warming can increase the AMO index. This means subtracting it potentially ignores AGW." In like manner, if I believe that the urban heat island effect is responsible for AGW, why can't I just subtract the urban temperature profile from the global surface temperature record and 'whalla', problem solved. ENSO at least says something PHYSICAL about how heat is being entrained in the deep ocean: a La Nina ought to anchor global surface temperatures to the deep ocean and cool it. What a surprise: it does! But if you google 'noaa ocean heat and salt content' and compare the first two graphs ("0-700m global ocean heat content" versus "0-2000m global ocean heat content") you will see that the sea SURFACE temperature is much more reflective of what is going on in the atmosphere than the oceans depths. Hence, subtracting one from the other is a bit like subtracting one from itself: you end up with zero (rate of change) which, quelle surpise, is what Tung and Zhou ended up with.
-
Klapper at 04:34 AM on 22 March 2013It warmed before 1940 when CO2 was low
@Bob Loblaw #39:
I made a few mistakes in my regression of TSI vs SSN. The 0.80 R-squared is from the ACRIM TSI dataset (not PMOD) vs the smoothed SSN (not raw SSN). Plus as stated I used post 1992 data to avoid the "ACRIM gap" issue. For comparison the post 2003 TIM TSI dataset shows an R-squared of .73 when regressed against the smoothed SSN. Standard error on ACRIM TSI vs Smoothed SSN regression is 0.21 W/m2. All of these numbers from monthly average datasets.
Moving on I created my own TSI reconstruction from the regression formula (0.0109x+1360.9), and looked for the TSI trend in the period of interest. Regression trends from psuedo-wave functions like SSN are tricky, your period should go from peak to peak or trough to trough, anything else introduces a bias. So I calculated the trend from 1902 to 1954 to straddle my area of interest. The slope is .09W/m2/decade, which would work out to an approximate change of 0.36W/m2 in TSI from 1900 to 1940. Note that above the discussion starts by quoting an approximate increase in this period of about 0.5W/m2 in TSI, so my TSI reconstruction number is lower but in the ballpark.
Using the method above, but my delta TSI for 1910 to 1945 (about 0.3W/m2), the temperature increase from the TSI change is about 0.05C, or 1/2 to 1/3 of the number above.
Let's say we agree on the Skeptical Science CO2 calculation above (0.15C increase from CO2 alone). Let's also say my calculation on TSI is correct (0.05C). Let's also say the contribution from aerosols is zero (it should be some small negative number since they were increasing, and the net effect of aerosols is cooling, but we'll ignore for this analysis).
Add the TSI/CO2 change up and you have a global SAT increase of 0.2C in the period 1910 to 1945. However, the observed change is close to 0.5C in this period. Say the error on CO2 is +/- .04C, and the error on TSI is +/- .05C. The maximum temperature change is about (0.19+.10) 0.3C. Still not close to the actual of 0.5C. Thats assuming the aerosol impact is zero, but it's not. It's cooling, thereby dragging the model number lower than my 0.2 to 0.3C model increase calculation.
My argument is that despite the presentation above, you cannot account for the rapid increase in temperature from 1910 to 1945 using only TSI and CO2 and aerosol inputs. There is some other factor at play missed by the models. Obviously the main disagreement between myself and the above Skeptical Science calculation is the TSI input, but after doing my own reconstruction based on a very good correlation between ACRIM and SSN (smoothed), I think the 1W/m2 delta TSI in this period is just too high.
-
DSL at 04:30 AM on 22 March 2013Tung and Zhou circularly blame ~40% of global warming on regional warming
I don't think AMO has ever definitively been shown to be anything other than SST response to surface warming. AMO lags surface temp by, at least and at most, a few weeks, IIRC.
-
MA Rodger at 04:28 AM on 22 March 2013Tung and Zhou circularly blame ~40% of global warming on regional warming
It is rather telling that Tung & Zhou 2013 is so shy at presenting the actual CET data. The global data over the latter half of the analysis period is shown but no CET. Indeed, the peaks (or rises) they show at 1780 & 1840 do not exist outside their heavily smoothed frequency analysis. Once their analysis is shorn of this fantasy, is this any more than a sophisticated version of the drivel Akasofu produced a few years back?
-
Marco at 04:15 AM on 22 March 2013David Rose Hides the Rise in Global Warming
funglestrumpet, I sincerely hope you do not want to present the Architects and Engineers 911 Truth organisation as anything worth emulating. They're not. They are conspiracy nutters using appeals to authority. It's like the faux sceptics using their PhDs to claim their opinion about climate science carries weight.
-
Bob Loblaw at 04:14 AM on 22 March 2013How Increasing Carbon Dioxide Heats The Ocean
Hmmm. While preparing what now appears as #53, I think some pruning of Kevin's sloganeering (and responses to it) may have occurred, as suddenly there are several missing comments.
-
Bob Loblaw at 04:11 AM on 22 March 2013How Increasing Carbon Dioxide Heats The Ocean
I'm hesitant to weigh in on this, as poor Kevin may well feel that there is dog-piling going on, but I wish to address a phrase of Kevin's that KR has already commented on in #58, regarding the air a water being at the same temperature. KR points out that the water and air are not at the same temperature, but a key element I think frames why Kevin is leading himself astray at this point:
1) at the surface, which separates the water and the air, there is only one temperature, and this surface temperature will be the same regardless of whether you are looking at it from the perspective of the water or the air. This may be what Kevin has in mind whe he says the water and the air are at the same temperature.
2) The surface isn't water, and the surface isn't air. The surface is the plane between the two. The water is below the surface, and the air is above the surface. The fact that the water and the air share the same temperature at the surface does not mean that the water below and the air above are at the same temperature. Thus, KR is right.
3) Saying that the water and air are at "the same temperature", and restricting the statement to the surface, is as useful as saying "the air temperature at 2m is the same as the air temperature at 2m". It essentially means nothing - except that a graph of temperature through that point will not have a sudden jump or discontinuity. What matters is the gradients, and calculus tells us that lines can have gradients (slopes) at a sinlge point (i.e., we don't need two points to calculate a slope), and that tells us that gradients can exist at the surface. So again, KR is right: there are gradients at the surface.
(As an aside, chances are that the gradient in the water and the gradient in the air close to the surface will not be the same, so a plot of gradient versus height/depth likely will have a discontinuity. This is not a mathematical difficulty, and arises from consideration of all the energy flows towards and away from the surface,)
And Kevin: this is not a personal attack, but an evaluation of what I see from what you write here - I agree with Tom Curtis that your level of understanding leaves you ill-equipped in this discussion. You have fundamental misunderstandings that you need to unlearn before you can provide constructive analysis of what is being said to you.
-
michaelbassey at 04:00 AM on 22 March 2013David Rose Hides the Rise in Global Warming
- Last June I made a submission to the Leveson Inquiry which I entitled ‘The press should speak truth to the people so that the people can speak sense to power’.
- This is an extract relevant to this discussion:
- “PRESS REPORTS ON GLOBAL WARMING JANUARY TO JUNE 2012 Using an iPad to search for items on global warming in the eight major national daily newspapers published in England I have identified 76 items of news and comment over the period 1 January to 25 June 2012. …
- “In summary, the Daily Telegraph (0.7 million readers), the Daily Express (0.7 million readers) and most of the time the Daily Mail (2.1 million readers) reject the scientific evidence that gives a high probability to the Earth warming up due to human activity in releasing greenhouse gases; the Sun (3 million readers) and the Daily Mirror (1.2 million readers) are not concerned; while the Times (0.5 million readers), the Independent (0.2 million readers), and the Guardian (0.3 million readers) are committed to giving their readers the latest evidence and pertinent comment on man-made global warming leading to climate change.
- “That adds up to 3.5 million readers exposed to rejection of ‘human responsibility’, 4.2 million unaware from their newspaper reading, and 1.0 million given the scientific viewpoint. Or as percentages of the presumed daily readership: rejection 40%, unaware 48% and acceptance 12%.”
- It shows why journalists like David Rose and James Delingpole, with potential audiences of 31/2 million readers endanger us all.
Michael Bassey
-
Hyperactive Hydrologist at 03:26 AM on 22 March 2013Tung and Zhou circularly blame ~40% of global warming on regional warming
This might be a stupid question but does the AMO not just act a heat sink during cold phases?
-
Tom Curtis at 00:53 AM on 22 March 2013How Increasing Carbon Dioxide Heats The Ocean
trunkmonkey @55, got it. Your argument is that you will ignore data you find inconvenient.
-
Tom Curtis at 22:18 PM on 21 March 2013How Increasing Carbon Dioxide Heats The Ocean
trunkmonkey @50 would like an explanation as to why the Indian, North Atlantic and Arctic are warming, while "All the other oceans are flat or cooling". I can offer no explanation for his claim is simply false:

As can easilly be seen, the South Atlantic, South Indian, and North and South Pacific are all warming quite strongly. Of course, Levitus et al (2012), the source of the graph, just divide the worlds oceans up into three oceans, so that the Southern Indian, Southern Atlantic and Southern Pacific oceans by their division includes the Southern Ocean. Perhaps it is flat or cooling?:
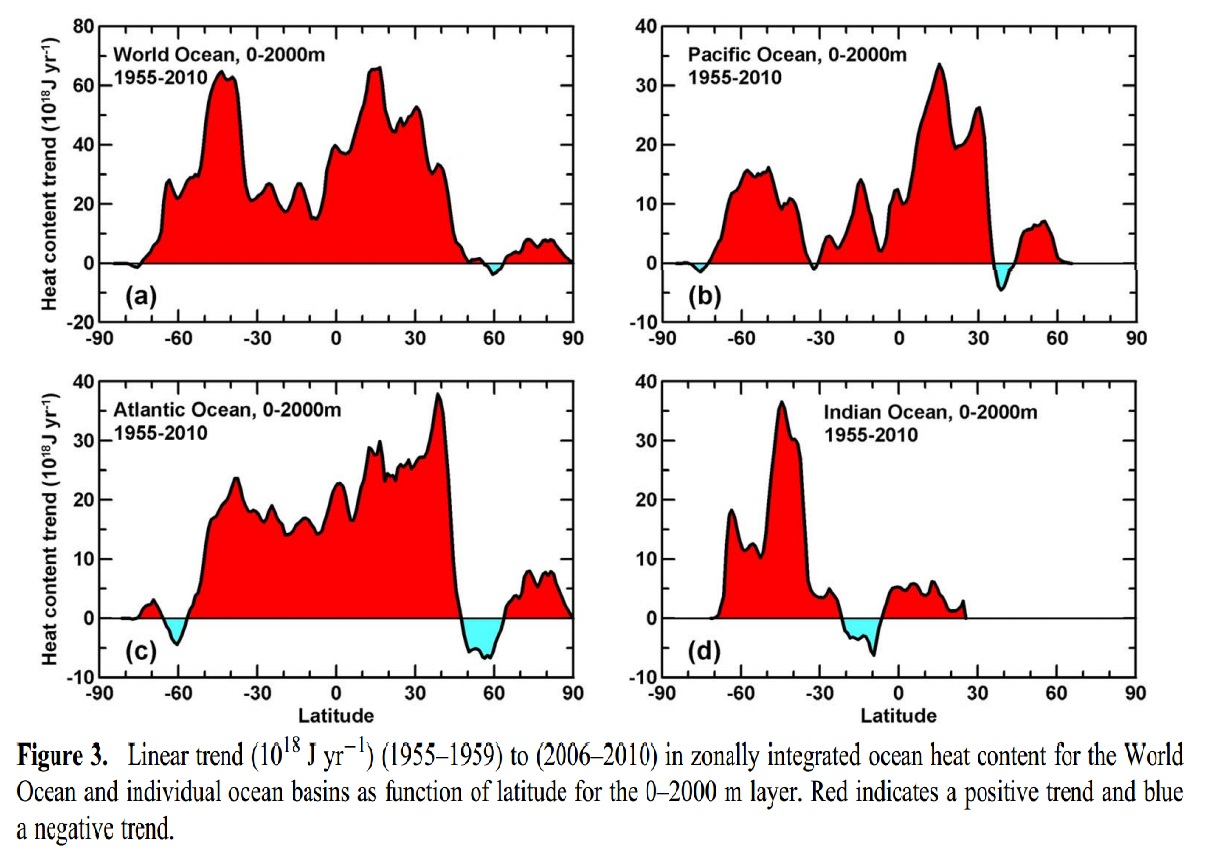
trunkmonkey, it appears, wants to claim falsehoods, and then fault climate science for not explaining why those falsehoods are true. No doubt he will next disprove climate science by pointing out, quite correctly, that it has no explanation as to why the moon is made of green chease.
-
Watson at 21:45 PM on 21 March 2013Tung and Zhou circularly blame ~40% of global warming on regional warming
I'm sorry, I don't understand why you object to Tung and Zhou 2013 assessement. Taking the temperature of the earth in 1910 and 2013 and joining the dots, we get a total temperature rise of 0.8o C, as confirmed by the Hadcrut 4 Global Mean temperature. Isn't that an average of 0.08o C per decade? Isn’t that what the IPCC claims is the extent of Global Warming?
Some of us have been observing the AMO effect for years, noting the almost perfect coincidence between a plot of the peaks of the 'apparent' AMO cycle, as reflected in the Southern Hemisphere temperature peaks circa 1880,1940, and 2000 and the steady rise in concentration of CO2 in the atmosphere.
If the CO2 curve is extended with ice core data, the rise in the peaks follows the carbon dioxide rise for 160 years. Meanwhile, the extended period of cooling by almost 0.3oC from 1880 to 1910 has never been explained by conventional climate science. CO2 didn't rise much in that period, but it definitely didn't fall, and yet the temperature declined for 30 years! You might like to offer that explanation today.
After 1940 there is another AMO explicable cooling phase that is always explained away by a magical process involving the increase in light reflecting aerosols. But that explanation is deeply flawed for two reasons. One, the major global cooling in the Southern Hemisphere during the period 1940-1960 takes place in the early part of the period before the aerosol build up, which according to the theory, mostly affected the industrialized Northern Hemisphere. Secondly it magically reverses the cooling trend moment clean air legislation to reduce SO2 emissions is passed, despite the fact that the SO2 emissions have fallen only slowly.
That sudden temperature rise, especially in the Northern Hemisphere, corresponds not to aerosol effects but the return of the warming phase of the AMO, a cycle that began in the Southern hemisphere in the 50s. Since 2000 the Southern hemisphere has shown some slowing in cooling followed by the Northern Hemisphere. This is exactly the same hemispheric pattern that occurred during the 40s and 50s and again in the period 1880, 1905. All the evidence is there to explain why there has been a slowing in global warming over the past decade or so, pointing to a return to rapid waming by 2020 at the latest.
What I can't understand is, why, if as this analysis shows, the AMO makes no difference to the fact that real global warming is being driven by CO2, and it is clearly accelerating alarmingly, why not tell the full story?
Moderator Response: [RH] Fixed links that were breaking page formatting. -
CBDunkerson at 20:52 PM on 21 March 2013A Detailed Look at Renewable Baseload Energy
So... extracting uranium from the oceans is a feasible plan, but storing wind and solar power for later use is not.
Right, we've crossed the 'five fold crazy' line. I'm done here.
-
Tom Curtis at 19:35 PM on 21 March 2013Most of the last 10,000 years were warmer
Lanfear @20, the GRIP and GISP2 icecores where both drilled at the Summit. Hence the difference in temperature as measured at GRIP is a reasonable proxie for the difference at GISP2.
Your chart shows the difference between the absolute temperature in 1895 as measured using the GISP2 ice core proxy, and the absolute temperature as measured at a nearby location using the thermometers in the 2000s, ie, the difference between the end of the GISP2 icecore and the higher of the two blue crosses in last graph in the original post. However, as can be seen in the second last graph, GISP2 temperatures are cold relative to GRIP site temperatures in 1895, so it is far better to take the anomaly as is done in the OP or in the second graph @15. Even that should be taken as indicative only, rather than an exact measure.
-
Lanfear at 19:14 PM on 21 March 2013Most of the last 10,000 years were warmer
Here is my very crude attempt to recreate the graph to modern times, and I would very much like to hear what mistakes I have done along the way.
FWIW I'm not a scientist, so there...
Anyway, the reason for my effort is that I have for some time been a bit annoyed that the current temperature (2009) grafted on the last graph in the text is not directly from the GISP/dome, rather it is derived from GRIP. This IMO makes it a bit weaker as a argument when presented to a layman/'skeptic' even if it does have a sound scientific methodology behind it.
So after some hunting I found some near surface temp measurements here; from the summit, which AFAIK is where GISP2 was drilled. The station numbers are documented here.
I threw the data in a spreadsheet and took the average from (after converting each timepoint to decimal) 2005.813 - 2011.813, which gave me -28.3°C. Incidently, and not necessarily meaningfully, the max temperature of the last 3 years are all above 0°C and 'rising'.
Anyhow. I take that average and add it as a data point in to the Alley record linked in the text as for 2008 and get the following graph:

The trend is for Alley data only (-9000 - 1880), just as reference.
I'm sure I have made some grave errors in the process, and would appreciate constructive input. Thanks.
-
trunkmonkey at 14:47 PM on 21 March 2013How Increasing Carbon Dioxide Heats The Ocean
On average the oceans are always warmer that the atmosphere and net transfer is skewed 14% from the oceans to the atmosphere. Theoretically the thermal mass of the atmosphere, if it were warming, would reduce the margin and warm the oceans. (snipped)
The oceans on average have continued to warm, quite a bit. This is really wierd. But what is even wierder is that all of the net ocean warming can be accounted for by the North Atlantic, the Indian, and the Arctic oceans. All the other oceans are flat or cooling.
So if you can explain to me how the atmosphere could cause these three oceans to warm and allow the rest to languish or cool, I would be very interested to hear it.
Moderator Response: (Rob P) - Sloganeering snipped. Do you have a reputable scientific link to back up your claim? I'm aware the the Pacific Ocean has not warmed in the last few years, but this is nothing new. It's happened many times before, each time followed by abrupt warming. The oceans are dynamic and shuffle a lot of heat around - even while the oceans are gaining heat though the greenhouse gas forcing of the cool-skin layer. There is no expectation that year-to-year warming is continuous because changes in ocean circulation, such as ENSO (La Nina/El Nino), can temporarily act against the long-term warming trend. Therefore, over short time frames, it can appear very noisy, but thus far, over longer (decadal) timescales, the warming pattern is smooth and incompatible with natural variation. See Sedlácek & Knutti (2012). -
Composer99 at 12:42 PM on 21 March 2013How Increasing Carbon Dioxide Heats The Ocean
Kevin, even with greater evaporation, when one considers all the energy fluxes into and out of the ocean cool skin layer, as long as the change in net energy flux causes the cool skin to warm, the temperature gradient between the cool skin layer and the bulk ocean below it will decrease.
Conduction from atmosphere to ocean is not the only (and I suspect not even the primary) manner by which energy transfers from the atmosphere into the ocean cool skin layer.
-
Magma at 12:14 PM on 21 March 2013Death in Jurassic Park: global warming and ocean anoxia
John, as a geoscientist that would certainly be my own preference. Nice job on the original post, by the way.
-
JasonB at 11:42 AM on 21 March 2013A Detailed Look at Renewable Baseload Energy
JvD,
How would you propose to solve the mismatch between supply (which is ideally constant at a high capacity factor) and demand (which fluctuates over a wide range) at high penetrations of nuclear power?
The places I've checked have a difference between minimum demand and maximum demand over the course of a year of about 2.5:1, and over the course of a day as much as 2:1.
If you want to use nuclear to meet peak demand, then the capacity factor will be much lower than 100% and the cost of the nuclear power will be much higher than advertised.
If you want to maintain close to 100% load then you either need to limit nuclear to about 40% penetration, in which case it's only ever one part of the solution, or you need to find useful things to do with the unused capacity, in which case I'd be interested in knowing why the same solutions wouldn't apply to intermittent renewables in an over-capacity situation.
The bottom line is that both intermittent renewables and nuclear power need to be coupled with some storage mechanism, albeit for different reasons. Neither are a good substitute for the current mix of low-cost baseload power plants coupled with higher-cost load-following and peaking power generators on their own and it's disingenuous to dismiss either simply on that basis because no technology scales up to 100% well, and that includes coal — otherwise we wouldn't have a mixture of technologies now!
Also, if you're going to use fast breeders to counter the claim that there are genuine and well-founded concerns about uranium supply, then you should also be up-front about the cost of electricity from those fast breeders and the current state of production readiness of the technology. Exactly how far away are we from large-scale rollout of fast breeders (especially given how far behind schedule and over budget the first two EPRs are, and they're conventional reactors!)? How much CO2 can be abated by continuing to build wind farms at the present rate in the meantime?
-
Doug Bostrom at 07:59 AM on 21 March 2013A Detailed Look at Renewable Baseload Energy
JVD: "In my country, advocates are advising we raise energy taxes on industry to pay for the production subsidies and other sustainability projects. This will move industry out of the country, since energy costs are easily 30% to 50% of total revenues for the largest energy users (chemistry and metalurgy). Fine factories, smelters and forges are already closing, citing energy costs and prospects. Where do these factories go?"
Adopting a blanket refusal to acknowledge human nature or the art of compromise or the difference between what ought to be and what is, as do you, a rejoinder equally as plausible as the nuclear panacea you offer would be to say, "Just make sure there are international agreements to prevent migration of economic activity to the least responsible host. Just make sure everybody behaves responsibly."
The problem is, even while having only four letters, "just" is too often a substitute for a reasoned, credible plan requiring much more thought, let alone wisdom.
Let's start with understanding the basics before we move to extract all the uranium from the world ocean. How do we keep rats out of the switchboards of nuclear power plants? More to the point, how do we account for the foible of human nature that means we overlook the possibility of a rat interrupting the primary flow of cooling water at a fission generation facility? If we have N nuclear facilities with X/N significantly affected by a rodent, how many facilities will be affected by the same general problem of failure of imagination if we multiply N by 10,000? What is X? How many collisions of an unimagined rat with a switchboard may we expect? How many plants will have inoperative backup power available, leading to some probablility of a collision between a wayward rat and yet another facet of human fallibility in the form of a disgruntled or simply incompetent employee?
So far, X as it is emerging doesn't look promising as a number when it comes to replacing all of our energy supplies with nuclear fission plants; with about 450 operating power generation plants attached to a record of 3 plants suffering failures of human nature leading to irreparable damage in at least one core, X isn't looking very attractive. Moving the present proportion of nuclear generation capacity against demand from about 6% to 100% would produce what number of failures over 40 years, in keeping with the actual record?
But perhaps we can change human nature. Or perhaps we can keep N to a number more in keeping with X.
-
Tom Curtis at 07:59 AM on 21 March 2013How Increasing Carbon Dioxide Heats The Ocean
Kevin @45:
1) If there is no increase in skin surface temperature, there is no increase in evaporation (by your argument), and hence no evaporative cooling. Therefore while an increase in evaporation may limit the increase in temperature (by your argument), it cannot prevent there being an increase.
2) In a confined volume, an increase in evaporation will result in an increased vapour pressure of H2O in the atmosphere above the water surface. The increased vapour pressure results in an increased frequency of water molecules in the amosphere striking the surface, and being absorbed, carrying there energy of motion into the water as heat. After warming stops, an equilibrium will be reached in which the frequency of water molecules entering the atmosphere from the liquid will equal the frequencey of molecules entering the liquid from the atmosphere resulting in an equilibrium of transfer of water molecules and (if atmosphere and liquid are the same temperature) of energy transfers.
If the atmosphere is warmer than the liquid, on average the energy transferred to the liquid by water molecules being absorbed will excede the energy transfer to the atmosphere by evaporation. Warming the atmosphere without warming the liquid will result in an increased energy transfer to the liquid by this means.
The Earth's atmosphere is slightly more complex. It is closed for practical purposes, but some of the water vapour in the atmosphere precipitates out. The increase in evaporative cooling with increased surface temperature is therefore limited by the increase in precipitation, not by the increase in sea surface temperature. As Kevin has shown nothing about how much precipitation will increase, his argument does not even get of the ground.
-
Leto at 07:54 AM on 21 March 2013How Increasing Carbon Dioxide Heats The Ocean
Kevin,
You wrote:
Since conductive heat transfer from gas to liquid is quite small, it is obvious that the increase in evaporative losses shall dominate.
Are you really trying to say that the dominant effect of a warmer atmosphere is to increase evaporation so much it cools the ocean? Or did I misread your post at #45?
-
Paul D at 07:06 AM on 21 March 2013David Rose Hides the Rise in Global Warming
Interesting twist that Myles Allen response in The Guardian.
I also think that if Rose is a neighbour, then Allen is being diplomatic.In any case, has Allen seen the attack Rose made in the follow up article?
Currently it is law that all local government councils in the UK must have one climate change officer, Rose was attacking this (amongst other things). In fact the follow up Rose article used FOI data which must have taken weeks/months to obtain. So Rose appers to have planned the 'attack' before speaking to Myles Allen. -
JvD at 06:46 AM on 21 March 2013A Detailed Look at Renewable Baseload Energy
"You argue that there is so much excess renewable power that it must regularly be given away to neighboring countries for free and that renewable power cannot be used to power various forms of energy storage facilities because they would frequently sit idle due to the lack of excess power."
No, I argue that if we try to go for a 100% intermittent fuel supply, we will probably fail in getting there, due to the cost.Additionally (and this gets my goat), it actually worsens the problems we are trying to solve. In my country, advocates are advising we raise energy taxes on industry to pay for the production subsidies and other sustainability projects. This will move industry out of the country, since energy costs are easily 30% to 50% of total revenues for the largest energy users (chemistry and metalurgy). Fine factories, smelters and forges are already closing, citing energy costs and prospects. Where do these factories go? (let alone the poor highly skilled workers, who are lamenting their years of investment in Best Practice industry practices. A kick to the teeth. Their craft will ikely move to coal burning giants. So much for good intentions.
Obviously, it seems, we should - if anything - seek to lower energy costs for energy intensive industries, bringing them into our countries so they abide by our environmental laws and efficiency standards. But this evidence is completely lost on popular sustainability guru's advising for more taxes on energy producing industries.
Nuclear power answers this problem. Nuclear power can power solar panel factories, electric car factories and wind turbine factories, serving the relatively minor demand from households in stride. Solar panels cannot, wind turbines cannot, and electric car batteries cannot do this. Not without grotesque energy storage facilities and legions of fossil fuels plant, burning their poison quietly on the side, more of it every year, while happily egging us on to simply 'believe in the possibility of a 100% fossil-free future'. The big joke is on us suckers, I argue.
Nuclear fuel is inexhaustible. The earth's crust contains hundreds of trillions of tons of uranium and thorium fuel. Enough to power thousands of GW of nuclear power plants for billions of years. Of course, we can only get at a small fraction of that vast radioactive source. There is 4 billion tons in the ocean we could extract at a cost that would factor negligably in the price of nuclear power. Enough to power the entire world economy five times over for tens of thousands of years. More than enough time to carefully build out what truly sustainable and cost effective renewable source we have, including fusion.
(Hopefully only very little 'bio-based' energy, which is overhyped and dangerous in worse ways than nuclear. And very inefficient. See Hartmut Michel http://www.treehugger.com/renewable-energy/all-biofuels-are-nonsense-says-nobel-winning-photosynthesis-expert-hartmut-michel.html.)
The myth about so-called 'uranium shortage' has to be put to rest and I argue that posting an article on SkS illuminating people on the basics of advanced nuclear energy would be a very good development.
http://www.mcgill.ca/files/gec3/NuclearFissionFuelisInexhaustibleIEEE.pdf -
Matt Fitzpatrick at 06:45 AM on 21 March 2013David Rose Hides the Rise in Global Warming
I'd argue it's a gallop all the way through. There's at least three unsubstantiated claims about climate science and policy in the headline alone.
Pieces like these read more like advertising than any real scientific endeavor. Kind of like the offers for cheap pharmaceuticals I get by email twenty times a day. The message never changes, but sometimes the volume does.
-
Neven at 06:10 AM on 21 March 2013David Rose Hides the Rise in Global Warming
The only thing I'm interested in is if, how and how much Rose is paid by the GWPF for his handiwork.
-
John Russell at 06:04 AM on 21 March 2013David Rose Hides the Rise in Global Warming
Just in case anyone missed the update (above) which we just added, the Mail on Sunday have now added these words (including the link) to the end of Rose's article...
"The original graph was produced by Dr Ed Hawkins, a senior research scientist at the National Centre for Atmospheric Science. Discussion of the graph and its meaning can be found on the website Climate Lab Book.
We apologise that this credit was initially missing."
Of course, they should have written, "The original graph which we plagiarised..." .
We understand from a tweet today by Tamsin Edwards of Bristol University that the Mail's footnote came about as a result of requests to David Rose by her and Ed Hawkins.
-
DSL at 04:28 AM on 21 March 2013How Increasing Carbon Dioxide Heats The Ocean
Kevin, have you been over to SoD on this subject?
-
Nick Palmer at 04:03 AM on 21 March 2013David Rose Hides the Rise in Global Warming
Funglestrumpet @18 "Surely, the opening sentence to this post: "It seems like we have to debunk this myth on a weekly basis" shows that a change of tack has at least to be considered"
The roots of this consistent denier/"sceptic" meme must be that the effects of increased CO2 have been consistently presented as X° C per decade which created a loophole for critics to pounce on every time the surface temperatures don't respond in such a linear way.
While the normal presentation of the expected cumulative heating of the total sytem is a scientifically "pure" parameter, when modelled projections are put to the public there strongly needs to be some way to better communicate that the cyclic non-cumulative variations (ENSO etc) are pretty large and can swamp the upward trend for a long time - like waves on a beach can swamp the incoming tide line.
I think the graphs from Foster and Rahmsdorf, which clearly show the underlying signal by subtracting natural variations, need massively greater exposure. Full page newpaper ads. 30 second TV infotainment ads. The more academic scientists, who are bad at adequately communicating the science to the public, need to be trained to use such aids when speaking to or being interviewed in public. The IPCC itself needs to feature them prominently, right up there in the summary for policy makers and not buried deep in some attribution study appendix.
-
Kevin8233 at 03:49 AM on 21 March 2013How Increasing Carbon Dioxide Heats The Ocean
I know that this thread is old, but some comments are still appropriate.
As I understand this article, the decrease in temp gradient in the cool skin layer is what allows increases in atmospheric CO2 concentrations to further warm the oceans.
This can only be possible if conductive warming of the cool skin layer from the ghg warmed air above can prevent more heat loss than an increase in evapoaration heat loss due to a ghg warmed atmosphere.
Greenhouse gases, such as carbon dioxide, trap heat in the atmosphere and direct part of this back toward the surface. This heat cannot penetrate into the ocean itself, but it does warm the cool skin layer, and the level of this warming ultimately controls the temperature gradient in the layer.
From other threads, it is known that the increase in evaporation heat losses is 4%. This is substantial. Since conductive heat transfer from gas to liquid is quite small, it is obvious that the increase in evaporative losses shall dominate.
Moderator Response: (Rob P) Note the experiment carried out by Professor Minnett which effectively debunks your claim - it is a central plank of the post. Also read Fairall (1996)- their observations & modelling demonstrated the the net effect of the cool-skin is to warm the ocean in the tropics. This is where the bulk of sunlight enters the ocean. -
Bob Loblaw at 03:37 AM on 21 March 2013New Study, Same Result - Greenhouse Gases Dominate Global Warming
Klapper@35:
After I had posted my previous comment, it occured to me that you might be referring to Sun Spot Number. Sadly, sunspots are not a measurement of TSI. SSN and variations of it (umbra-penumbra ratios, etc.) are one of the wasy that some people have estimate past TSI. Moderator DB has pointed you to a post here that discusses reconstruction of TSI. Your correlation of TSI to SSN confirms a link, but you have not presented any results that would tell me what the uncertainty in that correlation means in terms of TSI input to a model.
As for aerosols, you seem to be under the illusion that the only thing that matters is volcanic events, and even then only that they happen. Estimating the actual optical properties of the ejecta is important, as is the background level of aerosols from other sources (e.g. industrial).
From that point, all you seem to have is Feelings. You certainly haven't convinced me that you actually understand the importance of the accuracy of inputs to a model for studying past climates, how those inputs can be estimated (in the lack of direct readings), or the limitations that places on what we can do with such a model run.
If you wish to continue this, I will follow you to the What caused early 20th Century warming? thread. Nothing here at SkS is truly dormant - all comments will show up in the Recent Comments thread (in the middle of the main menu bar just under the masthead of each page here at SkS).
-
Doug Bostrom at 02:48 AM on 21 March 2013A Detailed Look at Renewable Baseload Energy
I should add that while I think we're very much unsuited to build and operate nuclear plants because of the nature of our species, I also think that with sufficient humility we may yet still do so with a net positive benefit despite a track record that has been spotty and will continue so. However it's still the case that several decades of intensive experimentation in self-deception by the nuclear industry seem to confirm that viewing nuclear power generation as it exists today through rose-tinted glasses does not adequately work as a means of popularizing the technology.
-
Doug Bostrom at 02:42 AM on 21 March 2013A Detailed Look at Renewable Baseload Energy
Further to Michael, many reasonable people will conclude that an irreparably damaged nuclear plant has become nuclear waste and hence a waste disposal problem. To the extent that waste then redistributes itself in an uncontrolled fashion, it's a waste disposal failure. Not having a successful plan to deal with the aftermath of a failure is itself a waste disposal failure.
Unfair framing? Well, is the Fukushima Daiichi generation plant nuclear waste, or not?
Our poor imaginations are no excuse for our errors. The hopeful outcomes we imagine collapse in the face of opposite facts.
-
Lionel A at 02:24 AM on 21 March 2013David Rose Hides the Rise in Global Warming
finglestrumpet #18
Point and SHIFT/Click on the link in the 'ps' will take you there.
I did try using the
Explosive Evidence - Experts Speak Out
construct that once worked but had trouble with it in this new gizmo editor, it did not look right in Preview, and there is no way back for further editing or using Submit.
-
OPatrick at 02:13 AM on 21 March 2013David Rose Hides the Rise in Global Warming
Dana #16 - I suspect Myles Allen's generosity towards David Rose may be somewhat influenced by their being near neighbours. Very local politics may be coming in to play here.
-
Stephen Leahy at 02:11 AM on 21 March 2013David Rose Hides the Rise in Global Warming
I too was surprised by Allen's final words. Given Rose's track record on the issue he must be quite the charming actor. The Mail has a pretty clear anti-renewable energy agenda but Rose doesn't have to be a party to it.
#15 Exactly indeed. That is why we jurnos call experts in first place. Scientists do, and should, check me out before agreeing to talk on record. And check with colleagues about their experience w specific reporters.
Dana - nicely done explanation of yet another messy distortion.
-
michael sweet at 02:03 AM on 21 March 2013A Detailed Look at Renewable Baseload Energy
JvD:
you say: "This is not speculation, but demonstrated by history. In OECD countries, nuclear waste was always handled, has hurt noone and poluted nothing. Strong indication that we know how to handle it."
In Fukushima the nuclear waste pools built on top of the released steam into the atmosphere and may have boiled dry. It released enormous amounts of radiation into the local environment, in addition to radiation released from the nuclear cores. Thousands of people have been forced out of their homes and parts of the sea are not fished due to the radioactive materials, an unknown amount coming from nuclear waste. Babies have been tested for nuclear exposure. Milk and vegetables have been withdrawn from the market. If that means "has hurt noone and poluted nothing" to you I am amazed. Are the rest of your claims as good as this one???
-
funglestrumpet at 02:02 AM on 21 March 2013David Rose Hides the Rise in Global Warming
It is all very well critising David Rose and his ilk, but they have families to feed and mortgages etc. to repay. While no present or future sanction exists for him and his fellow correspondents, such as Melanie Philips, Peter Hitchens etc., they have a choice: submit articles that are going to please their editor and thus win more commissions, or tell it the way it really is and lose a significant source of income. I don't for one minute think that they are not fully aware of the error of their ways. The print media is collectively in dire straights, thanks to the internet, and will do anything to please its advertisers. As for their ethics, well, they are newspaper people, which says it all in my book.
Similarly, one also has to have sympathy for those scientists who take the fossil fuel industry's shilling and by pure coincidence find that climate change is not going to be too bad after all. I am sure that they, too, have families to support. It is just the way the world works today. Look at the role of lobbists and political sponsors and the millions spent trying to become President of the U.S.A. Can you remember when democracy actually worked and money did not swear when it talked? I can, but only just. I don't like it one bit, but I can't ignore it. It is called facing the facts.
Perhaps this side of the fence should take a leaf out of Architects and Engineers 911 Truth's approach to getting its message across. Imagine something like Explosive Evidence - Experts Speak Out but with climate change as the issue. (Pilots for 911 Truth videos are also interesting to watch, especially for those interested in aeronautics.)
Surely, the opening sentence to this post: "It seems like we have to debunk this myth on a weekly basis" shows that a change of tack has at least to be considered. I imagine that most, if not all, of those in the scientific community will by now have formed an opinion on climate change, so there are very few left that have yet to decide their stance on the matter, no matter how often this site publishes the latest findings.
Perhaps a few record breaking temperature years will do the trick, but do we have that long? It seems to me that Old Mother Nature is having a laugh at our expence. Perhaps by not quite providing headline grabbing global temperatures so that there is not a collective effort to combat the changes to the climate that are slowly taking place is her way of solving over-population. It is all very sad when one looks back at the missed opportunities the world's leaders have had to act collectively for the common good.
ps. The above link is a technique that I have not used much, so if it fails, please copy and paste: http://www.youtube.com/user/ae911truth into your browser.
-
DSL at 01:55 AM on 21 March 2013David Rose Hides the Rise in Global Warming
Yah, Dana, that's actually laughable. The suggestion that Rose is a victim is apalling. Knowing what I know about the construction of rhetoric, the "newsroom" would have had to completely re-write Rose's pieces each week. I suspect that Allen knows this, though. I, too, am prepared to believe that, if evidence can be found to support it.
Ha. Ha. Ha.
-
dana1981 at 01:29 AM on 21 March 2013David Rose Hides the Rise in Global Warming
Dr. Allen's conclusion seems rather naive:
"I am perfectly prepared to believe David sent in an accurate article that was then hacked to pieces in the newsroom"
Given Rose's long long history of misrepresenting and distorting climate science and scientists, I wouldn't believe that for a second.
-
Matthew L at 01:21 AM on 21 March 2013Lessons from Past Climate Predictions: Syun-Ichi Akasofu
Thanks Tom for taking the time with those comments. The first one went over my head somewhat, but the second with the history on the sunspot cycle research and backwards projection of Akasofu's chart was very informative.
This example has also clarified in my mind that climate prediction isn't amenable to simple linear models - there are just way too many factors involved.
-
Albatross at 01:08 AM on 21 March 2013David Rose Hides the Rise in Global Warming
Thanks OPatrick @14,
Someone in the comments section summed up part of the problem nicely:
"[Dr. Myles Allen] "But if climate scientists refuse to talk to Mail on Sunday correspondents, then their only information sources left are bloggers and David Whitehouse."
And the problem with that is? "The Mail story is based on bloggers and a non-expert" doesn't have much credibility in comparison to "The Mail story is based on an interview with climate scientist, Myles Allen". You gave their lies credibility."Exactly, therein lies the problem and scientists need to wake up to that fact. If scientists do elect to speak to a journalist, then they need to insist that they (the scientist) record the interview.
-
OPatrick at 00:40 AM on 21 March 2013David Rose Hides the Rise in Global Warming
Myles Allen has responded in the Guardian.

Prev 935 936 937 938 939 940 941 942 943 944 945 946 947 948 949 950 Next


