


 Arguments


Recent Comments
Prev 936 937 938 939 940 941 942 943 944 945 946 947 948 949 950 951 Next
Comments 47151 to 47200:
-
JvD at 19:20 PM on 20 March 2013A Detailed Look at Renewable Baseload Energy
"You are putting some blame on SkS in your last post @340. If you want to improve the post and get people to do it, because you are convinced of being correct regarding the "faulty and baseless treatment", you need to be more convincing, maybe even do a selective rewrite for consideration."
The post should be rewritten using Ted Trainer's conclusions, which are credible. Subsequently, SkS should indicate that nuclear power can allow a decarbonised energy supply when it is used rather than fossil fuels, such as explained by Barry Brooks in the above link.
Thank you,
Joris
-
JvD at 19:18 PM on 20 March 2013A Detailed Look at Renewable Baseload Energy
"What is your alternative scenario (to 100% renewables)? What alternative scenario do the sources you cite offer (quoting Ted Turner from that blog you cited: "It is also my view that we should transition to full dependence on renewables as soon as possible…although this will not be possible in a consumer-capitalist society.") ?"
Ted Trainer does not include nuclear power in his assessments, which is why he concludes that we must move to a 'simpler way'. That is: economic collapse. As is happens, there is a good article that discusses how Ted Trainer's research conclusions would change if the nuclear option was added. I'm going to present the following paper as a good description of my 'alternative scenario'. In my scenario, economic collapse is not a feature, but something that is successfully avoided without harm to the environment.
-
JvD at 19:12 PM on 20 March 2013A Detailed Look at Renewable Baseload Energy
"IMHO, your arguments did appear a bit unfocussed, and you moved the goalpost throughout the discussion and addressed few of the questions posed to you to understand the background assumptions you seemed to make."
IMHO i moved no goalposts and addressed all relevant questions. Note that I was asked four individual times to point to scientific literature before it was acknowledged that I had in fact provided such. It is difficult for me to understand why now I am the one ignoring questions.
By 'moving goalposts throughout', if you mean that I excluded war-zones from suitable sites to build nuclear power plants, then I must dismiss this criticism as simply being argumentative. For that matter, in a war-zone, wind farms and solar farms will also not likely be built. Arguably, wind farms and solar farms less suitable, because micro nuclear power can be trucked-in to provide power where it is needed, whereas solar and wind farms are fixed location assets that are extremely vulnerable to small weapons fire and sabotage.
-
JvD at 19:07 PM on 20 March 2013A Detailed Look at Renewable Baseload Energy
"As you cited only 1-2 sources though, I wonder what makes you think the contents of these are superior to what others have written?"
In the sources I mentioned, numerous additional sources are mentioned in the references. This is normal science, i.e. reading scientific literature rather that suggesting it's not there. Normal science also shows you can't run an aluminium smelter (24-hour operation) using solar or wind power (intermittent). Therefore, it is up to the deniers of this common knowledge to come up with research that shows aluminium smelters *can* be run on solar power. Instead, all I see is handwaving and references to pumped storage. However, pumped storage is far to small to help in providing storage for a 100% intermittent renewables scenario. There just aren't enough sites to built pumped storage. -
JvD at 19:03 PM on 20 March 2013A Detailed Look at Renewable Baseload Energy
"One obvious one is that, on the long term, there is only so much uranium on the planet, so very large scale nuclear generation using that as a fuel has the same basic problem as fossil fuels, GW notwithstanding. The other is that the same very large scale (global) generation will multiply the problem of waste which I already stated I wasn't so sure we handle well. "
This is a popular myth produced by fossil fuel pushers. It needs to be stamped out for there to be any kind of serious discussion about stopping AGW economically. Nuclear waste handling is far easier than handling co2, nox, sox and heavy metal waste from alternative energy sources. Even solar power and wind power produce waste. For example, the solar and wind farms built in the USA in the 20th century were never decommissioned and still sit there rusting and leaking heavy metals into the ground water. Presumably, modern windfarm and solar farms will also rust and leak after they are broken or after subsidies stop. This is not speculation, but demonstrated by history. In OECD countries, nuclear waste was always handled, has hurt noone and poluted nothing. Strong indication that we know how to handle it.http://www.mcgill.ca/files/gec3/NuclearFissionFuelisInexhaustibleIEEE.pdf
-
John Russell at 18:35 PM on 20 March 2013David Rose Hides the Rise in Global Warming
@SCM
Actually this was the first of two complementary (note: with an 'e' not with an 'i') articles written by David Rose and published by the Mail on the same day. This is 'No 2'. 'No 1' sets up the con that justifies No 2.
As to whether these are a continuing series: based on both the Mail's and Rose's history to date, I fear so.
-
SCM at 18:07 PM on 20 March 2013David Rose Hides the Rise in Global Warming
The title of the original Mail on Sunday article is "The Great Green Con no. 1 :...."
I wonder if this means we can expect a continuing series of articles in the same vein. If that is the case you're going to be kept busy playing whack-a-mole.
-
Dikran Marsupial at 17:59 PM on 20 March 2013Lessons from Past Climate Predictions: Syun-Ichi Akasofu
Following on from Tom's comment, another difference between Schwabe and Akasofu is that Schwabe did not ignore generally accepted physics (such as observed changes in solar, GHGs and aerosol forcing) that already adequately explain the observations. For Akasofu's hypothesis to be correct, we would need to be wrong on a fair amount of existing physics (which would then make a lot of paleoclimate very hard to explain).
-
Klapper at 15:21 PM on 20 March 2013New Study, Same Result - Greenhouse Gases Dominate Global Warming
@Soundoff #37:
Since we've discussed this before, you know there's a step in the land SAT circa 1945 too. However, as I've been informed to take my commentary to a dormant thread, I'll leave it at that.
-
SoundOff at 14:44 PM on 20 March 2013New Study, Same Result - Greenhouse Gases Dominate Global Warming
The root cause behind Klapper's Komplaint may be another case of the models being correct and the observations being wrong.
SST Instrumental Biases in 1945
“A large discontinuity in the mid-twentieth century in observed global-mean surface temperature”
David W. J. Thompson, John J. Kennedy, John M. Wallace & Phil D. Jones
Nature, 29 May 2008
Data sets used to monitor the Earth’s climate indicate that the surface of the Earth warmed from ~1910 to 1940, cooled slightly from ~1940 to 1970, and then warmed markedly from 1970 onward.
The weak cooling apparent in the middle part of the century has been interpreted in the context of a variety of physical factors, such as atmosphere–ocean interactions and anthropogenic emissions of sulphate aerosols. Here we call attention to a previously overlooked discontinuity in the record at 1945, which is a prominent feature of the cooling trend in the mid-twentieth century. The discontinuity is evident in published versions of the global-mean temperature time series, but stands out more clearly after the data are filtered for the effects of internal climate variability.
We argue that the abrupt temperature drop of ~0.3 °C in 1945 is the apparent result of uncorrected instrumental biases in the sea surface temperature record [since it is only apparent in SSTs].
Corrections for the discontinuity are expected to alter the character of mid-twentieth century temperature variability but not [alter] estimates of the century-long trend in global-mean temperatures.
Apply this correction and the observed 1910 to 1945 warming rate will decrease to what models understand should have happened according to known forcings.
Moderator Response: [RH] Fixed link. -
andylee at 14:36 PM on 20 March 2013February 2013 Arctic Sea Ice Death Spiral Update
Nice graphs Jim! ;-)
Kevin, the spiral lines in fig1 are the contours of averaged months in fig2, moving from back to front, or what you see in the animation when the graph rotates.
CBD, re sharp angles.. the lines are virtual, because they can't exist - halfway between Jan 2012 and Jan 2013 is Jun 2012 - another series!
I hope to make it clearer in a future animation.
-
Tom Curtis at 11:46 AM on 20 March 2013New Study, Same Result - Greenhouse Gases Dominate Global Warming
Klapper @35, the a significant portion of combustion in WW2 would have produced black smoke, and hence Black Carbon (BC), a warming factor. In fact, the less controlled the combustion, in general, the higher the proportion of aerosols is in the form of BC. This is likely to have contributed to the spike in warmth in 1940, but there is insufficient BC in glacial records at that time for it to be the primary explanation.
-
Klapper at 10:44 AM on 20 March 2013New Study, Same Result - Greenhouse Gases Dominate Global Warming
@Bob Loblaw #33:
Previous to this conversation I'd downloaded both PMOD/ACRIM data, binned them by month and calculated correlation coefficients against SSN (Sunspot number). The R-Squared for PMOD is 0.80, for ACRIM it's 0.61 for all months 1992 to 2012. I used the reconstructions which splice the data from different satellites by correcting as they see fit the baseline shifts between them. My guess is the PMOD people adjusted the baseline shifts to maximize the correlation with SSNs. No problem with that. Maybe ACRIM went more on first principles and said this is our best guess of the shifts, irrespective of the correlation with SSNs. Either way the correlation is still pretty good. In both datasets, the scatter is much lower for lower SSN months. In the period 1910 to 1945 we generally had lower SSNs through the cycle peaks, than post 1950.
As for aerosols, the volcanic record is what it is, after Katmai there are no major eruptions, so that simplifies the aerosol record somewhat. As for man-made aerosols, 2 facts aid the interpretation of the limits of aerosol change in the 1910 to 1945 period. Number 1, the was no major regulation of emissions in that period, so unit emission per unit consumption did not change much, although there was some displacement of coal by oil. Number 2, the consumption was fairly linear for both oil and coal through this period, the big inflection point in consumption being about 1950.
All that being said, what forcing parameter could we expect to change by a lot in the period 1910 to 1945. My argument, as elaborated above, is that no known climate forcing parameter changed by a lot in this period and the ones that did, we have a reasonable handle on. At times I've thought the aerosol output from WWII is one of the wildcards (burning cities/towns/millions of tonnes of high explosive kicking up particulate matter etc.), but if anything that would have cooled things down, yet there is a distinct temperature peak during the war.
So that brings us back to the question at hand. What caused the rapid warming from 1910 to 1945, given we can't realistically see rapid changes in anthropogenic or solar forcings during this period, which is also more or less free from major vulcanism?
Moderator Response: [DB] Please refer to both the Comparing past climate change to recent global warming and the What caused early 20th Century warming? threads for reference. If you still wish to then pursue this line of inquiry, take it to one of those threads, not here. -
Tom Curtis at 10:32 AM on 20 March 2013Lessons from Past Climate Predictions: Syun-Ichi Akasofu
Matthew L @54, in fact the sunspot cycle was not hypothesized until 1843, and that on the basis of observations of around one and a half solar cycles. Heinrich Schwabe reported that:
"From my earlier observations, which I have reported every year in this journal, it appears that there is a certain periodicity in the appearance of sunspots and this theory seems more and more probable from the results of this year."
There is a marked contrast between Schwabe's tentative "seems more and more probable" and Akasofu's rather definite "We learn that the recovery from the LIA has proceeded continuously, roughly in a linear manner, from 1800-1850 to the present".
Schwabe's conjecture did not attract widespread interest until 1850, when the number of observations had been extended to three solar cycles. Early interest lead Rudolf Wolf to not only continue the observations himself, but to reconstruct the cycle from historical observations back to 1745, a task completed in 1868. That means that before the hypothesis of sunspot cycles was accepted, there existed known observations of a total of around eleven cycles.So using your chosen example, yes, you can establish the existence of a regular pattern in science without having a physical explanation; but no, you can't do it on just one or two cycles. At the very least, Akasofu should have compared his theory with known variations in past temperatures:
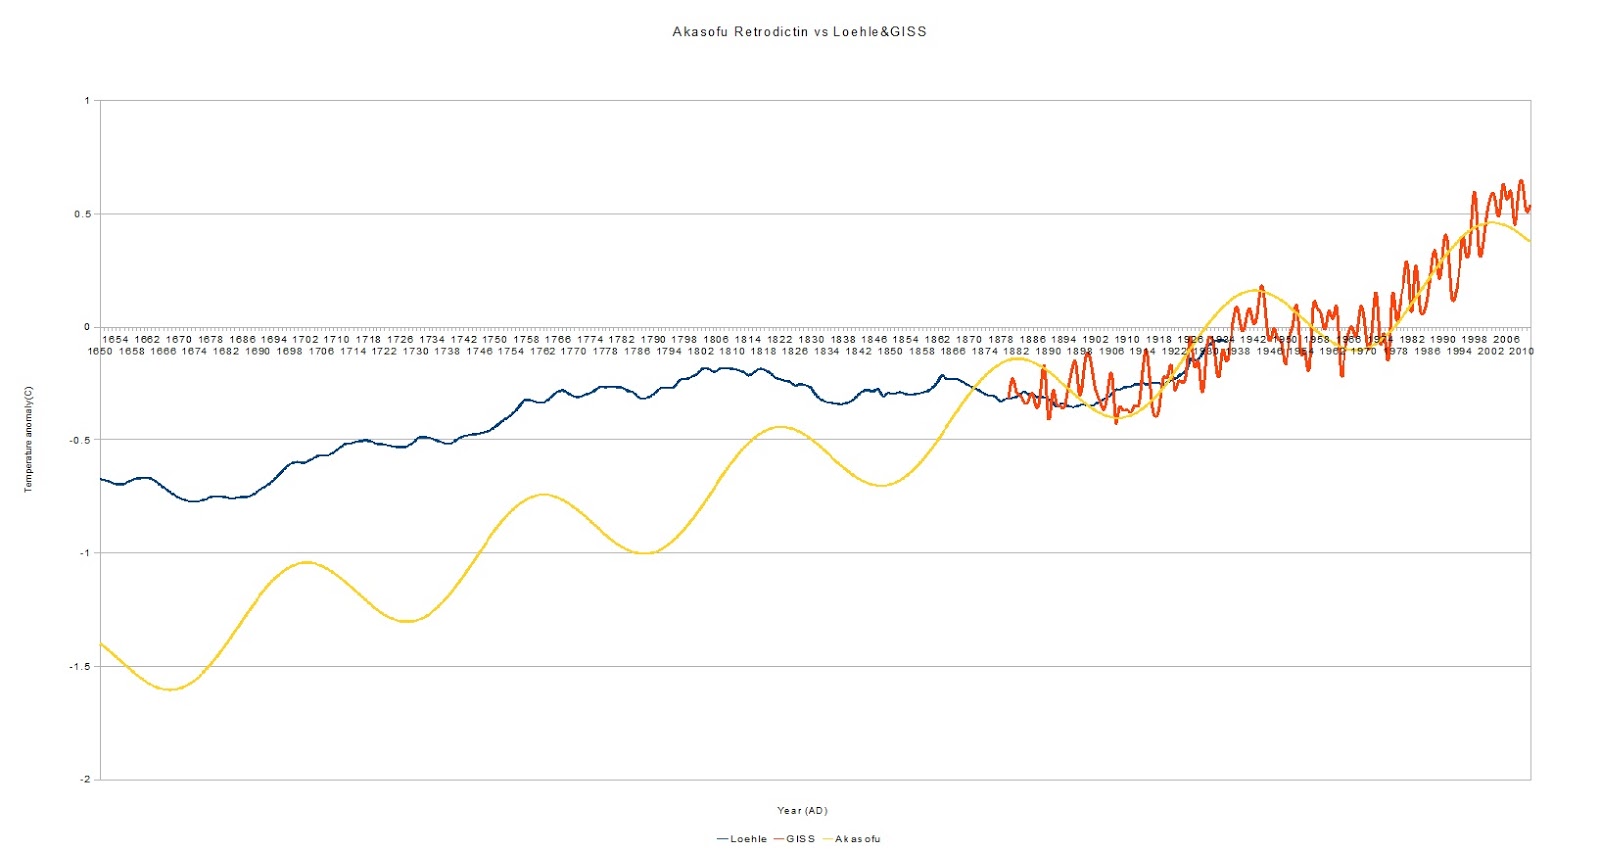
Unfortunately, if he did so, it would be evident that neither the straight line "recovery" from 1800-1850 to the present, nor his regular fluctuations are supported by evidence of past temperatures. In fact, the retrodiction of the linear trend appears to fail at any date prior to 1880; and while there are small fluctuations in the temperature record, which might be regular (and might just as easilly be pure chance), they are nowhere near the magnitude required by Akasofu's theory. (Note, the reconstruction used was chosen as most acceptable to "skeptics", and is biased towards the North Atlantic, and hence is likely to overstate rather than understate fluctuations in global temperature.)
-
John Russell at 09:47 AM on 20 March 2013David Rose Hides the Rise in Global Warming
@StBarnabas
I'd be interested if you could point us to that Radio 4 report.
As for the new PCC. I must admit I don't have great hopes. It neeeds testing. In theory newspaper articles must not print falsehoods, but I agree their remit seems very people-oriented. Science seems to be seen as fair game for spin. Is the view 'nobody got hurt': which is maybe true for the short term, but will it in the long term?
It now appears (See Leo Hickman's Tweets for today) that the Mail on Sunday have today been changing Rose's article—for instance by acknowledging the origin of Ed Hawkins' graph (see end of the article). The cynical might say this marks a new tactic... write your story (as deliberately error-strewn as you like); wait until it's been seen by a few million people; then water it down to make it acceptable to the PCC. Voila! Job done. How can you print a retraction of something that's already been retracted—or indeed, appears to have never existed?
-
John Russell at 09:17 AM on 20 March 2013David Rose Hides the Rise in Global Warming
I just came across another recent quote from Prof Myles Allen (University of Oxford) that shows how grossly Rose distorts his views ...
“While every new year brings in welcome new data to help us rule out the more extreme (good and bad) scenarios for the future, it would be equally silly to interpret what has happened since the early-2000s as evidence that the warming has stopped.”
That link also contains statements from a number of other climate scientists who reject any suggestion that ‘global warming has stopped’.
-
StBarnabas at 09:10 AM on 20 March 2013David Rose Hides the Rise in Global Warming
Of course this is the normal Sunday Mail nonsense. What horrifies me that in the interest of balance it was reported on BBC radio 4 (probably the best news radio station in the UK).
What is of most interest in the new Levinson related legislation - big brinksmanship in Westminster yesterday to curtail lies being printed by the press. Of course this is related to individuals - there have been a few horrific cases recently, but I need to digest if the new complaints procedure can be used.
John Russell any thoughts?
-
CBDunkerson at 08:37 AM on 20 March 2013February 2013 Arctic Sea Ice Death Spiral Update
Kevin wrote: "If this is representing the same data, obviously this can't be, so correct me where I've gone wrong interpretting the second figure."
Did you notice that figure 2 shows smooth curves while figure 1 shows sharp angles? That's because figure 1 has one data point per month (the monthly average) while figure 2 has one data point per day. Hence the difference.
-
scaddenp at 08:13 AM on 20 March 2013New Study, Same Result - Greenhouse Gases Dominate Global Warming
With unlimited computing power - maybe. The different runs produce outputs from different initialisations. Changing parameterisation adds another dimension as would changing the forcings. I am not convinced that early 20th C forcing are well enough known to make statements that evaluate model skill independent of forcing uncertainities. What you can say is the observed temperatures are consistent with model outputs giving a particular set of forcings. There may well be other forcings at work or various forcings might be incorrect but the model runs do not supply evidence to support this.
-
Tom Curtis at 08:04 AM on 20 March 2013Lessons from Past Climate Predictions: Syun-Ichi Akasofu
Two quick points. The first is an erratum. My graph of the "Akasofu prediction" @41 displaces the my reconstruction of Akasofu's prediction upwards by 0.04 C. This has no effect on the trends, but improves the fit with temperaure anomalies in the late twentieth century. For the record, the fit is established by ensuring the linear trend of the Akasofu reconstruction has the same mean as the observed data.
Second, coming from a background in philosophy and logic, I consider the usage of "hypothesis" and "theory" in science thoroughly inconsistent and confused. This is, firstly, because in practise scientists and historians of science do not reserve the term "theory" only for well established hypotheses, and in some cases continue to refer to hypotheses as hypotheses even once they are well established. What variouse theories are called is more a matter of historical accident than of consistent usage.
Further, it is because in logic (and in my usage) a "theory" is a set of propositions closed under logical implication. That is, the theory includes all propositions that are logical implications of any subset of the propositions in the theory. On that basis, all hypotheses are theories, assuming they are not logically inconsistent. Some hypotheses are well established, and would be better called "well established hypotheses" or "well confirmed hypotheses" (but not "well verified hypotheses") than ellevating "theory" to a usage that is inconstent with the use in philosophy and in common usage. Just my two cents worth.
-
Bob Loblaw at 08:02 AM on 20 March 2013New Study, Same Result - Greenhouse Gases Dominate Global Warming
Klapper @ 29:
I would agree that errors in our knowledge of CO2 forcing in the period 1910-1945 are likely small, simply as a result of there being no reason to think that it varied significantly.
Would you care to explain to me why you are confident about the estimates of atmospheric aerosol levels that are available for that period? Perhaps you'll wish to compare the methods used during that period with the kinds of estimates we can obtain today with networks such as AERONET, or satellite data?
As well, perhaps you are willing to explain how accurate the measurements of solar output (you've used the acronym TSI, wich is Total Solar Irradiance) for that period are? Please feel free to compare that accuracy to those recently available from satellite data used in this PMOD analysis. Feel free to be as technical as you wish - I have worked with people from PMOD, and I am quite familiar with the types of instruments used to measure TSI on these satellites.
Note that I consider phrases such as "the correlation between TSI and SSN are pretty good so I can't see a large error in that parameter" to be nothing more than handwaving (regardless of what you are referring to as SSN, which is an acronym that escapes me at the moment). A correlation with something that is not the item of measurement is not a fundamental estimate of the accuracy to which that element (TSI) is measured.
I suspect that you are confusing the accuracy of an input to a model with the accuracy of the model, but I can't be sure where you are going wrong until you give a more elaborate explanation of your thought process.
-
Magma at 07:46 AM on 20 March 2013Death in Jurassic Park: global warming and ocean anoxia
"Oxygen of course makes up over 30% of seawater, but that oxygen is the 'O' bit of the H2O that makes up the sea."
Might want to change that. Accounting for salinity, oxygen makes up about 85.8% of seawater by mass. Making the calculation on an atomic basis seems a bit odd and is open to misinterpretation. -
Klapper at 07:44 AM on 20 March 2013New Study, Same Result - Greenhouse Gases Dominate Global Warming
@scaddenp #26:
Please re-read my posts. I am completely aware the ensemble envelope is not any kind of 2 sigma error boundary. This psuedo-error boundary is used over and over in graphics presented by the IPCC, and also at sites like RealClimate.org. Yet it's statistical validity is murky at best.
There has to be a better way of rationalizing model output against observations, whether in the period 1910 to 1945, or the last 15 years. I've put some rough ideas on the table in my post to Dana (#22).
-
Klapper at 07:34 AM on 20 March 2013New Study, Same Result - Greenhouse Gases Dominate Global Warming
@KR #25
The ensemble "envelope" as presented in Figure 2 is not the 2 sigma range of the mean ensemble trend. I've been saying this all along. This is what I meant in my post #15. "Within the squiggles" has no statistical validity. I clearly stated that I was not claiming the 2 sigma range of the ensemble trend was a valid way to disprove the models (tempting as it might be).
On the topic of CMIP5, I have downloaded a number of 20th century runs from different models and do not agree with your statement: "models tend to settle down to a near mean-centered behavior after only a few years of the run". Put some numbers on that and we can discuss further. Keep in mind my period of interest is 1910 to 1945. This is a good time interval for checking your assertion since it is long enough to detect the climate signal, but not so long that agreement is guaranteed.
-
Jim Pettit at 07:27 AM on 20 March 2013February 2013 Arctic Sea Ice Death Spiral Update
On 17 March, 2013 at 07:48 AM, LarryM wrote: Another permutation that might complement it and more clearly show the differences between seasons is for the radial scale to show, rather than absolute volume in km3, the percentage of the volume in 1979 that remains. I think it would show that the summer/fall ice is disappearing exceptionally fast.I thought so, too, so drew up the following very telling graph:

And for kicks, I also created one showing the same data in a normal line chart. It's also very telling--if not perhaps even more so. (Click either image to enlarge):

As Mr. Tamblyn worded it so eloquently and succinctly above: "It doesn't matter which variation of a graphic you use, they all show the same thing. The Arctic sea ice is exiting stage left..."
Indeed...
-
DSL at 07:25 AM on 20 March 2013New Study, Same Result - Greenhouse Gases Dominate Global Warming
Kevin, Jungclaus et al. (2010) may answer your LIA-carbon cycle concerns, and Lemoine et al. (2010) may also be informative.
-
Klapper at 07:18 AM on 20 March 2013New Study, Same Result - Greenhouse Gases Dominate Global Warming
@Bob Loblaw #24:
I doubt the error bars on CO2 growth rate in the 1910 to 1945 interval are significant to the discussion we are having here. There is one major aerosol event (Katmai) at the very start of the period but none after. The correlation between TSI and SSN are pretty good so I can't see a large error in that parameter. It would be better if the major SAT datasets were truly independent which would allow us to check the confidence on the observations, but since SSTs in the Southern Hemisphere are pretty sparse that is somewhat of a weak link.
In short, while I acknowledge your point of data accuracy weakness in the 1st half of the 20th, I think the period in question is a very interesting one that deserves more investigation.
-
scaddenp at 06:56 AM on 20 March 2013New Study, Same Result - Greenhouse Gases Dominate Global Warming
You absolutely get an H2O feedback. Carbon feedbacks however are very slow - most AR4 models assumed them to be zero for purposes of predicting climate 100 years in advance. For longer periods you would have to consider them.
-
Kevin8233 at 06:29 AM on 20 March 2013New Study, Same Result - Greenhouse Gases Dominate Global Warming
So, basically, natural forcings drove the warming from the first half of the 20th century and earlier, via the sun and solar cycles.
After the solar cycles and temp response diverges in the late 70's, it was anthropogenic ghg that drove the warming. I know it wasn't a switch, and there was some ghg before the 70's, but relatively minor.
What happened to the feedback loops for CO2 and H2O? According to other debunking threads here (CO2 lags/leads temp - Coming out of LIA - Water is greatest ghg) there should be a feedback warming contribution from both of the gasses.
If there was 0.8 C warming from LIA to 1940, shouldn't there also be about the same warming from these feedback loops? If there was, it can't be both natural and anthropogenic.
-
scaddenp at 06:29 AM on 20 March 2013New Study, Same Result - Greenhouse Gases Dominate Global Warming
Klapper, as a further note, I would say it is wrong to confuse the envelope of multiple model runs with a 95% confidence interval. Also, there is no way that you expect any actual climate to follow an ensemble mean. This would imply dont think climate interal variability is present. You do however expect 20-30 trends to match the 20-30 trend of the model mean. You also expect the actual to be within the envelope. You dont have evidence of an unknown forcing unless it is outsite. I would also second Bob's comment - estimating early 20th C forcing is plain difficult.
-
New Study, Same Result - Greenhouse Gases Dominate Global Warming
Klapper - Looking at Fig. 2, which represents the models run with all of the forcings both natural and anthropogenic, I would have to say that the model mean and standard deviation matches the observations quite well. Observations for that period are well within the 2-sigma model range, and mostly within the 1-sigma range, with two 10-year excursions above/below the model mean at about 1905-1915 and 1935-1945.
Please remember, as others have pointed out, that observations are a singular run of the real thing - which statistically has a 1/20 chance of exceeding a 2-sigma range. In addition, while the models appear quite good, they certainly are not perfect. They just might, however, be very useful.
So I won't rationalize the models fail to replicate the climate signal in the period 1910 to 1945 based on regression statistics of the ensemble compared to the observations.
Odd - that appears to be exactly what you are doing - over multiple comments...
My guess is they don't even necessarily use identical inputs for forcing and/or initial conditions...
Then you have clearly not reality-checked your assertions - see the CMIP5 Model Intercomparison Project for the forcing data used, and A Summary of the CMIP5 Experiment Design for details on the various runs of the comparison project. Initial conditions do vary, but given the boundary constraints of energy balance all of the models tend to settle down to a near mean-centered behavior after only a few years of the run. Which is part of what makes them useful - inter-model variation helps establish the range of possible climate responses bounded by forcings, feedbacks, and conservation of energy.
I'm sorry to say this, but your complaints strike me as concern trolling.
-
Bob Loblaw at 06:18 AM on 20 March 2013New Study, Same Result - Greenhouse Gases Dominate Global Warming
Klapper:
You keep beating the horse of model comparisons to observations in the period 1910-1945. Unfortunately, until someone invents a time machine, we're not going to get greater accuracy on our values for such things as solar output, atmospheric aerosol loading, surface albedos, vegetation cover, etc. for the period. We may be able to improve on proxy reconstructions of some of those things, but there will always be greater uncertainties in model inputs for that period (compared to now).
One could always play around with various bits of the model in an effort to reproduce a particular historical pattern, but there are diminishing returns from this excercise (as far as science is concerned). At some point, you just have to accept that there are uncertainties in the input, and thus uncertainties in the output. It makes more sense to look at more recent periods with greater input data availability to focus on model improvements.
-
Bob Loblaw at 06:06 AM on 20 March 2013New Study, Same Result - Greenhouse Gases Dominate Global Warming
Actually, Dana, I think Clyde is just trolling - trying to get your goat. Earlier in the thread (currently #8), he quotes you as using the phrase "is consistent with", and then tries to pretend that this means that the referenced paper had nothing new in it beyond "settled science". I'm quite sure that Clyde is not so stupid as to think that they mean the same thing, so he must have had some other reason for posting.
Relativity is consistent with Newton's laws - i.e., they give pretty much the same results within the region of overlap of speeds much less than the speed of light - but relativity is obviously a significant extension of the science imbedded in Newton's laws.
-
Klapper at 05:19 AM on 20 March 2013New Study, Same Result - Greenhouse Gases Dominate Global Warming
@Dana1981 #17:
I think the best way to test the hypothesis that the models replicate the climate signal in the period 1910 to 1945 is to compare individual models with fixed parametizations, with the input varying according to the 95% confidence we have on intial conditions and forcing magnitudes. Of those runs, how many would pass conventional regression statistical comparisons against the observations is a very good question.
As noted above the ensemble "envelope" is a very murky number, coming as it does from 20 or so different models, with different parametization factors, and different levels of resolution/sophistication. My guess is they don't even necessarily use identical inputs for forcing and/or initial conditions, although hopefully they're close since the runs are part of a model intercomparison process.
Doing model by model, run by run statistics against the observations might allow you to reject some models and tighten up the ensemble envelope. Right now I don't see a good fit between the model ensemble and the observations in the period 1910 to 1945. Climate science should be digging deeper as to why that is.
-
william5331 at 05:14 AM on 20 March 2013New Study, Same Result - Greenhouse Gases Dominate Global Warming
At some point, the Chineese people are going to force their government to clean up their air. There goes a large part of the aerosols. The other elephant in the room is CH4. While it is 20 times more powerful than CO2 on a hundred year basis, it is more than 100 times more powerful in the short term. Methane is at present at about 1.7ppm and rising. It only has to reach about 3.5ppm to equal the effect of the present concentration of Carbon dioxide. I seem to have read about kilometer wide patches of methane bubbling to the surface north of Russia and enough clathrates around just the coast of America to supply her energy needs for centuries.
http://mtkass.blogspot.co.nz/2013/03/the-real-strength-of-methane.html
-
dana1981 at 05:01 AM on 20 March 2013New Study, Same Result - Greenhouse Gases Dominate Global Warming
Clyde @18 - so basically your complaint is that I didn't just copy and paste the abstract?
As I already explained, aerosols are the primary negative anthropogenic forcing. Also "0.5°C cooling" and "-0.5°C" mean exactly the same thing.
-
dana1981 at 04:59 AM on 20 March 2013David Rose Hides the Rise in Global Warming
tmac57 @4 - no, we attempted to contact Myles Allen but have not received a reply.
XRAY @5 - if you refer to Figure 1, it ends in 2009 because it's a 5-year running average. The data are up-to-date.
-
Klapper at 04:46 AM on 20 March 2013New Study, Same Result - Greenhouse Gases Dominate Global Warming
@Mammal_E #16:
I'm not arguing that GHG's have no infuence. I'm arguing the models are missing some important forcing. That's a very difficult thing to prove. In science (unfortunately) sometimes 2 wrongs make the appearance of a right. That is to say, your model could be wrong and still replicate the observations.
Which brings us back to the 1910 to 1945 time period. The model ensemble trend (for CMIP3 anyway) is 1/3 the warming rate of the observations. Climate scientists have stated in the past that you need 30 years to capture the climate signal in the observations. Here you have more than 30 years. We can say by analysis of the observations that the lower bound climate signal (in the 95% confidence interval) is 0.10C/decade. The model ensemble trend in the period 1910 to 1945 is still only 1/2 of that.
I know the varibility is very low on the ensemble model trend so I suspect that if you calculated the 95% confidence on it, you would get a very low 2 sigma, even after correcting for autocorrelation. However, I also know that the ensemble trend is a very murky number, coming as it does from a range of models with different parametization factors etc. So I won't rationalize the models fail to replicate the climate signal in the period 1910 to 1945 based on regression statistics of the ensemble compared to the observations.
However, all that being said, don't you think that the scientific method would have you question why you have a marginal fit in the 1910 to 1945 period between the models and observations.
-
Clyde at 03:52 AM on 20 March 2013New Study, Same Result - Greenhouse Gases Dominate Global Warming
@dana1981 - 12
You say in paragraph 2 -
Over the past 60 years (1951–2010), the study finds
Then you have what the abstract says except you put - (mainly from aerosols) - instead of - from other anthropogenic forcings. Then you use 0 to 0.5°C, while the abstract says, 0 to -0.5°C.
-
tmac57 at 03:29 AM on 20 March 2013David Rose Hides the Rise in Global Warming
Has there been any response yet by Myles Allen to Rose's article. I would guess that he is not pleased.
-
gws at 02:57 AM on 20 March 2013A Detailed Look at Renewable Baseload Energy
Joris/JvD,
I am writing as somebody without the specific background of most commenters here.
IMHO, your arguments did appear a bit unfocussed, and you moved the goalpost throughout the discussion and addressed few of the questions posed to you to understand the background assumptions you seemed to make. I do not think your points were "ignored". In fact, they were engaged and people acknowledged they have read your cited authors. As you cited only 1-2 sources though, I wonder what makes you think the contents of these are superior to what others have written?
If your main point was that it is impossible to decarbonize completely (physically), you were answered adequately.
If your point was that nuclear power must be employed in addition to renewables, you were also answered adequately (if possible), although a different thread may be more appropriate.
If your point was that it is "economically impossible" (@335) to have renewables supply all power, you were maybe not answered adequately, but I wonder if that would be even possible. We cannot predict the economic future. What appears uneconomical today, will not in 5-10 years. In addition, it appears to me that many such studies still apply BAU, assuming that one would simply have to satisfy future (=current plus growth rate) demand by 100% renewables, disregarding that serious change necessarily also involves increases in efficiency, making sure the renewables mix is (regionally) right with most production being local and with adequate storage capacity, and potential population reductions for sustainability.
What is your alternative scenario (to 100% renewables)? What alternative scenario do the sources you cite offer (quoting Ted Turner from that blog you cited: "It is also my view that we should transition to full dependence on renewables as soon as possible…although this will not be possible in a consumer-capitalist society.") ?
You are putting some blame on SkS in your last post @340. If you want to improve the post and get people to do it, because you are convinced of being correct regarding the "faulty and baseless treatment", you need to be more convincing, maybe even do a selective rewrite for consideration.
-
CBDunkerson at 02:46 AM on 20 March 2013A Detailed Look at Renewable Baseload Energy
Wind power usually has a capacity factor (i.e. average output as a percentage of nameplate capacity) in the range of 20% to 40%. Let's assume 20%.
Pumped hydro storage usually has efficiency (i.e. energy returned from storage divided by energy expended to store) in the range of 70% to 85%. Let's assume 70%.
Using these two numbers we can find that, given sufficient storage capacity, a combination wind and pumped hydro solution could achieve 14% (i.e. 20% * 70%) of nameplate capacity as baseload capacity. So, using conservative values for currently operating technologies, wind could provide continuous 800 MW baseload power with a nameplate capacity of ~5,700 MW. Yet JvD lists 13,000 MW of nameplate wind as being required to provide 800 MW of peak capacity.
Obviously, something doesn't add up. The problem is that JvD is insisting that most wind energy instead be 'curtailed'... just 'thrown away' without being used at all. Yet he provides no reasoning to support that position. Why throw away vast amounts of electricity rather than using it for storage or transmitting it to areas that need it? No explanation has been given... which makes it seem like the only purpose is to make renewables appear unworkable by grossly inflating the amount of renewable power required to meet demand.
-
Philippe Chantreau at 02:19 AM on 20 March 2013A Detailed Look at Renewable Baseload Energy
JvD makes this authoritative statement about nuclear energy: "waste we know how to handle." If talking about nuclear as it is most common nowadays, I have to ask for substantiation on this because I am far from convinced. I'll add that I am by no means opposed to nuclear, which presents numerous advantages. It also, however has numerous challenges and drawbacks. One obvious one is that, on the long term, there is only so much uranium on the planet, so very large scale nuclear generation using that as a fuel has the same basic problem as fossil fuels, GW notwithstanding. The other is that the same very large scale (global) generation will multiply the problem of waste which I already stated I wasn't so sure we handle well.
-
dana1981 at 02:07 AM on 20 March 2013David Rose Hides the Rise in Global Warming
I agree, I'm not British but Rose has a long history of grossly distorting climate science. If the PCC offers a possible recourse, I would recommend pursuing it.
-
michael sweet at 02:06 AM on 20 March 2013A Detailed Look at Renewable Baseload Energy
JvD,
I was not thinking about nuclear arms, thanks for reminding us about that problem. I referred to the demonstration in Fukushima that when a nuclear power plant is disconnected from the grid, the core melts down. Nuclear power plants require grid power or fuel for generators even when they are shut down to prevent core melt down. This problem needs to be addressed as in any war zone it is likely for a power plant to be a target. I note that you now claim nuclear can power 75% of the world and not 100% as you previously claimed. What do you plan to do for the other 25%? Many stable countries 20 years ago have had wars fought on their land.
Florida actually suffers from two nuclear problems at the same time, two separate plants by the same operator. I will also mention that Southern California has a disabled nuclear plant they are paying for right now. Nuclear is not economic in the USA. No private investors are willing to take the risk.
-
John Russell at 02:03 AM on 20 March 2013David Rose Hides the Rise in Global Warming
I wrote to the Press Complaints Commission last time Rose wrote a similar an article. The PCC did nothing.
Anyone in the UK who want to have another go this time please don't hesitate.
-
dana1981 at 01:47 AM on 20 March 2013New Study, Same Result - Greenhouse Gases Dominate Global Warming
Klapper - all you need to do is look at Figure 2 to see the observations fall within the envelop of individual model runs.
-
CBDunkerson at 01:27 AM on 20 March 2013A Detailed Look at Renewable Baseload Energy
JvD wrote: "When talking about full decarbonisation, we must consider aspects such as curtailment and storage of intermittent power honestly."
And... you consider your assumption of 100% curtailment of excess renewable energy to be 'honest'?
-
shoyemore at 01:15 AM on 20 March 2013David Rose Hides the Rise in Global Warming
I hope this time Rose is the subject of a complaint to the newspaper, or the Press Complaints Commission. He seems to be allowed get away with his chicanery as a matter of course.
-
A Detailed Look at Renewable Baseload Energy
JvD - Given the order of magnitude differences in integration costs between the EU estimate you linked and the UK estimate I did (25B vs 3.5B Euros for 40% integration of intermittent supplies), I can't consider the economic questions wholly answered - in either direction. And given the costs of continued carbon emission, we will have to do something. But again, I don't see any proven show-stoppers either in terms of costs or technical issues.
[ Side note: As to excess power, the US navy has estimated that a 100MW power plant could produce (using seawater as a source of both electrolytic hydrogen and dissolved CO2) roughly 41,000 gallons of synthetic hydrocarbon fuel per day. Production of aviation fuel, for example from a nuclear carrier powerplant, is estimated by commercial syn-fuel manufacturers to be capable of producing aviation grade fuel at a cost of ~$6/gallon, approaching current prices. In my view, excess irregular power could be applied to making carbon-neutral hydrocarbons for both transportation and power storage - given sufficient storage in the production pipeline, irregular oversupply would not be an issue. ]
Nuclear, on the other hand - the major objections to a nuclear panacea are also economic $$$. Extremely high construction costs, slow build times due to politics of approvals, overly optimistic energy pricing due to a lack of accounting for externalities of fuel extraction, production, storage, and waste management, not to mention decommissioning costs, all make nuclear at least as financially unattractive as any other option. And given the very chunky pricing of single GW size power plants, extremely hard to finance, unlike the small increments of most renewable sources. I have some hopes for "mini" reactors, the 100-250 MW 'modular' designs, but there are still huge issues with the inefficient once-through fuel cycle and waste management. I don't see those being addressed without some realistic consideration of breeder reactors, which doesn't seem to be on anyones agenda at the current time.
Anyone who seeks to destroy nuclear power while being under the illusion that solar panels and wind turbines are convenient drop-in replacements for nuclear power plants is inadvertantly dooming our chances of achieving a decarbonsed energy supply. He is also an unwitting tool of the fossil fuels sector. The fossil fuels sector *love* the growing infighting between the various low carbon energy technologies wind, solar and nuclear. It is a great achievement of them that the have managed to frame nuclear as the enemy of wind and solar.
Matters are just not as simple, nor as cartoonish, as you have portrayed them. On my part, I am certainly not someone who "seeks to destroy nuclear power", and I consider that a complete mischaracterization of the view I have seen expressed on SkS.
Entrenched fossil fuel suppliers are certainly against competitors - but they've had 50 years to come to terms with nuclear, and it just hasn't been a major factor. Wind and solar are the fastest growing contributors to the energy system - 10%/year growth for wind, near 100%/year growth for solar PV - they are simply cost-effective energy sources. Like it or not, we are going to have to consider, and engineer, for their integration - while welcoming the reduction in CO2 emissions.
Prev 936 937 938 939 940 941 942 943 944 945 946 947 948 949 950 951 Next


