


 Arguments


Recent Comments
Prev 937 938 939 940 941 942 943 944 945 946 947 948 949 950 951 952 Next
Comments 47201 to 47250:
-
JvD at 00:42 AM on 20 March 2013A Detailed Look at Renewable Baseload Energy
I get the feeling there is no real desire here to get to the bottom of this issue. Funny, since the people on this site must be familiar with the way 'climate skeptics' destroy their own credibility by acting out in the same way whenever their pet ideology is threatened. Take the time to read the comments threads on sites like WUWT, etc, if you don't know what I mean.
The 8% firm capacity factor for an EU-wide connected wind scheme is a wind-industry statement. It is telling that you don't even accept figures from the wind industry itself, which, if anything, must be the close to best case, probably not the worst case. Concerning Europe, you'll find that EU-27-wide lulls in wind speed *are* rather common, which is probably part of why the firm capacity is only 8%, and not 10% which it apparently is in the US (according to Jacobson). Either 8% or 10% do not make much of a difference to the issue at hand of course, which is that intermittent renewables cannot evidently provide baseload power. (except if money is no issue of course)
Worryingly, in the same paragraph, you quote a worst case example for a nuclear power project in Florida as if it where the norm for nuclear, exposing some hypocrisy in your argument it seems. Because why not look at the best case for nuclear, as I have looked at the best case for wind? In order to really understand the modern potential of nuclear power, taking a look at how well the Chinese are doing would add far more insight than isolating one failed project in the USA.
The problem with nuclear power is not that it does not look good on paper - which it does - but that politics can make a mess of it when it is guided by fossil fuel interests. Contrast this with intermittent renewables, which not only are politically difficult (subsidies and siting problems f.e.), but already which fail badly on paper from the outset, making them worse than hopeless and only good for niche applications and small penetrations, thereby posing no existential threat to fossil fuels.
Note that we are not talking about adding merely 10% solar or wind to the grid, which is obviously no problem. We are talking about full decarbonisation of the grid, which is what this thread is really about. When talking about full decarbonisation, we must consider aspects such as curtailment and storage of intermittent power honestly. You are not doing this, thereby preventing the discussion from advancing to the required level IMHO.
Ignoring the literature on the subject as indicated by me is useless. You may continue to imagine that I have not linked to peer reviewed research. It would arguably be better to read my posts again. (google Ted Trainer for a start, though there are many good papers on the subject)
Concerning the war-zone argument against nuclear power. If that is the best you can do, then I guess we mostly agree already. In any case, probably north of 75% of all energy usage takes place in stable countries after all, and that is where nuclear power would do very well. Besides, even if a nuclear country ends up going to war, the nuclear plant does not become a threat. Nuclear weapons development is completely independent of having active commercial power reactors, since fuel for nuclear bombs is made in purpose built minireactors. Getting bomb material from used fuel from a commercial NPP is difficult and expensive and is not done by any nuclear armed state. Nuclear proliferation and waste management are issues we know how to handle. Doubting our ability to handle it is merely being argumentative IMHO.So I guess I'm done here. I've not seen any substantial counterarguments to my points. I'll be watching this thread for any serious counterarguments of course, and I sincerely hope the article at the top will be overhauled to reflect normal science. If not, that will be my loss, since I tend to point people to this website regularly for good information on the science of global warming. But until this particular thread is overhauled, I'll have to settle for recommending people read this site as long as it concerns climate science, but warning them to ignore its invalid and superficial treatment of energy issues, which IMHO does nothing to advance understanding but rather threatens it.
However, I am confident that the site management understands exactly what I am talking about and is already considering how it will correct this article. It is simply inconceivable to me that someone is able to produce such a good informative website on climate change sciences as SkS is, while simultaneously allowing a faulty and baseless treatment of energy issues such as this article to pollute it for long.
Best regards and good luck to all,
Joris
-
sol6966 at 00:37 AM on 20 March 2013Science vs. the Feelies
don't know why my post appears 3 times, I only clicked the submit button once.
Moderator Response: [JH] Duplicate postings deleted. -
Mammal_E at 00:12 AM on 20 March 2013New Study, Same Result - Greenhouse Gases Dominate Global Warming
@Klapper: Correct. I order to make inference, we need to compare the relative correspondence between observed data and alternative models. Models without anthropogenic forcing do much more poorly at reproducing the observed trend trajectories (observed data WAY outside the squiggles) than models with anthropogenic forcing. It is also true that models without natural forcings perform poorly. Models combining both factors perform far far better. (http://www.skepticalscience.com/climate-models-intermediate.htm) Until someone can come up with a model lacking anthropogenic forcing that does comparably well, the inference we are left with is that anthropogenic forcing (dominated by GHG) is necessary to explain the observed trajectory. Coupling that statistical result with the physical mechanisms we understand about the radiative property of GHGs, inferring that GHGs are causing climate change is the only sensible one.
As for your "probably"s : (1) show me and (2) the same applies to the poorly performing models without GHGs
-
sol6966 at 00:11 AM on 20 March 2013Science vs. the Feelies
David Archer in his Climate 101 lecture series, lecture 12 on the water vapor & ice feedback, starting at around the 14th minute explaines what the runaway greenhouse effect is and why it happened to Venus and not the Earth.
http://www.youtube.com/watch?feature=player_detailpage&v=g6ljuqucaIg#t=835s
-
Klapper at 23:29 PM on 19 March 2013New Study, Same Result - Greenhouse Gases Dominate Global Warming
@Mammal_E #14:
If the mean height of Dutch women is 1.56 m +/-.02 at the 95% confidence interval, and the women is 2.00 m tall and the tallest Dutch women ever measured was 2.01 m, you can argue "its not inconsistent that the woman is Dutch", but that's not saying you have high confidence the woman is Dutch.
There is no statistical validity for claiming your GHG driven warming hypothesis, as implemented in the models, is confirmed because the observed trend lies "within the squiggles". (-snip-).
Moderator Response: [DB] Off-topic sloganeering snipped. -
Mars is warming
Thank you for a quick response, Tom!
Yes, it is meaningless to use photo sequences like that as proof of climate change on Mars unless the photos are taken close to one Martian year (687 days) apart. In the 2005 photo, the south polar cap (mostly frozen CO2) had been exposed to the midnight sun for nearly 6 months. No wonder it had almost disappeared!
-
Dikran Marsupial at 22:44 PM on 19 March 2013Lessons from Past Climate Predictions: Syun-Ichi Akasofu
MatthewL - it should go at least as far as testing, and should at least show some familiarity with the existing science that has a direct bearing on the question. In that case, Akasafu's paper fails on both counts, as far as I can see.
One of the problems with current scientific publishing is that far too much low quality science is published because of the "publish or perish" culture that pervades science. The vast majority of papers never achieve more than a handful of citations, often for good reasons. Thinner journals might not be a bad idea. -
Dikran Marsupial at 22:42 PM on 19 March 2013Lessons from Past Climate Predictions: Syun-Ichi Akasofu
MatthewL I didn't say that the 60 year fluctuation can be dismissed as a "wiggle", as it happens it is pretty well explained by known changes in forcings, as descirbed in the last IPCC WG1 report (you need both natural and anthropogenic forcings to explain the fluctuations). It has already been investigated, and while there is uncertainties involved, there is no good reason to invoke some unknown mechanism to explain them.
That doesn't mean that mainstream science does not have an open mind on the issue (ask e.g. Ray Pierrehumbert for example), it is just that the evidence for an oscillations is currently merely statistical, which is not very compelling. -
Matthew L at 22:40 PM on 19 March 2013Lessons from Past Climate Predictions: Syun-Ichi Akasofu
Dikran #61. Does every scientific paper have to go all the way from Observation to Theory before it bears publication? Sounds like a recipe for some pretty thin scientific journals to me.
-
Matthew L at 22:30 PM on 19 March 2013Lessons from Past Climate Predictions: Syun-Ichi Akasofu
Dikran #59
Well I found it interesting! Probably says more about me than the paper, probably because it chimed with my own statistical dabblings (mathturbation?).
I agree that simply saying it is recovery from the LIA without saying anything about the mechanism is not useful. I just ignored that bit and focused on the cycle on a trend bit. As I said earlier, what he does not point out is the accelleration in the rate of change, which is also obvious from the linear correlation charts.
I would dispute that a major ~60 year fluctuation can be dismissed as a "wiggle". I think it bears more serious investigation than that. Hopefully Glenn will be able to point me at some more informative research.
-
Dikran Marsupial at 22:26 PM on 19 March 2013Lessons from Past Climate Predictions: Syun-Ichi Akasofu
MatthewL - yes, he posited that the linear trend is due to a recovery from the little ice age and hence there is a possibility that the warming due to GHGs had been over-estimated. He provides nothing to substantiate that.
He does point out that there is an apparent cycle; however, as I pointed out, this is immediately obvious to anyone who has looked at the graph, but there is plenty of evidence from looking at changes in the forcings that the cycle is probably spurious and the result of a number of separate changes in focings that appear to give a cycle.Yes, "Observation > Hypothesis > Testing > Theory" is a common and reasonable model of the scientific process, however Akasafu has only done the Observation and hypothesis bit, but without testing and finding plausible physics, it doesn't justify publication, and is bad science when it is prematurely published.
-
Matthew L at 22:14 PM on 19 March 2013Lessons from Past Climate Predictions: Syun-Ichi Akasofu
Thanks Tom #57, points taken. I have learnt a lot from this dialogue. Certainly more than I have from the Daily Mail!
Dikran #56. Did Akasofu go as far as promulgating a theory? I thought he was just pointing out an apparent cycle (observation) and projecting it forward? (Albeit in rather fudged and vague way as Tom points out).
At Uni I was always told that science went Observation > Hypothesis > Testing > Theory. I don't think Akasofu got anywhere much beyond a rather incomplete hypothesis.
-
Dikran Marsupial at 21:59 PM on 19 March 2013Lessons from Past Climate Predictions: Syun-Ichi Akasofu
MatthewL, the problem is that Akasofu's paper is not a scientifically interesting thing to do. All he has really done is to point out that temperatures have increased over the last hundred years or so with some wiggles on the top, which is something that is immediately apparent just by looking at the graph. What Akasofus has not done is provide plausible reasoning to support that the observed linear increase actually is caused by a recovery from the little ice age, rather than a change in solar and GHG forcing. Neither does he provide a plausible cause for the 35 year oscillation, that explains why is is not caused by known changes in the focings.
-
Matthew L at 21:49 PM on 19 March 2013Lessons from Past Climate Predictions: Syun-Ichi Akasofu
Thanks Glenn, excellent post. Have you (or others) posted on this in detail elsewhere? I would be very interested in reading more.
Have satellites added much to our understanding of these global temperature fluctuations? Are they yet showing up the kind of north-south "beat" you describe?
I think one can be too hard on Akasofu. It was just one paper and it was an interesting thing to do, even if it had the taint of "denial" about it. His problem was saying that an interesting point on climate fluctuations and cycles somehow puts AGW in doubt, which of course it does not. It got so much attention because it was seized on so vigorously by the WUWT crowd.
It will be interesting to see how the attribution for the flatter temperature trend to volcanoes, solar and ENSO develops. It may be that ENSO, PDO and the Atlantic Multidecadal Oscillation are somehow expressions of that N/S "beat". Now we have Argo and satellites covering the southern oceans hopefully that will become apparent.
-
Tom Curtis at 21:37 PM on 19 March 2013Lessons from Past Climate Predictions: Syun-Ichi Akasofu
Matthew L @51:
1) Akasofu does not predict a neat sine wave. In fact, he never, in all three of his papers on the subject I have read goes so far as to make a numerical prediction at all. Instead he is vague about the nature of the cycle, and appears to believe it varies arbitrarilly in cycle length and magnitude. Without specification, so vague a model is consistent with any short term cycle. If, however, you try to treat him as actually makiing falsifiable predictions, and model his theory, the resultant prediction is fairing poorly.
2) Although the observed trend in GMST since 2000 is being very democratic, lying only slightly closer to the IPCC precition of 2006 than Aklasofu's predicition of 2009, it is possible to notice the short term effects that lie outside either prediction. If you do, and remove those effects, the resulting trend (0.16 C per decade) is very close to the IPCC prediction. In other words, even though Akasofu had three more years data to work with when he made his prediction, he is still doing far worse than the IPCC.
3) The IPCC does not predict a monotonic increase in temperature. The IPCC shows a prediction for the multimodel mean, but notes that short term fluctuations are large relative to annual increase in the mean so that short term negative trends (in some cases as long as 20 years, form the models) are to be expected. The IPCC does not explicitly predict those short term trends because they are essentially unpredictable. It only predicts that the short term fluctuations will exist; which is why it states it projections in terms of the change in mean temperature between distinct 20 year intervals.
This may seem like nit-picking to you, but ignoring these facts seems to me like fudging the issue so that Akasofu's unjustified and very poor prediction can seem to be fairing relatively well compared to that of the IPCC. It is not. The best that can be said for it is that he has made it so vague that it is not yet falsified.
-
CBDunkerson at 21:37 PM on 19 March 2013Watts Interview – Denial and Reality Mix like Oil and Water
You know, given the way that Watts and the rest of the denialati are trending towards claiming that, 'maybe there were magical temperature spikes of unknown origin in between the proxy data points and therefor maybe the current warming is just another of those magical spikes of unknown origin' I'd love to see a study showing a future temperature projection for 'immediate 0 emissions' and 'continued reliance on fossil fuels until they run out'. Both those should show the current temperature increase, however high it goes, being effectively 'permanent' and indeed slowly increasing as slow feedbacks (e.g. land albedo) cause mild warming to continue for hundreds to thousands of years. Thereafter temps would decline only at a very slow rate, similar to what Marcott showed for the past 8000 years per AGW, for thousands of years into the future.
That seems to be the part that they are still desperately trying to keep from the general public... the fact that the current temperature increase isn't just a brief spike that we can easily reverse. Rather, we have already vastly increased global temperatures for thousands of years into the future and are now just determining how inhospittable we will make the planet.
Basically, the problem with all the temperature charts is that they stop at 'now'. We need people to understand that 'now' is the best it is going to be for hundreds to thousands of years.
-
Dikran Marsupial at 21:26 PM on 19 March 2013Lessons from Past Climate Predictions: Syun-Ichi Akasofu
MatthewL wrote "Of course there are statistical methods to decide whether something is signal or noise. And it is open to anybody to do that analysis and refute Akasofu. That is what science is all about."
Statistical methods are not straightforward to use in this case, as the forcings are not approximately constant on a centennial scale. Akasofu's theory seems to be based on inappropriate use of overly simplistic statistics, whilts ignoring the physics (for instance changes in solar forcing, aerosols etc., never mind GHGs). I am a statistician, and I would find a phsyical model (i.e. a GCM) far more convincing than a statistical argument based purely on correlations, without even adequate statistical hypothesis testing (against a null hypothesis that is more than just a straw man).
Secondly, promulgating a theory based on statistical models, with no quantifiable physical basis, and putting the onus on others to refute it is about as far from "what science is all about" as you can get. In reality, if you want to promulgate a theory, the onus is on you to demonstrate that your theory provides a more plausible explanation of the observations, or better still that the observations are inconsistent with previous theories. Akasofu has not done this, which is presumably why his paper was published in an obscure journal. What science is all about is actually self-skepticism. -
Mammal_E at 21:23 PM on 19 March 2013New Study, Same Result - Greenhouse Gases Dominate Global Warming
@Clapper #11:
You are confusing statistics regarding the MEAN and statistics regarding individual observations. The mean of the model ensemble is what we think we would get if we had thousands of replicate Earths and averaged their trends over the same period. However, we only have one Earth. So, the proper comparison is not the observed trend with the mean, it is with the range of trajectories produced by the model ensemble -- that prediction interval is what the scatter of squiggles in fig. 2 shows. As long as the observed trajectory lies within the prediction interval, it is not inconsistent with our understanding as formalized in the models.
Think of it this way: suppose you measure a single person, and she is 2 m tall, and you want to ask if that person might be Dutch. You would not compare that measurement with the mean height of Dutch people or even the confidence interval on that mean (which gets vanishingly narrow with a large sample size), you would compare it with the overall spread of the height distribution in that country: the prediction interval. If it is within the prediction interval, you can conclude that the person's height is not inconsistent with their being Dutch. -
CBDunkerson at 21:18 PM on 19 March 2013A Detailed Look at Renewable Baseload Energy
JvD wrote: "A shift to 100% renewables would fall far short of delivering the 90+% decarbonisation we need to stop AGW."
A: We don't need 90%+ decarbonization to 'stop AGW' (to the extent that we CAN do so). The atmospheric CO2 level will stabilize if we decrease CO2 emissions by ~50%. Yes, accelerated warming would then continue for a few decades and gradual warming for centuries. However, even getting down to 0% emissions would just decrease the accelerated warming period. There is nothing we can do (short of geo-engineering) to prevent long term gradual warming from albedo shifts.
B: A shift to 100% renewable power would, by definition, mean 100% decarbonization.
Also: "Intermittent renewables become more expensive to integrate as their penetration increases because greater and greater fractions of produced energy have to be dumped (curtailed)."
Ah, so you arrive at your conclusions by making the assumption that excess renewable power will simply be 'dumped', unused. That is, of course, ridiculous. Why would we just 'throw away' all of that energy rather than transmitting it from areas that are currently producing excess electricity to areas that are currently producing insufficient amounts? OR storing the energy for use later? Or both?
Yes, if you make irrational assumptions you can show ANYTHING. That doesn't make it any less irrational. By the same logic we could argue that nuclear power is unworkable because if you paved the streets with nuclear waste we'd all be irradiated. What's that? Paving the streets with nuclear waste would be stupid? Indeed, but no less so than "dumping" all excess renewable power.
-
Glenn Tamblyn at 20:57 PM on 19 March 2013Lessons from Past Climate Predictions: Syun-Ichi Akasofu
Just a few points to throw into the topic.
To detect a cyclical pattern one needs more than 2 cycles. Otherwise all you can say for certain is that there were 2 events. In fact one can probably do a statistical confidence test for the existence of a cyclical pattern, just as one does when looking at other data and the level of confdence in what you find will be related to the length of the data set.
And if there is a cycle, it should have some sort of reasonably steady periodicity.
Next, when looking at the Surface Air Temperature Record (SAT) it is so easy to forget that it is the composite of changes from all over the globe. Does each point on the graph (or in a cycle) correspond to the same degree of change in all locations around the world? Or is it a mix of some change in one region and quite diffferent patterns of change in other regions?
GISS do a much better job than the other SAT teams at providing tools to allow people to explore the temperature record. They have one graph that doesn't get nearly as much attention as it deserves. This is a plot of temperature anomaly (as colours) plotted against latitude and time. So how temps have varied in each latitude band over time. It is sort of a 1/2 way house between the global SAT graphs we are all used to, and the maps of Temp anomaly that give a snapshot of the world at one instant.
Unfortunately with whatever troubles GISS have had with their server, this graph isn't available at present. Keep an eye out for it's return, it is worth it.
What it shows is that the 1930's/40's warming was partly ocean warming. However some of this was likely due to biases in the measurement of SST's from ships because of differences in how it was done and the impact that WWII had on the mix of nationalities taking those measurements - the latest Hadley SST data set attempts to correct for these biases.
The remainder of the warming was substantially Arctic warming, not global. Consider the following. We have had high warming in the Arctic recently; Sea ice is vanishing, and indications are that recent extreme weather events in the NH may be related to these changes through their impact on the Polar Jet Stream. During the 1930's there seems to have been Arctic warming. Sea ice areas were lower than in later decades (although nothing like what is happening now). And weather extremes may have been involved - the droughts that contributed to the dust-bowl years in the US for example. Perhaps a similar pattern to what we are seeing now, although now is more extreme.
So if there is a cycle, the data suggests it is more likely to be a cycle in the Arctic, rather than a cycle for the whole planet.
There is an important caveat to this. Station coverage. Until the 1920's there was no coverage in the high Arctic. Then, only slowly, did a few stations appear; this was driven by the USSR engaging with it's vast Siberian wilderness, adding stations across Siberia, and then WWII and the addition of stations across the Canadian Arctic & Greenland. The point is that at exactly the time that the physical observations suggest a warming was happening in the Arctic, the station coverage up there was in flux. I'm not talking about going from 50 stations to 100, more like 2 to 10. So biases due to fluctuating station coverage cannot be ruled out.
One possible cycle that has been suggested at times is a fluctuation between the Arctic & Antarctic, possibly with a 60 year cycle. However we hit another problem trying to look for this in the SAT data; decent coverage in the Antarctic lagged behind the Arctic. We didn't really get reasonable station coverage in the Antarctic until the 1950's, particularly the International Geophysical Year in 1957. So the evidence we might look for to compare the north and south polar regions isn't available.
If we then wish to look back before the 1920's, for a possible earlier cycle according to Akasofu, station coverage gets worse at higher latitudes - in fact in many regions. If there is a polar cycle, and we have no data on the polar regions from the 19th century, how can we tell whether there was or not.
My take home from that is that if one wishes to look for patterns in the SAT data going back before the 1950's, one needs to take these changes in station coverage very seriously in evaluating the past record. At a minimum, to do an apples vs apples comparison, one should only use data from regions where there is adequate station coverage over the entire period one is studying. Akasofu (and others who engage in similar analyses) aren't doing this! And that is ultimately mathturbation. Clever numbers games that shed very little light. Which is a pity because there may well be real insights to be gained from an appropriately careful study of the data.
That said, could there be a cycle that fluctuates between Northern and Southern hemispheres? Yes, quite plausible. Even the most casual observation of fluid mechanics shows that in seemingly chaotic fluid flows there are often 'beat' phenomena; quasi oscillations that have a rough periodicity - vortex spins off to the left, vortex spins off to the right, vortex spins off to the left ....
So too that is possible here. But the key point about why it is possible is that it would happen most easily due to a 'beat' in ocean currents; that is where most of the heat is, so small changes in the flow in these currents could have much bigger impacts on SATs.
The worlds oceans have 2 major axes. North/South along the Atlantic, and East/West across the Atlantic/Indian/South Pacific. The North Pacific is more contained because the Bering straight is tiny. So any 'beat' that influences currents in the Atlantic could easily have large regional climate impacts between the hemispheres.
Really the North Atlantic basin is about the worst region in the world for us to look for evidence of global changes due to how easily local climate can vary because of the shape of the ocean basins, even if globally it doesn't vary much. But the North Atlantic Basin looms large in our (western) imagination and psyche's - Vikings in Greenland anyone?
But what we have now, that we don't have for earlier periods, is data on the oceans as well. Not enough yet to see cycles, we need another century of that. But enough data to know that heat accumulation in the oceans - where 90% of the extra heat is going - is so large that there is no terrestrial heat source large enough to have supplied it.
Akasofu's cycles might exist, there just isn't enough data to say that with any confidence. But the underlying trend is clear, and definitely extra-terrestrial in origin. And when Akasofu (or others) make claims for these cycles, if one doesn't see an attempt to drill down into the data to remove time based biases, then I would call their analysis suspect at best.
Something has screwed with the Earth's energy balance with space in the last 1/2 century. No other conclusion is possible from the data! That ain't cycles.
-
michael sweet at 20:01 PM on 19 March 2013A Detailed Look at Renewable Baseload Energy
JvD,
You have considered only the absolute worst case analysis for wind. Of course if we only look at the worst case it looks difficult. Real world analysis suggests that it is unlikely that the entire Eurozone would be windless at the same time. Here in Florida the local power company has wasted over $5 billion US on nuclear in the last 5 years with nothing to show but a radioactive waste dump they have to pay to remove. How does that look for cost effectiveness compared to wind? If some solar was used (as currently employed in Germany), the solar all comes on during the highest usage during the day. A small amount of solar would substantially lower the required wind. Can you imagine that engineers could devise storage of energy? I can. Someone suggested recently on this site that the hydropower in Norway alone could back up wind in the entire Eurozone for a week of no wind. Perhaps big users could be convinced to use less energy on days with little wind. You cannot concieve any other method of storing energy?
You have not addressed my comment about safety of nuclear power in war zones. I have never seen that argument addressed by nuclear supporters. Nuclear cannot possibly power the entire world if all possible future war zones have to be avoided. Where in Africa will you site your nuclear power plants to power the entire continent?
Your argument against renewables is completely bankrupt. You have provided no links to peer reviewed science. You claim that your analysis is better than the consensus IPCC position, with no supporting data. I doubt that you really design energy systems.
-
Matthew L at 20:00 PM on 19 March 2013Lessons from Past Climate Predictions: Syun-Ichi Akasofu
Thanks for biting Leto! I thought that challenge was sharp enough to elicit a snap-back ;-)
Well sunspots had been observed long enough for the periodicity to be blindingly obvious before 1800. The actual reason was only discovered around 30 years ago and even today is not fully understood. I am not sure if there were alternative explanations put forward, but they would have been nonsense, of course, particularly as they did not even know what sunspots actually were for most of the time they were observed. Certainly it was possible to predict an approximate periodicity long before the cause was known.
The early stages of any scientific endeavour are about observation. Sometimes it is possible to make predictions based on observation without making a hypothesis. Validation by prediction is a vaild way to determine if a pattern is real before you even attempt to explain it.
Hypothesis is the second stage. It is not a "scientific" requirement to append an explanation to every set of observations. Surely it is better to say "no idea why this is happening" than to offer a pointless and arbitary explanation just because you feel that you won't get published unless you do.
Re your last paragraph, "pointing out the wobble" IS science, early stage and incomplete of course, but NOT pointing out the wobble, or dismissing it out of prejudice might mean missing something important.
Of course there are statistical methods to decide whether something is signal or noise. And it is open to anybody to do that analysis and refute Akasofu. That is what science is all about.
I would have a go, if I knew how. Perhaps you would care to?
-
Leto at 19:24 PM on 19 March 2013Lessons from Past Climate Predictions: Syun-Ichi Akasofu
Mathew L wrote:
If you ignore this point again I will assume you concede it.
You assume wrong. I suspect that there was so little intellectual meat on this particular bone that none of the regular commenters could be bothered responding.
Maybe you could flesh out your sunspots analogy with some detail. How many cycles were observed before the hypothesis of periodicity was raised? Were there alternative explanations available?
There is a vast literature on time series analysis, and there are statistical techniques for deciding whether an apparent pattern is sufficiently different from random noise to represent a worthy object of further study. As far as I can tell, Akafosu has not even paid lip-service to those tried and tested techniques. Merely pointing out a wobble in the noise that looks a bit like a couple of sine waves is not science.
-
Matthew L at 19:14 PM on 19 March 2013Lessons from Past Climate Predictions: Syun-Ichi Akasofu
I did it again! I must put Akasofu into my spell checker. Also in my second last paragraph the phrase in brackets should ideally have read "(if maybe not as rapid as they predict before the end of this century)". Yes, I do know what "exponentially" means :-)
-
JvD at 19:14 PM on 19 March 2013A Detailed Look at Renewable Baseload Energy
"JvD,
here you claim that renewables cannot be built higher than nameplate capacity compared to usage because occasionally some power would not be used. All current fossil and nuclear capacity is desigend overcapacity and much capacity goes to waste. Why do you think they subsidize night time load balancing? I thought you claimed that you designed power systems. You are claiming we cannot build renewable power to the current fossil standards! You need a consistent argument."
The required firm capacity in a power system of the size of the EU to guarantee system stability is about 30%. So you need 130% of of firm capacity. The EU currently has a peak electric demand of about 800 GW. So about 1000 GW of firm capacity is needed. In terms of fossil or nuclear plants, this amounts to about 1000 GW of nameplate capacity. In terms of wind, the figure would be about 13.000 GW with more than half of the generated electricity being curtailed. Even if wind turbines themselves where free, it would be too expensive. Is this not easy to see?
-
JvD at 18:58 PM on 19 March 2013A Detailed Look at Renewable Baseload Energy
The following paper written up under auspices of the EU commission sheds more light on the problem with intermittent renewables. Being aware of such publications which pose hard questions to a rosy view of intermittent renewables as being able to provide baseload power is crucial.
Assessment of the Required Share for a Stable EU Electricity Supply until 2050Excerpt:
"The policy implication of this analysis is that there are significantly increasing costs associated to the deployment of intermittent generation technologies in the EU-27, and in that sense limits to further deployment. If the cost of integrating intermittent generation was to be limited to about 25 billion EUR per year, no more than about 40% of intermittent generation can be integrated in the European power market. The final choice of an acceptable cost increase will be a political choice."Please also look carefully at the chart on page 8 which illustrates the problem in a nutshell. This problem is not adequately addressed by SkS, which in my view constitutes a fatal flaw in the SkS treatment of the subject matter. Worse, IPCC, WWF and Greenpeace also ignore this problem, which means those organisations are critically undermining our chances of stopping AGW, though not for want of good intentions. As is goes: "The road to hell is paved with good intentions".
-
Ray at 18:45 PM on 19 March 2013Watts Interview – Denial and Reality Mix like Oil and Water
This is to the Moderator DB My sincere apologies for my post 103 and your comments are perfectly justified. I posted a comment early this morning (see 101) but it did not appear as it usually does. I rewrote and reposted a little later (post 103) and again the post did not appear. My thinking then was perhaps the site does not permit more than 100 posts so that is why they "vanished" and I left it that. Again my apologies and I can well understand you taking me to task for my second post
-
JvD at 18:44 PM on 19 March 2013A Detailed Look at Renewable Baseload Energy
@KR. Note that I am not saying that it is technically impossible to power the world with intermittent renewables. I'm saying it would be economically impossible. Ignoring energy costs is not the way to proceed. Intermittent renewables become more expensive to integrate as their penetration increases because greater and greater fractions of produced energy have to be dumped (curtailed).
A shift to 100% renewables would fall far short of delivering the 90+% decarbonisation we need to stop AGW. Long before this 90+% is reached, the costs of further decarbonisation would rise exponentially. Even if solar panels and wind turbines were free, the costs of adding additional panels and wind turbines would rise (too) far above the cost of simply burning more fossil fuels, once critical penetration levels are exceeded.
You discredit Ted Trainer because he assumes the limit for wind at 25%, versus some others who claim 40% for the UK. This is nit-picking. The point is that electricity supply has to be decarbonised by at least 90%, so whether we reach 25% or 40% in some region with wind is irrelevant. There will always be a large residual need for either fossils or nuclear. My suggestion is we use nuclear, because otherwise it will be fossils and AGW or blackouts.
Anyone who seeks to destroy nuclear power while being under the illusion that solar panels and wind turbines are convenient drop-in replacements for nuclear power plants is inadvertantly dooming our chances of achieving a decarbonsed energy supply. He is also an unwitting tool of the fossil fuels sector. The fossil fuels sector *love* the growing infighting between the various low carbon energy technologies wind, solar and nuclear. It is a great achievement of them that the have managed to frame nuclear as the enemy of wind and solar. In fact, nuclear is the enemy of coal. Wind solar and nuclear together can destroy coal and gas. But not if they are infighting, which is what fossil fuels pushers love to see. -
Matthew L at 18:39 PM on 19 March 2013Lessons from Past Climate Predictions: Syun-Ichi Akasofu
I notice that nobody has commented yet on my main point that it is perfectly reasonable for somebody to point out an apparent natural pattern, or cycle, without knowing or hypothesising a cause.
Were the early solar astronomers "solarstrologers" when they spotted the sun spot cycle?
If you ignore this point again I will assume you concede it.
Thanks Tom and MA for pointing out that the trend is roughly between the IPCC and Akasofu. Very diplomatic of it! My only remaining point in Akasofu's defence is that at least he predicted a falling rate of change in the short term whereas the IPCCs rate of change rises almost montonically (with wide error/noise bands) and exponentially.
In the long term I suspect the IPCC is going to be right that the change will be exponential (if maybe not as rapid) but what the Akafosu study suggests is that we may see fluctuations of a much larger extent, more regular and of longer duration than is output from the current crop of current climate models. However I think his saying that the fluctuations will be a regular sine wave is leaving himself a hostage to fortune almost as much as making precise predictions of future global temperatures.
It is important that papers like the one from Akasofu get published. There is an "apparent" cycle. Whether it is real or an artifact of noise needs to be studied and debated. I think his talents were very well employed!
-
bill4344 at 18:29 PM on 19 March 2013Lessons from Past Climate Predictions: Syun-Ichi Akasofu
That's right - I'm not in html land anymore!... ;-)
-
bill4344 at 18:28 PM on 19 March 2013Lessons from Past Climate Predictions: Syun-Ichi Akasofu
I agree that climate change is real
Ah - code-phrase alert: I'm going to wonder if you believe <i>anthropogenic</i> climate change is real, and, further, whether you accept that those anthropogenic emissions are the chief cause of the current warming.
Finding something 'hysterically ironic' and damning all the comments on the article seems more than a little over-wrought.
-
Glenn Tamblyn at 17:44 PM on 19 March 2013February 2013 Arctic Sea Ice Death Spiral Update
Then there is the huge arc of ice fractures building up acros the Canadian arctic as we speak. This has been developing for several weeks, starting in the Chukchi and then Beaufort seas. It has now spread across the top of the Canadian Arctic islands and is now fracturing above Greenland, starting to merge with the existing fracturing around the Fram strait. And some of those fractures are within kilometers of the pole.
Some fracturing always occurs but this is extensive and perhaps unprecedented. And importantly, it is virtually all of the remaining Multi-Year Ice that is now fractured. With the right weather conditions over the next 6 months a lot of the remaining MYI could get moved to warmer waters.
Neven is covering this in more detail on his Arctic Sea blog crack-is-bad-for-you-and-sea-iceHere are some images:
This is above Greenland(right) and Ellesmere Island (left)
-
scaddenp at 17:21 PM on 19 March 2013Lessons from Past Climate Predictions: Syun-Ichi Akasofu
Labelling is always something of a problem, but calling someone a denialist seems accurately descriptive. Its a term for someone who denies the scientific evidence. Tree hugger is an epithet for an environmentalist. Its a bad error to confuse concern about the changing climate for environmentalism, especially when you mean environmentalism as a value system. Furthermore claiming use of WfT index as tree-hugger or cherry-picking is plain bizarre. On the other hand, "eric the red" and his other sock-puppets havent exactly been beacons of clear thinking here.
Climatastrology is a term for predicting future climate without a physical basis. Yes, its an another insulting epithet, but are you really supposed to take seriously theories that ignore the physical factors affecting past climate in preference for some wishful "natural cycle". Its bad maths, bad science and needs to be labelled as such.
On the hand I agree that I am quite sure akosofu put a lot more thought into his original article than the commentator or me into the comments, but its shame his talents were not more usefully employed.
-
Auslin at 16:52 PM on 19 March 2013Lessons from Past Climate Predictions: Syun-Ichi Akasofu
I agree that climate change is real, but the comments on this article show even less thought than akosofu's original article.
I find it hysterically ironic that the person who finds it patently offensive to use the term tree hugger, even saying it is elitest, then uses the term climastrology, and gets high fives from Dana for using it. Also interesting that the terms denialist and denier were used, but does not seem to offend Dana the way tree hugger did. Pot, meet kettle.
-
Glenn Tamblyn at 16:43 PM on 19 March 2013February 2013 Arctic Sea Ice Death Spiral Update
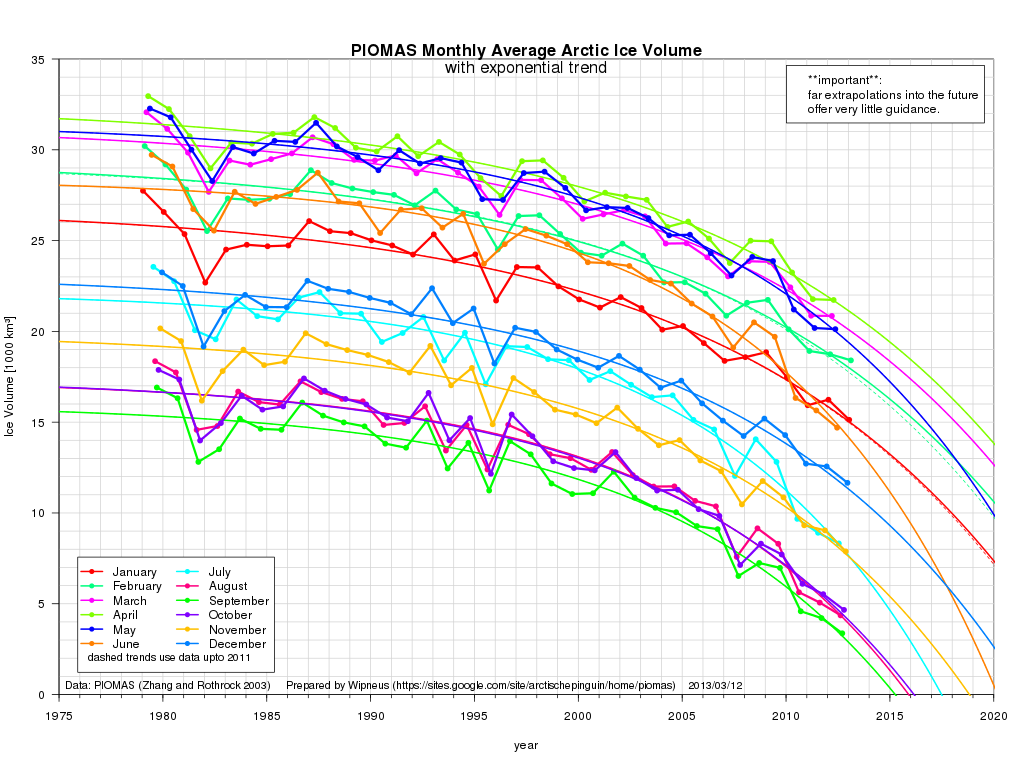
Then there is this graph from Wipneus at Arctic Penguins. He has looked at a number of regression curve fits to the data on ice volume and found exponential fits are the closest. Here is the data for each month and overlayed on top, the exponential curve fits. If things continue on their current trend, Santa drowns in 2015. And by 2016 the Arctic is ice free for 3 months of the year.
It doesn't matter which variation of a graphic you use, they all show the same thing. The Arctic sea ice is exiting stage left...
-
Bob Lacatena at 13:56 PM on 19 March 2013Watts Interview – Denial and Reality Mix like Oil and Water
Ray, to restate what I think DSL's main point was, your mistake is that you think there are two types of people, those who trust Watts and those who don't. But those two groups make up a very small segment of the population. There is always a much larger segment of the population outside of those groups; people who are unfamiliar with the climate issues, those who are uncertain, those who are uninvested, and more.
SkS is meant to serve exactly those people. SkS provides a source of reliable and consistent information, based on the actual state of the science, rather than poppycock and nonsense fabricated to give an illusion of truthiness.
So what purpose does this post serve? It exposes Watts' hypocrisy and idiocy to people who might otherwise stumble into Watts' site and be led to believe that the guy has a clue about anything, or is to be trusted in any way.
-
DSL at 13:04 PM on 19 March 2013Watts Interview – Denial and Reality Mix like Oil and Water
Ray, you seem to assume that there are two groups of people: those who trust Watts and those who trust SkS. No. WUWT is allegedly a popular blog. It also (somewhat systematically) feeds a number of mainstream news sites. Watts influences public opinion. Not a day goes by that I don't get someone out in the internets trying to feed me a link to WUWT in defense of some bizarre claim (e.g. "16-year trend = no global warming"). Watts even made it onto PBS--not because he's an expert, but because his site is popular. It is a primary source of the faux debate. WUWT misinforms the democracy. Watts could care less about scientific progress. His goal is to smear grease on the glass between science and political will. Note that SkS is a defensive site. Little original science is published from its regulars. Instead, commenters present, defend, and argue about the published science. The linkage to the published science on this site blows away--a massive understatement--that of any other climate site on the net. WUWT publishes a great deal of original "science" that is strictly designed to attack mainstream climate ideas perceived as foundational (e.g. surface temp trend explained not by CO2 but by unknown physical mechanism with 65-year cycle). The weak methodologies of these publications are hidden by biting and inflammatory rhetoric. And it works really, really well. Very little published climate science is linked at WUWT--except when it's the target.
-
Ray at 10:47 AM on 19 March 2013Watts Interview – Denial and Reality Mix like Oil and Water
Thanks for the reply Dana but I still don't get it. (-snip-)
Moderator Response: [DB] You have registered your dissatisfaction. Re-pressing the point crosses the line into ergot repetition and sloganeering. -
Watts Interview – Denial and Reality Mix like Oil and Water
Ray - If you look at the stated purpose of SkS (About Skeptical Science), you will see that correcting the misinformation of climate denial is its core. Watts certainly isn't a climate scientist, his (mis)information is almost invariably incorrect, and even those defending him can't claim good quality - yet he gets air time on Fox, and considerable traffic on his website. He is a serial presenter of denial myths who has an audience.
It's entirely appropriate to point out the contradictions and fallacies when someone like Watts is making public statements.
-
Ray at 10:23 AM on 19 March 2013Watts Interview – Denial and Reality Mix like Oil and Water
Dana@99 Thanks for the reply Dana but what interest is an interview of Anthony Watts to those that read Skeptical Science. I accept yhat your answer could, very reasonably. point to the number of comments generated but these by and large, are merely supporting and confirming one another's opinions so I'm not sure what it was that was hoped to be gained. Personally I didn't read much of it for the little I did read added nothing to my understanding of climate change and as Anthony Watts is hardly a climate scientist, agreed he doesn't claim he is, his views carry little weight in the mainstream community of climate scientists. Sure his shortcomings, at least those perceived to be shortcomings by those that wrote the piece, were well aired but to what avail? Those who believe what Watts says are unlikely to read this post and so will continue on in their ignorance while those who don't believe what Watts says will have their beliefs confirmed. Sorry , still don't get the point of it
-
Tom Curtis at 09:58 AM on 19 March 2013Mars is warming
HK @40, you raise a very good point. It is likely that most of the differences between polar cap size in Mar's observations will be due to seasonal cycles, something Nahle has failed to consider (along with the majority of the evidence on the changes in the size of Mars's icecaps over time.
-
Jonas at 09:55 AM on 19 March 2013February 2013 Arctic Sea Ice Death Spiral Update
There is also an interesting graphics on EPI (Earth Policy Institute, Lester Brown):
http://www.earth-policy.org/data_highlights/2012/highlights31
(can also be found here on sks: http://www.skepticalscience.com/record-arctic-sea-ice-melt-to-levels-unseen-in-millennia.html ):

-
EliRabett at 09:10 AM on 19 March 2013Watts Interview – Denial and Reality Mix like Oil and Water
One would expect that for the same underlying trend the three slopes would be very close to each other if not exactly the same.
-
Doug Hutcheson at 08:38 AM on 19 March 2013Water vapor is the most powerful greenhouse gas
Further to my comment above, Radio National have come back to me. I was wrong to attribute the comment to Pielke Jnr: it was actually Lindzen. From the transcript:
"Richard Lindzen: My own particular research on this topic has dealt with water vapour, for a very simple reason; water vapour itself could account for 98.5% of the present greenhouse effect. It's the giant greenhouse gas, and in fact no model would give more than about 1° warming for a doubling of CO2 unless it had water vapour amplify it. And so we've been looking at how they deal with water vapour.
And they don't have the physics that we know accounts for water vapour, they are having numerical errors all over the place. So here you have the major greenhouse gas, you're worrying about something that's in the 1% region, and you're getting the thing that is 98.5% totally wrong, 100% errors.
We've been doing some studies on it, and I strongly feel that water vapour in fact is acting in the opposite direction from what the models suggest, and according to our calculations it should keep the warming for a doubling of CO2 down to about two-tenths of a degree. You couldn't tell that from natural variability."
So, warming from a doubling of CO2 amounts to two tenths of a degree, if the good Professor does not have his facts bass ackwards. There, don't you feel safer now?
-
Mars is warming
Tom Curtis #29:
If all the photos in your figure 3 were taken close to opposition (when Mars is closest to the Earth), each of them must have been taken about 780 days later than the previous one, or one Martian year plus 93 days. That is like taking photos of the Earth with 415 days intervals or 50 days later every year.
Based on the surface markings it seems to me that the photo from 2001 must have been taken close to northern hemisphere autumn equinox on Mars, corresponding to late September on Earth.
That means that the photos from 1995, 1997 and 1999 roughly corresponds to late April, mid June and early August respectively (spring and summer in NH), while the photos from 2003 and 2005 corresponds to early November and late December (spring and summer in SH).
In other words, the changes in this photo sequence are simply caused by the seasons, and have nothing to do with any climate change on Mars!
I wonder how this guy Nasif Nahle would explain away that?
-
scaddenp at 07:06 AM on 19 March 2013New Study, Same Result - Greenhouse Gases Dominate Global Warming
Come on. Science always investigates what is unknown. The settled bit is that increasing GHG in atmosphere will change climate. Unsettled is things like understanding and predicting short-term variations (eg ENSO); source and relative strength of past forcings; the value for climate sensitivity; etc etc. For gravity - well what is the mechanism? Why the equivalence principle? Do gravity waves exist? (and similar questions around reconcilation of general relativity and quantum mechanics).
-
dana1981 at 06:37 AM on 19 March 2013Watts Interview – Denial and Reality Mix like Oil and Water
Ray @98 - the post is about an interview of Watts in the mainstream media, not about content on WUWT, which I agree is not even worth debunking.
-
dana1981 at 06:28 AM on 19 March 2013New Study, Same Result - Greenhouse Gases Dominate Global Warming
Clyde - not sure why you think a correction is needed. Aerosols are the main negative anthropogenic forcing.
-
Klapper at 06:27 AM on 19 March 2013New Study, Same Result - Greenhouse Gases Dominate Global Warming
@dana1981 #4:
Natural variability should be smoothed out over the period I'm discussing (1910 to 1945 or 36 years inclusive). I checked the trend 1910 to 1945 inclusive on your trend calculator for all 3 SAT datasets: answer is 0.15 to 0.14C/decade +/- .04, meaning the minimum temperature trend in that period is about 0.01C/decade.
Using data from the KNMI data explorer website the model ensemble mean of the CMIP3+ runs for the 20th century, the trend is 0.05C/decade. What do you think 2sigma is on that trend? We use the term "within the model envelope". Are you saying that the model envelope is equivalent to 2 sigma on our best guess at the model generated warming rate for this time period?
This is a tricky question but I think the answer to my last question is no.
-
Ray at 06:22 AM on 19 March 2013Watts Interview – Denial and Reality Mix like Oil and Water
Thinking about this particular topic, what on earth was the point of discussing WUWT on this blog? Everyone, well nearly everyone, here dismisses WUWT as risible rubbish and regards Anthony Watts as a complete charlatan. Conversely, most of those that don't are highly unlikley to consider accessing Skeptical Science and should they do so are likely to get short shrift Why then give him traction?
Prev 937 938 939 940 941 942 943 944 945 946 947 948 949 950 951 952 Next


