


 Arguments


Recent Comments
Prev 965 966 967 968 969 970 971 972 973 974 975 976 977 978 979 980 Next
Comments 48601 to 48650:
-
Sapa at 07:16 AM on 15 February 2013It's the sun
composer99
I posted this link to a serious study of solar activity from evidence found in ice cores. It is relevant as it is documented data taken from the last millenia of solar activity.
The authors concluded "In conclusion, we have presented here a new reconstruction of solar activity on the millennium time scale based upon a description of the related physical processes. It implies that the present high level of sunspot activity is unprecedented on the millennium time scale. The results will be the subject of further analysis."
Moderator Response: [DB] Note that Tom Curtis has already responded to you on this back in December, here. Any further discussion of it should be done at the linked page. -
Composer99 at 06:50 AM on 15 February 2013We're heading into an ice age
Kevin:
Wine production appears to have been more-or-less continuous in the UK since the Roman invasion, albeit patchily implemented at commercial scales and vulnerable to sociopolitical changes.
As far as I am aware (courtesy of a survey of the Met Office and Environment Canada sites), the UK, and in particular southern England, has had, for some centuries, a climate that is comparable to current wine-growing regions in southern Ontario and British Columbia, despite being at a comparatively higher latitude.
IMO the significance of Roman viticulture in the UK is overstated in the context of climate change discussions.
-
16 years - Update and Frequently Asked Questions
Something I pointed out on JoNova, where this silly 16 year claim rose once again (sigh)...
Examining any time-span starting in the instrumental record and ending in the present:
- Over no period is warming statistically excluded.
- Over no period is the hypothesis of "no warming" statistically supported WRT a null hypothesis of the longer term trends.
- And over any period with enough data to actually separate the two hypotheses – there is warming.
-
william5331 at 05:48 AM on 15 February 2013A Glimpse at Our Possible Future Climate, Best to Worst Case Scenarios
The true climate sensitivity value is of course very important to know. However we may be calculating a false low value if Gaia is "fighting" temperature rise, making it look as if the value is low. We may only know the true value following a couple of tipping points in which temperature rises much faster than the Climate sensitivity value would suggest. We may have the value pretty well right but temperature will rise in steps. The first such step may be in the near future when each year the Arctic ocean becomes ice free earlier and earlier in the summer. Over relatively few years, our met stations will record non linear increases in temperature but taken over a large time period, we will then have a pretty accurate estimate of climate sensitivity. Of course, one tipping point will likely trigger the next one. The second tipping point is likely to be from a vast increase in the release of methane.
-
Dikran Marsupial at 04:25 AM on 15 February 2013We're heading into an ice age
Kevin There are plenty of historical precedents for civilisations not surviving climate change (e.g. Egyptian Old Kingdom). At the time of the LIA, global population was much lower, and agricultiral land less over-exploited, which made adaption very much easier than it is now. There are large parts of the world that are relatively poor, where large populations exist with marginal subsistence agriculture. Adapting for us will be much easier than it will for them. There is also the point that the rate of change is also relevant to adaption. Even then the LIA caused great hardship for many, the natural climate change we can do little about, but that doesn't make it O.K. to cause some more for ourselves.
The point is that questioning whether there is a perfect temperature for the Earth is a straw man - nobody is claiming that there is one, and it isn't really relevant anyway, it is the change that is important.
Now if you have evidence to show that we will have no problem adapting to the projected climate change, then I am sure there is a relevant post at SkS on which to discuss it, but this isn't it.
The post to which I responded is still there (at least I can still see it).
-
lstoessl at 04:22 AM on 15 February 2013A Glimpse at Our Possible Future Climate, Best to Worst Case Scenarios
When we talk about worst case scenarios, why do we not talk about the contribution of permafrost, methane hydrate release, forest depletion etc. It is as if since our models don't incorporate those contributions, they don't exist. Certainly, they will be major contributors to CO2 release and warming in the near time frame.
-
Composer99 at 04:18 AM on 15 February 2013A Glimpse at Our Possible Future Climate, Best to Worst Case Scenarios
MartinG:
Since your last paragraph has been reinstated, I should like to re-visit the assertion you made, that a "polarised debate is misleading the public into apathy".
Most recent examination of public opinion on the matter (e.g. here or here) suggests that public opinion in the US has been rebounding steadily. Perhaps other countries have had differing trends.
As far as I can see, unless you can show a consistent response in public opinion polling to the degree to which discussion/debate between environmental activists and/or science advocates vs self-styled skeptics is polarised or inflamed, I do not see how your claim is defensible.
-
Daniel Bailey at 04:12 AM on 15 February 2013We're heading into an ice age
"During the Roman optimal, wine grapes were grown in Great Britain"
Prove it. We await the links to the reputable sources.
-
Kevin8233 at 04:10 AM on 15 February 2013We're heading into an ice age
the appearance issue was regarding my second post, sorry about that.
-
Kevin8233 at 04:07 AM on 15 February 2013We're heading into an ice age
A reasonable answer to that would be "the perfect temperature of the Earth is that to which our civilisation (and especially agricultural practices) has become highly adapted".
OK. But then, the LIA was quite cold, and people adapted, agriculture adapted, but at cost (which is part of your point - in other direction but applicable). During the Roman optimal, wine grapes were grown in Great Britain. During the Medieval Warm period, grains were reported to be much more bountiful.
On another note, how is it that you were able to respond to my post, yet my post does not appear?
-
Dikran Marsupial at 03:57 AM on 15 February 2013We're heading into an ice age
Kevin You might find this paper interesting, the question of the regularity of glacials is apparently not quite as straightforward.
As to the question "Who decided that the temp after the industrial revolution was the "accurate" temperature the earth should be at, and that we are exceeding that perfect temp?", that really is a canard that has been answered here repeatedly.
A reasonable answer to that would be "the perfect temperature of the Earth is that to which our civilisation (and especially agricultural practices) has become highly adapted". It is the change in climate that is the principal problem, as adapting to change has costs. It seems likely that mitigation will reduce the cost of adaptation, so that would appear to be the rational strategy. It isn't rocket science.
Do you accept that answer? -
Kevin C at 03:22 AM on 15 February 2013The Japan Meteorological Agency temperature record
CC: The trivial answer to the adjustment nonsense is to calculate temperature series from the unadjusted data. NOAA has done it, Zeke has done it, you can do it with the SkS temperature calculator here, you can do it with Caerbannog's software.
Note the update to the post above.
-
citizenschallenge at 02:41 AM on 15 February 2013The Japan Meteorological Agency temperature record
Oh wow, I like the new comments window - nice job guys
~~~~~~~~~~~~~~~~~~~~~~~~~~~~~~~~~~~~~~~~~~~~~~~~~~
Kevin,
Anthony's kids have been having fun with this and I was wonder if you cared to comment on the "sudden divergece" of the JMA graph around 1990, which WUWTzers seem to think is extremely significant... now they are waiting - soon the other temp sets will be going down too. Oh and if the JMA's data starts returning to the other three, that will be sure sign of the conspiracy.
http://wattsupwiththat.com/2013/01/31/japans-cool-hand-luke-moment-for-surface-temperature/
So, it appears that Japan’s Meteorological agency is using adjusted GHCN data up to the year 2000, and from 2001 they are using the CLIMAT report data as is, without adjustments. To me, this clearly explains the divergence when you look at the NASA plot magnified and note when the divergence starts. The annotation marks in magenta are mine: {...}
If anyone ever needed the clearest example ever of how NOAA and NASA’s post facto adjustments to the surface temperature record increase the temperature, this is it.
~~~~~~~~~~~~~~~~~~~~~~~~~~~~~~~~~~~~~~~
-
funglestrumpet at 02:35 AM on 15 February 2013A Glimpse at Our Possible Future Climate, Best to Worst Case Scenarios
All well and good, but one has to wonder if it might be best to just give in and let the environment go to hell. I jest, of course, but honestly, today the BBC had a programme dealing with ice ages (In Our Time @ 09.00 on Radio 4, available on BBC iPlayer), which really made me want to scream.
It was all very interesting and personally, I learned a lot. Then in the last few minutes they discussed the role of CO2 in some depth. Just after it was pointed out just how far the current level of CO2 at 390 ppm is compared to the norm of 280 ppm, one of the guests, Richard Corfield. Research Fellow in Geology at the University of Oxford, said that he could see nothing wrong with 1000 ppm or more. His argument being that that would be normal for what they call Greenhouse Earth. Obviously he is completely oblivious of the enormous loss of life the sudden change we are experiencing is going to cause, or doesn’t care. Yes, we will have to adapt, but slowly over thousands of years should be no problem. The worrying thing is that this came from someone who, as a geologist, sees any changes that take less than a few thousand years as ‘instantaneous.’ Unfortunately, that was almost the last comment of the programme, so there was no time for the others to give a riposte. Oh hum.
-
Daniel Bailey at 01:42 AM on 15 February 2013We're heading into an ice age
As a followup to my previous comment, real scientists doing real studies have already looked into whether the Earth will warm or cool, long-term. As opposed to empty assertions, let's examine the facts, shall we:
Per Tzedakis et al 2012,
“glacial inception would require CO2 concentrations below preindustrial levels of 280 ppmv”
For reference, we are at about 394 right now…and climbing, so we can be relatively sure the next glacial epoch won't be happening in our lifetimes.
But what about further down the road? What happens then? Per Dr Toby Tyrrell (Tyrrell 2007) of the University of Southampton's School of Ocean and Earth Science at the National Oceanography Centre, Southampton:"Our research shows why atmospheric CO2 will not return to pre-industrial levels after we stop burning fossil fuels. It shows that it if we use up all known fossil fuels it doesn't matter at what rate we burn them.
The result would be the same if we burned them at present rates or at more moderate rates; we would still get the same eventual ice-age-prevention result."and
"Burning all recoverable fossil fuels could lead to avoidance of the next five ice ages."
So no ice ages and no Arctic sea ice recovery the next million years...
Facts, like Tiggers, are wonderful things, for those who have them.
Also covered by Stoat, here.
Given the radiative imbalance at the TOA is still present and that CO2 levels are still increasing (and that human emissions are not ending anytime soon), it is reasonable to presume that the impacts of a warming planet will increasingly impact the most vulnerable aspects of our remaining cryosphere: the Arctic sea ice (a goner), the Greenland Ice Sheet and the West Antarctic Ice Sheet.
We are, through our own actions, effectively locking-in a world of another 8-12 meters SLR above present. Unless we can magically arrest our emissions and also initiate methods to draw-down atmospheric concentrations of CO2. -
Daniel Bailey at 01:14 AM on 15 February 2013We're heading into an ice age
@ Kevin
"Looking at fig1,it appears that an ice age is due any minute, not in 10,000 years. "
Umm, got any physical basis for that? Any at all? "Eyecrometers"™ do not count.
Frankly, your entire above comment is an example of simplistic thought, tired fake-skeptic talking points and unsupported rhetoric constituting sloganeering (a violation of the Comments Policy here).
-
Kevin8233 at 00:52 AM on 15 February 2013We're heading into an ice age
Worry about global warming impacts in the next 100 years, not an ice age in over 10,000 years.
Looking at fig1,it appears that an ice age is due any minute, not in 10,000 years.
Another bit of information to take from fig 1, it looks as if all the previous interglacials were warmer than the current one. Who decided that the temp after the industrial revolution was the "accurate" temperature the earth should be at, and that we are exceeding that perfect temp?
-
Composer99 at 00:46 AM on 15 February 2013A Glimpse at Our Possible Future Climate, Best to Worst Case Scenarios
MartinG:
In addition to JasonB's comments, I find some claims you have made in your post to be troubling. In particular, your sociological claims (including the first paragraph and the now-moderated last paragraph) both also appear to be contrary to the historical & contemporary evidence.
-
Jeffrey Davis at 00:28 AM on 15 February 2013A Glimpse at Our Possible Future Climate, Best to Worst Case Scenarios
Three summers ago, the first year (of 2 in a row) that Pakistan lost most of its agricultural production to flood, Australia and Russia lost the bulk of theirs to drought. At 2C of warming -- the chart seems to say ---- that there would be localised threats and that "small holders" might have problems.WTF? At .9C of warming we just had the simultaneous destruction of agriculture in Russia, Pakistan, and Australia. How localised is that? As for "small holders" I hope that doesn't mean "anyone other than the US and Canada."
-
ianw01 at 00:14 AM on 15 February 2013A Glimpse at Our Possible Future Climate, Best to Worst Case Scenarios
JasonB@11: Yes, but MartinB has a point about the polarized debate turning people off. And that I'd argue leads back to my comment @1 - people will need to truly experience the problem before real action begins. :-(
-
Susanne at 23:08 PM on 14 February 2013OA not OK part 20: SUMMARY 2/2
Rob, Thank you very much. I didn't expect such a quick or detailed response, especially as I'm sure that explaining without equations is uncomfortable.
Thanks again.
-
JasonB at 20:26 PM on 14 February 2013A Glimpse at Our Possible Future Climate, Best to Worst Case Scenarios
MartinG,
I don't think your characterisation of the people here is very fair or accurate. "Frantically trawling new research for anything that supports our view"? "Picking the high side"?
I sometimes do mock my "opponents", but only after I have tried my best to correct the generally silly and quite obvious mistakes and misunderstandings, and they have responded by refusing to even try to understand why they are wrong and instead insist without evidence that the whole thing is a scam and places like SkS can't be trusted (or even looked at) because they "censor comments" or are biased or some other inanity that completely avoids addressing the actual issue that has been clearly spelled out for them.
As for "real problems that we can do something about", who said we shouldn't also address those problems, whatever they are?
What if its not CO2 but something we havnt figured into the equation yet?
This seems to be completely backwards. It suggests that we've observed a problem and gone searching for an explanation and as such we may have got it wrong. In fact the problem was predicted long before it was observed, and when it was observed the observations were what was expected from the predictions:
- That the globe would warm, and about how fast, and about how much.
- That the troposphere would warm and the stratosphere would cool.
- That nighttime temperatures would increase more than daytime temperatures.
- That winter temperatures would increase more than summer temperatures.
- Polar amplification (greater temperature increase as you move toward the poles).
- That the Arctic would warm faster than the Antarctic.
- The magnitude (0.3 K) and duration (two years) of the cooling from the Mt. Pinatubo eruption.
- They made a retrodiction for Last Glacial Maximum sea surface temperatures which was inconsistent with the paleo evidence, and better paleo evidence showed the models were right.
- They predicted a trend significantly different and differently signed from UAH satellite temperatures, and then a bug was found in the satellite data.
- The amount of water vapor feedback due to ENSO.
- The response of southern ocean winds to the ozone hole.
- The expansion of the Hadley cells.
- The poleward movement of storm tracks.
- The rising of the tropopause and the effective radiating altitude.
- The clear sky super greenhouse effect from increased water vapor in the tropics.
- The near constancy of relative humidity on global average.
- That coastal upwelling of ocean water would increase.
Moderator Response: [DB] Thank you for clarifying that misdirection (coming from BPL's page. Any further discussion of models needs to be placed on the Models are Unreliable page. -
JasonB at 20:05 PM on 14 February 2013A Glimpse at Our Possible Future Climate, Best to Worst Case Scenarios
One of my pet irritants is the insistance that a perfectly good word or phrase not be used for its obvious meaning because it is the name of something else. :-)
"Begging the question" is indeed the name of a local fallacy, however that turn of phrase is so colourful that it is just begging to be used in other contexts. :-) It obviously means "invites the question" in this context, but carries an ever stronger connotation in exactly the same way that begging someone to do something is stronger than simply inviting them to. In fact, if there is any criticism to be made, it's that this usage is so common that is has become cliché.
A suggestion of my own — would it be possible to make the underlining of glossary terms more subtle? At the moment I'm finding having so many words underlined somewhat distracting. One effect I quite like is a very pale solid grey line that becomes darker as the mouse moves over it.
-
shoyemore at 19:14 PM on 14 February 2013A Glimpse at Our Possible Future Climate, Best to Worst Case Scenarios
Just an opportunity to parade one of my own pet irritants. Para 2 "This begs the question ... ".
To "beg the question" means assuming your conclusions to justify your premise. The original meaning was a question "begging to be answered" but ignored by the speaker or writer. Question-begging is a form of logical fallacy, related to a non-sequitur, where conclusions are unsupported by the premise.
http://www.nizkor.org/features/fallacies/begging-the-question.html
The meaning here is "That invites the question ..."
Rant over :)
-
Andy Skuce at 16:11 PM on 14 February 2013A Glimpse at Our Possible Future Climate, Best to Worst Case Scenarios
Dana@6
I agree on the trends being the similar until ~2040 but the atmospheric concentrations/cumulative emissions cross around 2060 and start to diverge significantly after that.
-
MartinG at 16:07 PM on 14 February 2013A Glimpse at Our Possible Future Climate, Best to Worst Case Scenarios
Photon Wrangler - very well put. I wonder if this is all the fault of Climate science. In days of old you could be green and environmentally friendly just out of a desire to protect the environment and live in harmony with the earth. ( -snip- ).
What if there is a real problem that we can do something about?. What if its not CO2 but something we havnt figured into the equation yet? ( -snip- ). And unfortunately the climate is so complex that all our models are rough guesses, probably lacking important factors not yet discovered, and with so many degrees of variables that we can get them to produce any result we want - the denialists picking the low side, and the warmers the high side.
Thats not science, and as the argument rages the public lose interest in the squabble - and then nobody gives a fig leaf about the environment any more. What if this polarised debate is misleading the public into apathy???
Moderator Response: [DB] Off-topic snipped. -
dana1981 at 15:35 PM on 14 February 2013A Glimpse at Our Possible Future Climate, Best to Worst Case Scenarios
Agree with Andy @5 except 4.5 and 6 are roughly the same until 2040, not 2060.
-
Andy Skuce at 14:53 PM on 14 February 2013A Glimpse at Our Possible Future Climate, Best to Worst Case Scenarios
mandas@ 4
The four RCPs are based on multi-gas emission scenarios which were selected from the published literature (Fujino et al. 2006; Smith and Wigley 2006; Clarke et al. 2007; Riahi et al. 2007; van Vuuren et al. 2007; Hijioka et al. 2008; Wise et al. 2009) and updated for release as RCPs (Masui et al. 2011; Riahi et al. 2011; Thomson et al. 2011; van Vuuren et al. 2011b). Because they were produced by four different Integrated Assessment Models (IAMs), there are some inconsistencies in the relationships between emissions and concentrations that could complicate the interpretation of the climatic consequences of the four different scenarios.
My eyeballing of the two middle pathways tells me that they are basically the same up to about 2060. After that the world either wakes up (4.5) or decides to leave no coal unburned (6.0), at least until 2100. Based on Figure 2, it appears that both of these pathways may be a little optimistic in the short and medium term if you project our current emissions trends.
-
mandas at 12:33 PM on 14 February 2013A Glimpse at Our Possible Future Climate, Best to Worst Case Scenarios
Why is RCP 6 initially lower than RCP 4.5 (or even RCP 3)?
-
Photon Wrangler at 09:56 AM on 14 February 2013A Glimpse at Our Possible Future Climate, Best to Worst Case Scenarios
*macabre.
I love the new comment system, but it doesn't seem to support my Firefox spell checking, which I have become shamefully dependent on.
-
Photon Wrangler at 09:54 AM on 14 February 2013A Glimpse at Our Possible Future Climate, Best to Worst Case Scenarios
ianw01, I agree. It's a bit mabre, I suppose, but I actually find myself hoping for drought, for heat waves, for a (even more) dramatic reduction of sea ice. Anything to shock people out of complacency, so we can go about properly mitigating our risks.
But let's fast-forward 15 years: N. America and Europe have been getting walloped by searing heat waves and drought, interspersed with periods of unprecendented rainfall, causing massive floods. Summer sea ice has effectivly vanished. The era of consequences is upon us. Yet, everything the Deniers hold to be true still applies:
- The earth has been this warm before (true)
- You can't prove that any given meterolgical event is "caused" by climate change.(true)
- It's possible that man is only contributing a small portion of the warming, the rest being caused by: solar flares, ocean turnover, gamma rays, HAARP, volcanoes, God, what have you (untrue, although that doesn't stop people from believing it today)
- Any action we take today will not significanty affect the climate in ourlifetimes (true for just about anybody in their mid 30s -- look at the above charts)
Not sure where you hail from, but in the States there are a not ignsignifact number of individuals who would tell you that God - and only God - can change the climate. This worldview is deeply ingrained in many folks, and virtually impossible to dislodge. Efforts to dislodge it will be met with ever more furvor.
As you said, we'll need a "motivated majority". But unfortunately, it's hard to get motivated about taking actions that at best will yield tangible results in ~40 years. Rolling back carbon taxes or raising emissions caps will always provide immediate economic relief, with the costs pushed out to generations you haven't met yet. Humans are exceedingly good at falling into this kind of reasoning. Just look at our public and private debt levels.
Man. I really took a pessimistic turn there. Maybe I shouldn't have skipped lunch.. -
Tom Curtis at 08:08 AM on 14 February 2013Lukewarmerism, a.k.a. Ignoring Inconvenient Evidence
St Barnabas @30, your graph is interesting when compared to this one of ocean temperature with depth:
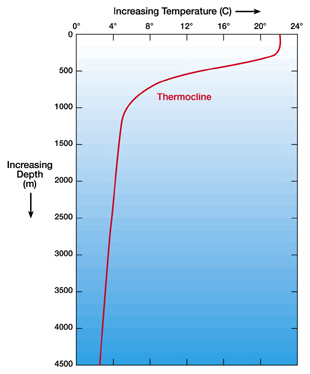
(Source)
The important fact here is that since about 2005, gain in OHC (and hence temperature) at 0-700 meters has been much reduced. That has been largely compensated by increased gain at 700-2000 meters, such that the 0-2000 meter OHC gain has only reduced slightly. The important point is that an equal gain in temperature at 700-2000 meters will result in a lesser expansion to the equivalent gain at 0-700 m due to the lower average temperature; and hence the switch in where heat is accumulating will result in a decceleration in the rise in sea level, even if there were no change in gain in OHC.
-
ianw01 at 06:33 AM on 14 February 2013A Glimpse at Our Possible Future Climate, Best to Worst Case Scenarios
The more I think about these scenarios, the more I have come to believe that the most important factors will be the lag in the warming and short term variability.
As humans, we will continue to emit CO2 (doubling and beyond) until a motivated majority experiences or sees a real problem. Then real action will happen. If short term variation and a big lag in the climate response combine to delay that human realization, the ultimate impacts will be that much bigger.
So the real question is (a) when will there be NO doubt in the public's mind that serious action is needed? and (b) at that point how much warming will we already be committed to?
The actual sensitivity is arguably a secondary issue.
-
StBarnabas at 06:06 AM on 14 February 2013Lukewarmerism, a.k.a. Ignoring Inconvenient Evidence
Dana
Sorry I’ll try to be a bit clearer. I would have like a bit more time to look at the literature as it seems to me that sea level rise should be accelerating rather then being a fairly static 3.2 mm/y. Over the past decade there has been considerably accelerating ice melt – Greenland, glaciers Antarctica etc. I know that temporarily water can fall as rain dropping the sea level – but all the rivers run into the sea, why is it not rising faster.
The substantive point is that sea level rise will depend on whether the heat goes into the top of the oceans or lower down. If the heat sticks near the surface the sea will normally rise a lot faster. (If there is a paper in this you heard it here first!) As you will be well aware there seems to be a lot more heat transfer to the lower ocean below 700m in the past few years, unless I have misunderstood. This would slow down sea level rise.
The ocean cools as the deeper it gets. (normally anyway - The Med is well mixed below the thermocline and is a constant 15 degrees or so, but I understand the big oceans are quite different).
The thermal mechanism for sea level rise is driven by two constants Cp the specific heat capacity of seawater and Beta the thermal expansion coefficient. Heat is absorbed by seawater and the temperature rises. As the temperature rises the water expands. So far so obvious, however both these terms are functions of salinity (typically about 35 ppt), pressure (depth) and of course temperature. In Practice Cp varies little with these parameters however Beta is very strongly temperature dependent and not very dependent on depth or salinity. It takes a lot more heat to expand cold water than hot. For fresh water Beta becomes zero at 4C and negative below that. Beta for seawater remains positive right down to -2C where it freezes.
I will try attaching a graph generated by using the seawater toolbox (CSIRO, Nathan Bindoff 1993.) but essentially as water get hotter it expands faster.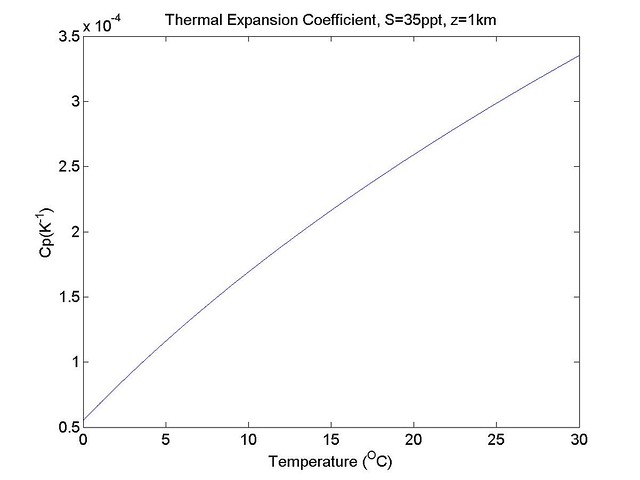 Moderator Response: [RH] Fixed image width.
 -
StBarnabas at 05:34 AM on 14 February 2013The Japan Meteorological Agency temperature record
DB (Mod) is correct. I double posted my comment by accident by refreshing. There is no facility to delete or edit posts (which I fully understand on this blog given the abuse allowing this could invite). Can this behaviour not be turned off as I'm sure I'm not the only one to waste valuable mod's time?
Moderator Response: [DB] I make a point of opening up a new window on the thread on which I comment, and then close it after commenting. Regular participants here follow the Recent Comments thread anyway, where all newly added comments appear. -
Boswarm at 20:23 PM on 13 February 2013Lukewarmerism, a.k.a. Ignoring Inconvenient Evidence
Jeffrey Davis at 03:09 AM on 13 February, 2013
"Warming will continue as more CO2 is added to the atmosphere" - this is so right - Luke warmer, skeptic denier - who cares. They have to be ignored as even a 0.9 C increase is already affecting food production, flowering times, animal survival (not just food source species) etc - something has to be done. Dana - sensitivity is now over - its all downhill unless actions are taken.
-
Kevin C at 19:33 PM on 13 February 2013The Japan Meteorological Agency temperature record
bratisla: Yes, I've krigged HadCRUT4, and am working on more interesting methods.
Have a look at this article for a start, which used nearest neighbour - but the results are very similar.
- If you krig HadCRUT3, you get something which looks like GISTEMP.
- If you krig HadCRUT4, you get something which shows faster warming than GISTEMP, primarily because HadCRUT4 has the addition SST corrections.
-
JohnB6223 at 18:30 PM on 13 February 2013Announcing the Skeptical Science Glossary
Would prefer the "Lookup a Term" lower screen tab to be located further to the left side of the screen- out of the way of the normal text scroll through 'reading' area.
Otherwise a handy and useful new feature - thanks.
-
Rob Painting at 18:13 PM on 13 February 2013OA not OK part 20: SUMMARY 2/2
Susanne - I'll reply without using equations, but you really need to follow the equations to understand this in greater depth:
1. The notion of akali and acid, as it pertains to ocean acidification, is irrelevant. Ocean acidification is the process of increasing the hydronium ion concentration in seawater (lowering pH). It has nothing to do with the concept of neutral pH. The oceans will very likely remain above a pH of 7 (neutral), but can still be highly corrosive to marine life that make their shells/skeletons (calcifiers) from calcium carbonate (chalk). If someone drags up the issue of neutrality, or acids and akali, you can be certain they don't understand the fundamentals and are probably playing the troll.
2. The oceans become corrosive to marine calcifiers because increasing the atmospheric CO2 partial pressure forces more CO2 to dissove into the oceans and leads to a series of reactions which diminish the concentration (activity actually) of carbonate ions in seawater. These carbonate ions are one of the key building blocks of the calcium carbonate shell/skeleton. So, although pH (the concentration of hydronium ions) is critical for a number of biological chemical reactions, it's not lower pH per se that makes the oceans corrosive to marine calcifiers - it's the decline in carbonate ion activity.
3. Now on to buffering. The carbon chemistry of the oceans (the series of reactions between the various forms of carbon dissolved in seawater) means that the oceans buffer (act against) the lowering of pH. So yes the oceans are buffered to some extent. The equation in which a hydronium ion combines with carbonate to form bicarbonate is the one which buffers against ocean pH being even lower than it is, because the "extra" hydronium is no longer free in solution - it is now bound with the carbonate ion to form bicarbonate. If this reaction did not take place the hydronium concentration of seawater would be higher and, therefore pH lower. But this is the very same reaction which lowers the carbonate ion concentration in the oceans and makes them corrosive to marine calcifiers!
4. Two other buffering mechanisms exist, but they operate on such long timescales that they are of no use to humanity, or the marine life put at threat by ocean acidification. One is the supply of alkalinity back to the oceans through the chemical weathering of silicate rocks through rainfall. And the other is the dissolution of carbonate sediments on the ocean floor when the oceans become corrosive. These both operate on 10-100,000-year timescales, so won't be of any use to us.
5. This slow buffering is why the oceans became corrosive in Earth's past when CO2 increased in a geologically abrupt manner, but did not when the CO2 content of the atmosphere increased slowly, or was sustained at high levels for long geologic intervals - the system is able to readjust and move itself back toward an ocean condition which is suitable for marine life through these buffering processes. Perhaps the best example of this are the White Cliffs of Dover. These are huge chalk deposits formed by coccoliths (microscopic marine life that build their shells from calcium carbonate) during the Cretaceous - a time of very high atmospheric CO2 and much warmer global temperature. Because there was no geologically-abrupt spike in CO2 the oceans did not become corrosive, despite the low pH.
6. Perhaps the best way to skewer bogus claims about ocean acidification is show what is actually going on today - marine life is beginning to be eaten away by corrosive seawater. The pic below is of a pteropod (sea butterfly) captured from waters around Antarctica recently:
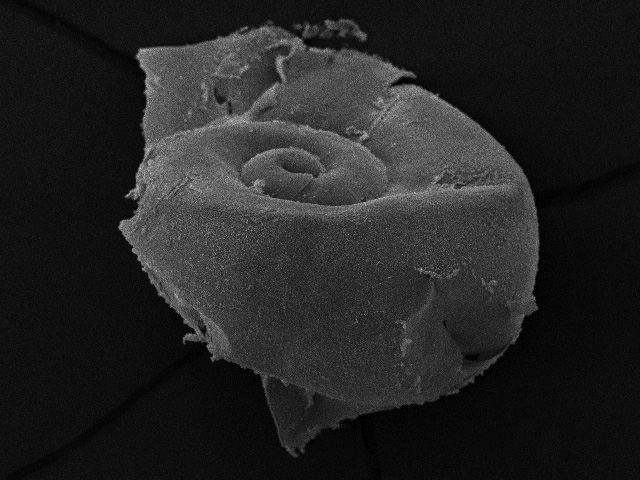
The pic is from this peer-reviewed paper: Extensive dissolution of live pteropods in the Southern Ocean - Bednarsek (2012).
-
dana1981 at 15:08 PM on 13 February 2013Renewables can't provide baseload power
curiousd @81 - use the Contact Us page. John Cook will respond and then you can email him whatever you've written up.
-
curiousd at 14:43 PM on 13 February 2013Renewables can't provide baseload power
Question....Some time ago I received comments from folks at SKS that they might post a lead article by me on CO2 offset solar charities. Months have passed and I have interacted with many such organizations plus found some interesting facts. For instance, largely due to "The Swanson Effect" (crystalline silicon solar cells are factor 35 cheaper than ~30 years ago) what used to be a charity is now likely a business, though a small one. Great news in most respects but bad news for innovators like Solyndra or concentrating solar projects such as Desertec, perhaps. Developing country inhabitants can power and light their homes cheaper with solar than using kerosene or going onto the grid. Now what should I do? I can send something written up, but to whom, and in what form, and what happens after that?
-
Susanne at 11:55 AM on 13 February 2013OA not OK part 20: SUMMARY 2/2
I think I've just bumped into one of the concepts this series "skips lightly over", and I'm hoping you will kindly help me to crawl around it. The concept is buffer theory, and the reason I only think it's my obstacle is that I encountered it in this "simple description" of the ocean's importance for climate, written by an oceanographer:
"...it is also clear that the ocean’s capacity for carbon dioxide is limited, as indicated by its increasing acidity. This is most extraordinary since the ocean has always been considered to be strongly buffered against acids and alkalis alike;"
To me, a buffer is a space that separates two things for safety, as in "buffer zone" or a buffer in a schedule. After a bit of googling around I'm guessing in chemistry it's a process rather than a space and that buffer theory spells out how buffering mechanisms (mechanisms?) work. I also suspect it's such a fundamental concept that even a simple explanation requires a boatload of technical terminology, but I hope I'm wrong about that.
FYI the simple description is being written for a regular "climate column" we're doing for our local newspaper. Our readers' assumed level of knowledge is about year 8 school science 40 years ago. It's a great opportunity, but it would be very easy to scare the editor, never mind the readers.
I'm not asking you to write to the level we're aiming for, but I'd be very grateful for an explanation that makes sense to me when I'm translating for my oceanographer. Can you help?
Thanks for the series and for this site.
-
vrooomie at 10:56 AM on 13 February 2013The Japan Meteorological Agency temperature record
"Kriging" should be added to the Glossary.
-
dana1981 at 10:52 AM on 13 February 2013Lukewarmerism, a.k.a. Ignoring Inconvenient Evidence
StBarnabas @27 - you are correct. If you click the "extreme flooding" link in the OP at the end of the 2nd paragraph in the Lukewarm Escalator section, that goes to a post by Rob Painting about research showing that the short-term pause in sea level rise was primarily caused by large flooding events.
I'm not sure I understand your question about thermal expansion though.
-
brent at 10:31 AM on 13 February 2013Announcing the Skeptical Science Glossary
Thanks for the replies - might it be an idea to make sure everyone understands how to do this? I've re-enabled scripts, but as I have FF delete all cookies when I close it, I'll need to re-check 'No Definitions' every time I visit.
Moderator Response: [Sph] The delay has been added. -
StBarnabas at 09:05 AM on 13 February 2013The Japan Meteorological Agency temperature record
Kevin
many thanks. I'm constantly amazed by how little I know. Strange that a lot of my students think I know everything! What is possibly more strange that I have found that people who know little or almost nothing seem to think they know almost everything, or at least sufficient to make profound judgements on areas totally outside their often minimal expertise.If only I could think of a relavent example. :-)
Moderator Response: [DB] As a general note: refreshing the same browser window after submitting a comment submits a duplicate of the first comment. -
bratisla at 08:59 AM on 13 February 2013The Japan Meteorological Agency temperature record
Glad to see kriging gaining ground in Earth sciences, especially since Matheron was head of a department where I work now and still was able to produce several great geostatistic ideas (several of his notes are available I think)
Just one question : did you try kriging on HadCRU4, to see what happened ?
-
StBarnabas at 08:49 AM on 13 February 2013Lukewarmerism, a.k.a. Ignoring Inconvenient Evidence
Dana
Good post as ever. One query, my very simplistic understanding is that in La Nina years more heat is retained in the ocean cooling the surface and in La Nino years more oceanic heat is transferred to the atmosphere cooling the ocean slightly. I had understood the sealevel drop in 2010 was due to very wet weather over large continental masses shifting c 1cm of water from the ocean to the land.
Of course the thermal expansion coefficient of water is temperature dependent and the mix of heat between the upper and lower ocean layers would cause an effect – I could easily do a calculation, but I suspect there are already many papers on this?
-
Tom Curtis at 08:07 AM on 13 February 2013Sea level rise predictions are exaggerated
Kevin @22, unless serious efforts to reduce carbon emissions are in place soon, the temperature difference between the end of this century and now will be approximately that between the coldest period of the Last Glacial Maximum and the Holocene average. That temperature difference was enough to cause a 100 meter rise in sea level in 8,000 years, the equivalent of a 12.5 mm per year rise. Given that, a rise of 0.785 meters (increase of annual rate to average rate of deglaciation over the century), or 1 meter (increase to deglaciation rate over fifty years, and constant thereafter) are likely.
Given that the Earth warmed gradually after the LGM so the actual differential in temperature during the last deglaciation was less than what we will experience, and given that periods of much faster melting occurred durring the last deglaciation, sea level rises of 2 meters are a distinct possibility.
-
Kevin C at 08:02 AM on 13 February 2013The Japan Meteorological Agency temperature record
StBarnabas: I've used nearest neighbour, inverse distance and polyharmonic splines as well as kriging. The interesting thing is that, as long as you use a distance cutoff of 1000-1500km, they all give similar results to kriging. The temperature data is pretty well behaved and it doesn't much matter what you do with it. Robert Rhode in his recent BEST memo showed something similar - that the GISTEMP method (which is essentially a kernel smooth) comes close to kriging.
The principle benefit of kriging in this case is that you don't need to set a distance cutoff - you get a global map which naturally reverts towards the global mean if you get too far away from an observation.
In general kriging has some awesome properties. For example it gives you a proper area weighted mean almost by magic, and weights neighbours of a cell according to how much distinct information they add. Unlike BEST I'm losing some of the benefits by starting from the gridded data, but again for this problem it doesn't make much difference.
Prev 965 966 967 968 969 970 971 972 973 974 975 976 977 978 979 980 Next


