


 Arguments


Recent Comments
Prev 967 968 969 970 971 972 973 974 975 976 977 978 979 980 981 982 Next
Comments 48701 to 48750:
-
Son of Krypton at 07:15 AM on 16 March 2013Watts Interview – Denial and Reality Mix like Oil and Water
Jose@8 & Kevin&14
If you were fans of the graph in DS#10, I might also recommend the paper Foster & Rahmstorf (2011). SkS does an admirable job summing it up hereIn essence, they use a multiple linear regression to isolate the relative contriburtions to the climate from ENSO, volcanism, solar variability and the anthropogenic contribution. It results in a far clearer picture of the anthropogenic effect on climate
-
Son of Krypton at 06:15 AM on 16 March 2013Watts Interview – Denial and Reality Mix like Oil and Water
Jose@8 & Kevin&14
If you were fans of the graph in DS#10, I might also recommend the paper Foster & Rahmstorf (2011). SkS does an admirable job summing it up hereIn essence, they use a multiple linear regression to isolate the relative contriburtions to the climate from ENSO, volcanism, solar variability and the anthropogenic contribution. It results in a far clearer picture of the anthropogenic effect on climate
-
dana1981 at 05:58 AM on 16 March 2013Watts Interview – Denial and Reality Mix like Oil and Water
Kevin @26:
"is the above quoted argument fair?"
Yep. Watts is arguing that decades of peer-reviewed scientific research is wrong based on blog 'science'. We're showing that comments made in an interview were wrong. It's just sliiiiightly different. If we were using the graphic in question to try and disprove peer-reviewed research, then you would have a point.
-
Composer99 at 05:58 AM on 16 March 2013Watts Interview – Denial and Reality Mix like Oil and Water
Kevin:
As far as I am aware neither John Nielson-Gammon nor Skeptical Science are presenting that graph as science of any kind, only as a debunking tool, similar to the Escalator, to use against claims that global warming has 'paused' or 'stalled'.
Can you say the same thing about Watts given what he states?
What I learned is that the government weather service (NOAA) had it right at one time, but they’d dropped their guard, and my recent study (preliminary) shows that not only is the deployment of weather stations faulty in siting them, but that the adjustments designed to solve those issues actually make the problem worse.
-
John Russell at 05:56 AM on 16 March 2013Watts Interview – Denial and Reality Mix like Oil and Water
While Watts—and many of his more 'politically astute' fellow climate conspiricists—has started recently to claim to be a 'lukewarmer', I note that he still gives a platform and tacit encouragement to anyone who wants to attack mainstream climate science. As others have noted, this position seems to go along with a recent acceptance of a climate sensitvity less than 2oC. Although on the surface this can be seen as an advance of sorts, it's a change in position that totally fails to alter the underlying stance that no action should be taken because of the uncertainty/cost/etc.
To use a military analogy; Watts and his co-conspiracy-theorists appear to be dropping armed insurrection and instead taking up a terrorist or 5th columnist approach to their ideological struggle.
-
Watts Interview – Denial and Reality Mix like Oil and Water
Kevin - Given that Watts unsubmitted work is woefully flawed (as pointed out here and by many others), while the graph in DS#10 is both incredibly simple (just dates and ENSO classifications) and uncontroversial, yes, it is a fair argument. The point here is that Watts' paper is wrong, not that it is unsubmitted.
If that paper had passed peer-review (with actual reviewers, rather than in a journal such as E&E) that would be a point in it's favor - given the fundamental and publicly discussed errors, however, I really don't see that happening.
As to the graph in DS#10, a simple plot of temperatures against ENSO phase, I would point out that it's probably sub-publication in size. And more importantly, that the graph is correct - unless you have some issues with it, in which case you should say so.
-
Kevin8233 at 05:16 AM on 16 March 2013Watts Interview – Denial and Reality Mix like Oil and Water
The "preliminary" paper in question has not even been submitted to a journal, let alone been subjected to the peer-review process, and contains several fundamental flaws which completely undermine the conclusions that Watts asserts in this quote.
In light of the fact that the paper that produced the graph in DS#10 has not been peer review, nor has it been submitted, and in fact is presented on a blog, is the above quoted argument fair?
-
Kevin8233 at 04:11 AM on 16 March 2013Watts Interview – Denial and Reality Mix like Oil and Water
gws,
Thanks for the info. Do you happen to know where I can find the confidence limits for his trends? His blog did not show them, at least not that I found, not even in the comments.
-
sol6966 at 04:06 AM on 16 March 2013Watts Interview – Denial and Reality Mix like Oil and Water
oops that should be (especially if your not friendly to the USA),
-
sol6966 at 04:02 AM on 16 March 2013Watts Interview – Denial and Reality Mix like Oil and Water
JvD at 17 says
None of them disagree with my assessment, since none of them show how renewables can power the globe. All they do is show that there is enough sun, wind, etc. It saddens me that SS it not able to recognise the difference between that and showing actually *how* renewables can power the globe
What is the difference between your assertion that Nuclear can supply the world's energy needs and those who propose renable energy?
You seem to be suggesting that these reports are only able to identfy a resource without being able to identify the technologys needed to utilise those resources, which is clearly wrong.
All you can do is identify what nuclear resource is avalible and show there is the technology to make use of that resource. You may be able to show that we can dig the uranium up, refine it into useful form, and then convert it into useful energy, of course renewable energy technologies are able to convert those abundant resources without the need to dig anything up or refine anything.
Your favored technology has a number serious draw backs, to access the resourse requires energy intensive & distructive extraction, energy intensive refining, the process of extracting useful energy is too expensive to build without massive government subsidy and are uninsurable (what ever happened to the promise of too cheap to meter), creates long lived polutants that after more than fifty years of use still can not be safely disposed of and can be used to make the most distructive bombs ever created, is not available to everyone (especially if your frendly to the USA), and if something goes wrong hundreds of thousands of people will never be allowed to go home.
On the other hand, renewables are not finite by there nature, the conversion equipment is quickly becoming much cheaper, can be scaled to any size required (nuclear power is not much use to a village in India).
Moderator Response: [d_b] Those will have to serve as the last words on nuclear energy versus everything else on this thread. Further completely redundant and off-topic debate on that tiresome topic will be deleted from this location. Bear in mind also that it's possible another moderator will take a harsher view and retroactively purge the thread. -
gws at 03:53 AM on 16 March 2013Watts Interview – Denial and Reality Mix like Oil and Water
Kevin @14
I assume you addressed John Nielsen-Gammon's analysis? If so, AFAIK, it is not published in the peer-reviewed literature but only his blog. He may work on it though and has recently updated it on his blog.
With respect to years analyzed for the trend, John gives the stats. If you have questions, email him.
16 years? What matters is the period, not the number of data points. Fewer than 16 data points can give a significant trend, but it may not be accurate if the period analyzed is too short. In this graph's case they span a longer period though. Aka, you probably misunderstood what you were previously told, namely that one should not analyze short periods for trends because the noise can overwhelm/bias it. However, if the period is long enough, even fewer data points can accurately represent the underlying trend.
-
michael sweet at 03:07 AM on 16 March 2013A Detailed Look at Renewable Baseload Energy
JvD,
Since you recommended nuclear for global power can you describe how you would secure locations like Siria or Zimbabwe? The fiasco in Fukushima proved that neclear power absolutely requires permanent connection to other power supplies to protect their core and on-site waste storage. How will you protect this access in a war zone?
I, for one, have no problem with wind generators or solar being installed in Syria. If they are damaged the Syrians can build new ones. There are no security issues. How can you imagine powering the entire world, including unstable countries, with nuclear?
You appear to me to claim that energy engineers, like you, are too stupid to develop methods to overcome the problems that renewable energy has. I think these issues can be overcome. For one thing, baseload power, the title of this post, has a lot of daytime energy use transferred into it because fossil fuels cannot provide the energy at a convienent time. While wind might be the same, solar produces its energy during prime daytime energy use hours.
Please list your objections so they can be discussed.
-
Watts Interview – Denial and Reality Mix like Oil and Water
JvD - I have replied on an appropriate thread.
-
A Detailed Look at Renewable Baseload Energy
As a follow-up to JvDs comments:I would have to disagree.
Capacity: There is certainly enough wind/solar energy theoretically available, many multiples of current and projected demand, even if limiting to only otherwise undesireable real estate.
Renewable baseload: Distributed networks can and will have baseload capacity - I believe the reliable baseload for a sufficiently distributed network, with zero energy storage, has been shown to be ~1/3 of average capacity (Archer & Jacobson 2007). Average capacity is IIRC ~15-30% of installed capacity, varying with type/site - by no means perfection, but a predictable fraction.
Reliabilty: Wind/solar at least tend to be multiple components (many windmills, many solar panels) at each site, with the possible exception of concentrated thermal. This means source failures are far less likely than with coal/nuclear boilers, but for the sake of argument we can go with the same site reliability figures as fossil fuels use - and we manage with those now. As to supply variations - weather predictions out a few hours are extremely reliable, providing plenty of time for any needed redistribution or backup to ramp up.
International availability: Not often discussed, but certainly an issue. While the US (for example) doesn't have this problem, the UK (small, cloudy, high latitude, high energy use) is probably not going to be able to supply their energy needs with renewables located in the UK - but rather importing from perhaps Northern Africa or other locations. But that's the nature of the world today - some countries are energy exporters, some are energy importers. Particulars will change, but we are dealing with that situation now.
-
Composer99 at 01:23 AM on 16 March 2013Watts Interview – Denial and Reality Mix like Oil and Water
Inquiry to JvD on thread suggested by michael sweet.
-
Composer99 at 01:23 AM on 16 March 2013A Detailed Look at Renewable Baseload Energy
JvD states on a recent thread:
"As someone who is familiar with the field, you must know there are many peer reviewed studies that disagree with your assessment that renewables cannot be used to power the entire globe." [comment by michael sweet]
Yes I have read probably all of them. None of them disagree with my assessment, since none of them show how renewables can power the globe. All they do is show that there is enough sun, wind, etc. It saddens me that [SkS] it not able to recognise the difference between that and showing actually *how* renewables can power the globe, which is what is demanded in a scientific discussion. IPCC does not do this. Greenpeace does not do this. WWF does not do this. They make a mockery of serious efforts to move to low-carbon economy. This kind of denial is similar to climate change denial and just as damaging to the effort to save the planet for human welfare. I repeat my call for an overhaul of the treatment of this important subject on SS. Dr. Ted Trainer has clearly shown the problem and [SkS] should take it from there. I can't do more than that.
JvD: Could you provide some specifics on this? Perhaps refer to a few of these papers and explaining why they support your view?
After all, the authorship of the reports you are criticizing will very likely include people whose cumulative professional experience will be greater than yours. On what basis is your view superior to theirs?
-
dana1981 at 01:11 AM on 16 March 2013Watts Interview – Denial and Reality Mix like Oil and Water
Joris, most of the discussions on SkS (not SS) about renewable energy have included the point that we need to reduce consumption by increasing efficiency. As for moving to 100% renewable energy, I don't agree with you (this can be achieved by connecting a large network of various different types of renewable energy - solar PV, wind, solar thermal, geothermal, etc.), but it's a moot point for several decades anyway, and not relevant to this blog post.
-
Philip64 at 01:04 AM on 16 March 2013Watts Interview – Denial and Reality Mix like Oil and Water
An outstanding dissection of Watts's arguments. The claim to be a 'lukewarmist' is the most transparent fiction imaginable, designed, I suspect, only to draw in gullible 'undecideds'.
What also come across is the extraordinary shallowness of his ideas, and the increasing reliance on selective data . In that sense he is the essential climate skeptic.
-
JvD at 00:52 AM on 16 March 2013Watts Interview – Denial and Reality Mix like Oil and Water
"As someone who is familiar with the field, you must know there are many peer reviewed studies that disagree with your assessment that renewables cannot be used to power the entire globe."
Yes I have read probably all of them. None of them disagree with my assessment, since none of them show how renewables can power the globe. All they do is show that there is enough sun, wind, etc. It saddens me that SS it not able to recognise the difference between that and showing actually *how* renewables can power the globe, which is what is demanded in a scientific discussion. IPCC does not do this. Greenpeace does not do this. WWF does not do this. They make a mockery of serious efforts to move to low-carbon economy. This kind of denial is similar to climate change denial and just as damaging to the effort to save the planet for human welfare. I repeat my call for an overhaul of the treatment of this important subject on SS. Dr. Ted Trainer has clearly shown the problem and SS should take it from there. I can't do more than that.
Best regards,
Joris
-
michael sweet at 00:05 AM on 16 March 2013Watts Interview – Denial and Reality Mix like Oil and Water
JvD,
Renewabel energy has been discussed repeatedly on SkS. Frankly, I used to be in favor of Nuclear, but the people supporting that position here have not made a good case and I no longer support nuclear. Where I live in Florida, the local power company has wasted $1.5 billon US dollars planning a nuclear plant (they have not broken ground yet and never will) and has a second plant that has sustained irrepairable damage during maintenance worth $5-10 billion. Nuclear is simply not economic in the USA. As someone who is familiar with the field, you must know there are many peer reviewed studies that disagree with your assessment that renewables cannot be used to power the entire globe.
If you want to continue this discussion find a suitable thread, perhaps this one, nuclear always goes on forever.
-
Water vapor is the most powerful greenhouse gas
Jose_X - Short answer, yes. The sum of equilibrium forcings and temperature changes for 3*2x CO2 will equal 1x8x CO2. Or for any other subdivision.
What is being changed is to total emissivity of the atmosphere, which by the Stephan-Boltzman law and the amount of incoming solar energy sets the climate temperature.
The only possible differences would be if 2^3*concentration did not equal 8*concentration (mathematic nonsense), or if the temporal evolution of feedbacks differed with increment size (at equilibrium, there should be no difference), or passing some hysteresis point (say, driving into an Icehouse Earth state that requires a huge amount of forcing change to switch out of - which would require a forcing overshoot and reversal). So no, there should be no differences whatsoever in equilibrium total forcing, in equilibrium temperature, dependent on the path to that increase.
-
michael sweet at 23:51 PM on 15 March 2013Watts Interview – Denial and Reality Mix like Oil and Water
Dana,
You need to take much more personal credit for Watts claiming to be a "lukewarmer". I define "Lukewarmer" as a new name deniers call themselves because everyone knows their "skeptic" arguments have been shown to be bunk. They think that if they put on a new hat they can go on as they always have. SkS has been so successful in countering their false claims that Watts no longer wants to be associated with his own legacy!
Keep up the good work! Don't let them get away with putting on a new hat, they are still just deniers.
-
Kevin8233 at 23:48 PM on 15 March 2013Watts Interview – Denial and Reality Mix like Oil and Water
Like Jose, I like the graph in DS#10. I followed the links, but am curious about a couple of things.
Since it represents a trend, what are the respective confidence limits? Are they (the three trends) close as far as confidence limits goes?
Since the graph has been updated since 2007 when it was first done, have the trend lines been recalculated, or have the lines just been extended?
Was this paper peer reviewed? I am assuming it is, but can't find it.
Is there enough data points to say there is a trend? On a different thread, I was told that 16 years was insufficeint to generate a trend, but here we have 45 years, with 6 years removed for volcanic activity, leaving 39 years to generate 3 different trends?
-
JvD at 23:22 PM on 15 March 2013Watts Interview – Denial and Reality Mix like Oil and Water
To be clear, I work for a 400+ employee engineering consultancy company in the Netherlands and my function title is Sr. Specialist in Energy and Sustainability. I have 10 years work experience, for what it's worth. My conclusion is that solar and wind energy will grow, but cannot by themselves solve the GHG emission problem. That problem can only be solved by drastic cuts in energy usage (= lifestyle change = not a credible solution pathway) OR a dramatic shift to nuclear power (entirely feasible and sustainable long term in all respects). In my humble opinion, if SS would promote this view than SS has claimed the high ground of a science-based position on sustainable energy systems. If not, then you have opened this site up for unnecessary criticism, which would weaken your cause and mine.
Best regards,Joris
-
JvD at 22:57 PM on 15 March 2013Watts Interview – Denial and Reality Mix like Oil and Water
In this interesting article, it is stated that renewable energy can substitute for fossil fuels and doesn't even need fossil fueled backup. There is then link to a treatment on this site of the IPCC report on the potential of renewable energy. However, the IPCC report - while full of interesting information - does not at all inspire confidence that renewable energy is able to replace fossil fuels. The IPCC report in fact states in so many words that renewable energy sources will *not* likely reduce GHG emissions as much as is necessary. The claim of 'almost 80% renewables' is no more than an outlier single report by Greenpeace, which is itself deeply unsatisfying and superficial.
I love this website and consult it frequently as a valuable resource for understanding why and how climate change deniers are wrong. However, the treatment on this site of renewable energy and the challenge of moving to them for 100% of our energy supply is very, very poor indeed, I'm sorry to say. I urge the website owner to overhaul that part of the site thoroughly by noting (for example) very carefully the serious problems with the content of the IPCC renewable energy report, as detailed comprehensively by Ted Trainer here:
http://bravenewclimate.com/2011/08/09/ipcc-renewables-critique/
Another option would be for this site to refrain from tackling the question of sustainable future energy systems altogether, which is obviously not it's speciality. As it stands, the treatment of energy systems on this site damages the reputation of SS as a credible source, which I lament. Hopefully, it will be understood that this message is constructive criticism.Beste regards,
Joris
-
AndrewDoddsUk at 21:57 PM on 15 March 2013Watts Interview – Denial and Reality Mix like Oil and Water
Years of what could be termed 'discussions' with Creationists would lead me to refine #11 to 'when completely and utterly debunked, leave the argument for a while, waiting until you hope people have forgotton, then bring it back'
This goes past intellectual bankrputcy into the concept of negative credit scores..
-
gws at 21:25 PM on 15 March 2013Watts Interview – Denial and Reality Mix like Oil and Water
Jose @8
"I really like the first graph at DS#10."
In this case, credit goes to John Nielsen-Gammon, Texas State Climatologist, who first used this kind of analysis here and here.
-
OneHappy at 18:30 PM on 15 March 2013Shakun et al. Clarify the CO2-Temperature Lag
Thanks for your answer Tom. I'm impressed with the quick response. What you have written is a bit beyond me, but it looks like a good reply. I suspected the Shaviv objection was false. A lesson from this, it seems refutation of sceptical arguments can become a very complex business. This is the first time I've been out of my depth on the topic.
-
Tom Curtis at 16:04 PM on 15 March 2013Shakun et al. Clarify the CO2-Temperature Lag
OneHappy @152, Shakun et al use 30 (37%) proxies from the SH, and 51 (63%) proxies from the NH. Because of the method used by Shakun et al, that does mean the global reconstruction is weighted in favour of NH temperatures. Further, in the SH, 13 (43%) proxies are extra-tropical, while 17 (57%) are tropical; whereas in the NH, 24 (47%) are tropical and 27 (53%) extra-tropical. As tropical areas cooled less than polar areas, that difference in weighting also means NH temperatures run warm (show less temperature difference between glacial and interglacial than do the SH temperatures). In fact, the proxies are predominantly (59 out of 81) from a band from 40 degrees north to 10 degrees south, and band that saw minimal temperature change relative to other parts of the planet. That may well have led to an underestimate of global temperature differences between glacial and interglacial.
How very odd that Shaviv did not comment on these other distortions, expecially given the importance of the later to his discussion of climate sensitivity.
The fact is that with a limited number of unevenly distributed proxies, no method will prevent some distortion. Focusing on just one of these (NH vs SH) is nto good science, it is simply (at best) a failure to recognize the issues involved.
That being said, the oddest thing is that Shaviv does not show a comparison between Shakun et al's global temperature reconstruction, and that obtained by averaging the hemispheres. Perhaps the reason is that when you compare them, you get this:
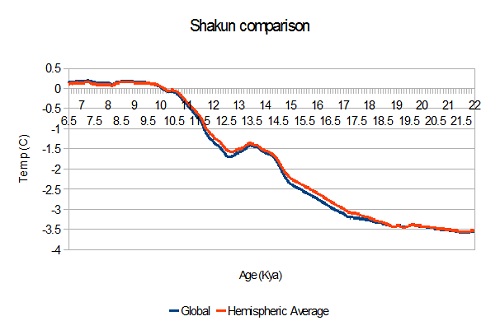
Does that look like deliberate manipulation to you? Or that it would compromise the results?
What it looks like to me is that Shakun et al took a reasonable approach (area weighing on grid cells) and that the difference between that and alternative approaches was so negligible that it was not worthwhile employing more complicated methods.
-
heb0 at 15:14 PM on 15 March 2013Watts Interview – Denial and Reality Mix like Oil and Water
The other misrepresentations are bad enough, but surely Watts knows by now that "BP" refers to 1950, not 2000 or 2013 or some other date. Sure, I can understand how someone might make that faulty assumption initially, as the naming convention isn't exactly intuitive, but at this point it just seems like it would have to be an intentional error by Watts. There isn't a good excuse for making this mistake repeatedly.
-
Jose_X at 14:28 PM on 15 March 2013Drost, Karoly, and Braganza Find Human Fingerprints in Global Warming
Tom Curtis 31 >> That the distribution of the ensemble predictions is skewed needs to be conveyed because science does not procede by only noting the points that help you make a point, and that fact was conveyed both by figure 3 and by the note about the mean.
OK, so maybe the paper wasn't suggesting that the models tending far from the average be removed (contrary to what I guessed in Jose_X 32).
-
Jose_X at 14:23 PM on 15 March 2013Drost, Karoly, and Braganza Find Human Fingerprints in Global Warming
Kevin:
Look at what the article said:
>> Some models (particularly cccma_cgcm3_1 [1 in Figure 3] and ncar_ccsm3_0 [6 in Figure 3]) predict more overall global surface warming than observed, although most models simulate the observed average global surface warming accurately. Due to those overpredictions, on average the models simulate a 0.167°C per decade average global surface warming trend from 1961-2010, whereas the observed trend is approximately 0.138 ± 0.028°C per decade, approximately 20% lower.
As Tom and/or others pointed out:
a) It appears that some models are off from the others. If we remove those stray cases, the ensemble average gets rather close to the "observed trend". The study highlights that point, perhaps suggesting future improvements to IPCC projections might be in filtering out the models that are far off the mode before calculating the new mean. [Haven't read the paper.]
b) The error bars you quoted are I think from our attempt to pin down the observed trends because there is inherently error in observation. It isn't the error bars of the models. If the observations were exact, there would be no error bars around that 0.138 value. On the other hand, a particular model ensemble might predict a trend of .167/decade with say a 95% confidence envelope through the first 3 decades of +/- .1. So if we had this model and the current observed values with error bars, then we'd have this: the observed might be as high as 0.138+0.028=0.166 while the model predicts that the temp might be as low as 0.167-0.1=0.067. In this case, we have that the actual temp -- best we can observe -- is possibly much higher than the lower bounds of the models. -
Jose_X at 13:51 PM on 15 March 2013Water vapor is the most powerful greenhouse gas
KR 160:
>> To be really clear, I'm speaking of total forcings, not deltas, as the deltas will be dependent on the temperature at the time of the delta - if you are looking at varying temporal evolution without equilibrium, all bets are off.
To clarify a bit on what you mean by "deltas", would you say that the following is a description of deltas that are off the table if each "slug" was carried out to equilibrium in the runs and if both the slugs and the overlapping large jump avoided feedbacks?
> So, not only does the RF of a large slug not equal the RF of the sum of a series of small slugs of the same size, but the RF varies depending on whether you are adding, or removing the slug.
My question was about the nature of RF. Specifically, I am interested in knowing if doing a 2x CO2 and when that is reached doing another 2x CO2 from that new equilibrium point and then another .. if those three added together would give the same value as if we do a single 8x CO2 calculation (or perhaps for some other ghg or other ratio). If the answer is that the values would differ nontrivially, then I have to wonder about the meaning of even a single RF used in a model (though I'm not worried if the model approximations are linear and reflect reality within a limited domain we would work in) and about whether what we get from the ideal situation of doing a 2x in one shot to calculate RF is meaningful to a planet that is adding CO2 in very much smaller increments (smaller relative to the ability of the planet to keep up, if that is true). A primary goal of mine is to understand the model decently. -
Jose_X at 13:36 PM on 15 March 2013Watts Interview – Denial and Reality Mix like Oil and Water
1: WRT DS#1, looking just at those two quotes, I agree with the thrust of shoyemore #2. I think the two Watts quotes misrepresent scientists, but they are consistent with each other and in painting a picture that Watts is more rational than the scientists. "Hey, Watts is rational and one of us normal people who realizes the climate is complex and obviously wasn't going to behave as predicted by scientists. The scientists are alarmists and don't even realize obvious things. The scientists are backpeddling and can't be trusted." Do you have other quotes by Watts making predictions that are incorrect?
2: I really like the first graph at DS#10. I hadn't seen that before. Will use it.
One simple improvement to this graph to me would be to have the frame showing the 3 trend lines display a little longer. Another small improvement might be to make the colored squares larger (or grow in some animated fashion as you transition to the 3 trend lines) so we can more easily verify the 3 trend lines (the skeptic that I am) by more easily seeing the colors and that the points do come from where alleged.
The impact of the graph might also be improved if juxstaposed with several other graphs: (a) the one showing clustering of el nino and la nina, (b) the escalator, and (c) the pic (or vid) showing an animated removal of cyclical effects from the temperature leaving a mostly rising temp. Putting the above 4 graphs into a little animated story would be nice. (a) suggests cycles are real and logical. The current graph, also showing the cycles are logical due to their clustering and periodicity, then highlights that a move to a higher trend might almost be inevitable. (c) offers an animated backup confirmation that the cycles are the problem. And (b) shows that in the absence of these further explanations, many of us will find it easy to fool ourselves.
3: DS#7 is a good point but also presents a lose-lose situation in the short term. If the climate scientists are right, you can say they are lucky, that alarmism is having a lucky streak, that they have simple minds and any day now the climate will prove them wrong. OTOH, if they misshoot too much, that clearly wouldn't be good either.
The slog is to try to offer as much evidence as possible as accessible as possible (eg, as is the goal and much success of this website) and within that context show that their decent predictions make sense while many contrarians have been far more incorrect, something that would be more clear only as time ticks away, unfortunately. A reality is that the skeptical mind without time to become an amateur climate scientist ultimately will wait out nature if they suspect scientists are untrustworthy an likely to exaggerate.
Another point is that it is important to try to avoid over-shooting on the high end, downplaying error bars, and downplaying our always somewhat limited understanding. People frequently judge success subjectively based on expectations being met or not. We know the story about crying wolf. While individual contrarians will cry wolf and come and go, the scientific community as a whole would be a greater loss if it placed itself in a position to be dismissed. The label "alarmism" effectively paints scientists as full of naivite or even as full of hubris, supposedly over-estimating dangers at every turn with lots of self-assuredness. Plus, if you are a bit conservative and undershoot a little, what are others going to do? Pick the top side and essentially promote action? Hopefully. Or they may undershoot more so and make it clear the closest predictions was the still conservative scientists. Of course, it's hard to do science in earnest and not try to be as accurate as possible, but the reality is we are biased creatures and we should continue to be careful and guard against actual alarmism.
The FAR report, even if using models less accurate than what we have now, did well in their summary by stating the following in a section titled "How much confidence do we have in our predictions"
> Uncertainties in the above climate predictions arise from our imperfect knowledge of
> future rates of human-made emissions
> how these will change the atmospheric concentrations of greenhouse gases
> the response of climate to these changed concentrations
> ... Secondly, because we do not fully understand the sources and sinks of the greenhouse gases, there are uncertainties in our calculations of future concentrations arising from a given emissions scenario
> Thirdly, climate models are only as good as our understanding of the processes which they describe, and this is far from perfect -
OneHappy at 13:30 PM on 15 March 2013Shakun et al. Clarify the CO2-Temperature Lag
DSL: no method, little more than a blog post: http://www.sciencebits.com/Shakun_in_Nature
-
DSL at 12:57 PM on 15 March 2013Shakun et al. Clarify the CO2-Temperature Lag
OneHappy, can you provide a link to Shaviv's methodology?
-
OneHappy at 12:53 PM on 15 March 2013Shakun et al. Clarify the CO2-Temperature Lag
On ScienceBits 21 April 2012 Nir Shaviv raised this objection to the Shakun et al. paper: "in order to recover their average "global" temperature, I needed to mix about 37% of their southern hemisphere temperature with 63% of their northern hemisphere temperature." So he is accusing them of deliberately manipulating the data by weighting it to get the result they wanted (ie that globally on average temperature lags CO2). I am interested in two aspects of this objection. 1) Is he correct, and if so how much does this compromise Shakun's results? 2) Assuming Shaviv is correct, would this mean that temperature does not lag CO2 only during the start of a period of warming (but it would during the mid and latter period), or would this apply across the entire period?
-
WheelsOC at 12:45 PM on 15 March 2013Watts Interview – Denial and Reality Mix like Oil and Water
The argument in talking point #3 is a guest post by Don Easterbrook, who still refuses to acknowledge getting the dates wrong in the ice core data (he isn't even consistent; his graphic indicates that the last known date in the record would be 1905 yet he refers to the end of the ice core data as 1950 in the body of his text).
Even though Easterbrook is well aware of these things, I posted a comment to that effect. We'll see if it gets through WUWT moderation unmolested.
All this is evidence that there should be a Denial Strategy #11: never give up on a bad argument no matter how often or thoroughly it's debunked.
-
Tom Curtis at 10:17 AM on 15 March 2013Drost, Karoly, and Braganza Find Human Fingerprints in Global Warming
Kevn @ a model projection is an estimate, from basic principles (Planck's law, Newtons laws of motion and gravitation, the laws of thermodynamics), known current conditions, and projections of future forcings, of the future changes in the climate system. Because of limited computer power they must be run at resolutions in which micro behaviour is not modelled, where micro-behaviour includes such things as tornados and hurricanes. As a result, the such micro behaviour must be matched to the resolution of the model by parametrization. Further, there is uncertainty about the exact values of some current conditions. Each model represents an estimate of the correct parametrization and value of uncertain conditions. Those estimates are not predicted by theory, and though modellers try to constrain them with observations, they cannot entirely do so.
The result is that our best prediction from basic physical principles is uncertain. Each model represents a sample from the range of possible parametrizations given current knowledge, and hence provides a sample from the range of possible predictions from basic physics given our current limitations in computer capacity and knowledge.
Because of that, our best possible prediction from basic physics is determined by the statistical properties of the ensemble of models. As such, our best prediction is the mean of the ensemble, with the uncertainty of the prediction being a function of the range of the predictions by individual models.
If you look at the GM section of figure 3 above, you will see that the mode of the distribution of GM trend predictions is very close to the values observed, but that two models drag the mean away from the mode. The distribution is skewed. In that situation I would have thought it was better to quote the median model trend rather than the mean of the trends, but there are certainly other ways to show this data, including (as the authors did) showing the full range of model projections relative to the observed trends. When you look at that comparison, it becomes obvious that the observations have not falsified the ensemble prediction. Not even close!
In that context, you are focusing on a single comparison to the exclusion of the full range of data presented to try and create the impression that there is a very large discrepancy between the ensemble prediction and observations. In fact, there is only a small discrepancy between ensemble predictions and observations because the observations lie close to the mode (and median) of the individual predictions within the ensemble. That the distribution of the ensemble predictions is skewed needs to be conveyed because science does not procede by only noting the points that help you make a point, and that fact was conveyed both by figure 3 and by the note about the mean.
You, however, faced with a usefull discussion of the full issue, have chosen to ignore the majority of the data presented to make a case that is not supported by the full range of data. It seems to be a specialty of yours.
-
Tom Curtis at 09:42 AM on 15 March 2013No alternative to atmospheric CO2 draw-down
An additional note on reserves: the "possible reserves" include all proven reserves, all probable reserves (defined as reserves having a 50% chance of being commercially recovered with current technology and prices), and all possible reserves (defined as having a 10% chance of being recovered at current technology and prices). Obviously as technology improves and prices rise, recovery rates will go well above the 50 and 10% figures. Further, as noted by MA Rodger, these reserves do not include the vast majority of tar sands, oil sands and shale oils, and nor do they include unconventional gas (clathrates and gas recoverable only by fracking or underground gasification).
The total resource base estimate by the IEA includes all fossil fuels currently estimated to be in the ground, excluding the majority of unconventional oil resources (tar sands etc) and clathrates. Gas recoverable only by fracking and gas from underground gasification will be included as part of current gas and coal TRB respectively.
I suspect these distinctions are academic, in any event. Once we get up towards 3,500 GtC total emissions, Mean Global Surface Temperatures are likely to be 6 degrees above the pre-industrial average out to 10 thousand years from now (peaking somewhere between that and 10 C above the preindustrial). I do not expect the ability or will to keep on burning fossil fuels will long survive in that sort of climate.
-
Tom Curtis at 09:27 AM on 15 March 2013No alternative to atmospheric CO2 draw-down
MA Rodger @49, thankyou for pointing out my error. As it happens, I made it consistently, ie, at each point where I should have mentioned Pg C, I mentioned Pg CO2. Consequently the entire post is correct once the substitution for the correct figure is made.
I should note that figure of one trillion tonnes Carbon as the achievable lower limit of emissions comes from Allen et al 2009, and certain related papers. A count of the best estimate of emissions todate is kept at trillionthtonne.org. They indicate that at current emission rates, the trillionth tonne will be emitted in June, 2041. Just 28 years!
With regard to the fossil fuel reserve, 5,000 GtC is approximately the World Energy Council 2010 estimate of possible reserves, which with emissions todate comes to 3,575 GtC. Possible reserves include reserves which have not been proven, or are uneconomic with current technology and prices and which estimates of the likilihood of future recovery are uncertain. The International Energy Agency 2011 reports a Total Resource Base of fossil fuels which, together with emissions todate, represents cumulative emissions of 16,700 GtC. Not all of that will be recoverable under any circumstance, but it is likely that new discoveries, especially as that figure does not include oil sands, tar sands and shale oil. If we are determined to exploit every economic fossil fuel resource regardless of consequences, given a few centuries we will, I think, go well beyond the 5,000 GtC estimate used by Archer. (Figures and sources taken from my spread sheet.)
-
Cornelius Breadbasket at 07:39 AM on 15 March 2013Watts Interview – Denial and Reality Mix like Oil and Water
Thank you dana - I'm very pleased that even a layman like me can grasp a little science :)
-
mikeh1 at 07:28 AM on 15 March 2013Pielke Jr and McIntyre Assist Christy's Extreme Weather Obfuscation
This debate is being reprised at The Conversation with an attack on the Climate Commission's Angry Summer report by the Pielke Jr associated Risk Frontiers group at Macquarie Uni. Similar bait and switch tactics being employed. The CC has issued a statement, Pielke Jr has weighed in.
http://theconversation.edu.au/weighing-the-toll-of-our-angry-summer-against-climate-change-12793
-
dana1981 at 07:05 AM on 15 March 2013Watts Interview – Denial and Reality Mix like Oil and Water
Cornelius @4 - also true. They are causally related (global warming causes climate change), so the terms are often used interchangeably, but they're not the same thing.
-
Cornelius Breadbasket at 06:46 AM on 15 March 2013Watts Interview – Denial and Reality Mix like Oil and Water
I've been led to understand that Global Warming and Climate Change are two different things. Global Warming means global temperature increase which causes Climate Change - a shift in the long-term weather patterns. Watts 'proponants shifted the term' argument is very easy to deflate when you explain it like this.
-
Kevin8233 at 06:33 AM on 15 March 2013Drost, Karoly, and Braganza Find Human Fingerprints in Global Warming
Composer99,
What I was using is the reality of the facts.
The observable trend over the period is 0.138 +/- 0.028 degrees C/decade.
The reported average trend is 0.167 degrees C/decade.
The fact is 0.138 + 0.028 = 0.166.
The fact is 0.166 is less than 0.167.
All I'm saying is that it is this article that is not very convincing.
-
scaddenp at 06:19 AM on 15 March 2013Drost, Karoly, and Braganza Find Human Fingerprints in Global Warming
Kevin, since you keep going on about short term trends, (the flattish last 10 years), then lets see if I understand what you mean.
Am I correct that, deep down, you reject the idea that trend is mostly due to negative/neutral ENSO state and believe it is due to some other part of the climate system. And furthermore, if we only understood this "other part" of the climate system we would realise AGW isnt the problem that we thought. Is this what you believe?
Or alternatively, do you believe the ENSO has gone fundamental change (something models should have found but havent) and it will remain mostly low and temperatures will be stable from now on?
-
Composer99 at 05:56 AM on 15 March 2013Drost, Karoly, and Braganza Find Human Fingerprints in Global Warming
Kevin:
Since when is it my responsibility to report to the paper's authors (or, since your claim follows from the OP text rather than from the paper, to Dana) what Tom feels are issues with the way the paper handles the observational datasets?
What I was taking issue with was not the content of the paper itself, but your comment upthread, which you defended because you weren't "trying to say anything 'statistically speaking'".
You are questioning the quantified analysis using.. what, exactly? Your gut feelings?
As I said, not very convincing.
-
Kevin8233 at 05:21 AM on 15 March 2013Drost, Karoly, and Braganza Find Human Fingerprints in Global Warming
Composer99,
Have you expressed these statistical concerns to the author? After all, it was the author who compared an averaged trend with observed trend. As noted earlier by Tom Curtis, these trends are from different models, and averaging them isn't the best thing.
I don't have all the data. I don't want to do all the calculations. I don't need to. I, again, was just making the point that the author's chosen comparrison does not help make his point.
You are making a claim about trends that are computed using statistical techniques. So if you're not trying to say anything about the statistics, your claim won't be particularly convincing.
As noted above, the author made a comparrison of an average trend to the observed trend. It is interesting that his average does not include any +/- , which questions the statistical legitimacy of this averaging. As such, any comment regarding this comparrison does not require a statistical test.
My claim doesn't have to be particularly convincing, the data already is!
-
Composer99 at 04:04 AM on 15 March 2013Drost, Karoly, and Braganza Find Human Fingerprints in Global Warming
Kevin:
I was not trying to say anything "statistically speaking", [...]
There's your problem right there. You are making a claim about trends that are computed using statistical techniques. So if you're not trying to say anything about the statistics, your claim won't be particularly convincing.
Prev 967 968 969 970 971 972 973 974 975 976 977 978 979 980 981 982 Next


