


 Arguments


Recent Comments
Prev 980 981 982 983 984 985 986 987 988 989 990 991 992 993 994 995 Next
Comments 49351 to 49400:
-
curiousd at 05:24 AM on 25 January 201316 ^ more years of global warming
I found "Atlantic Forcing of Persistent Drought in West Africa" by Shanahan, et al. in Science, 324, 2009. They did x-ray fluorescence of elements in lake sediments that they tie to temperature and drought, connecting the monsoon to the AMO. Anyway, going back 1000 years plus, it sure looks like they see something similar to our modern record in terms of these oscillations, but with a power spectrum that peaks at about 40 years, not 70. So, why should not I say....experimentally so far in my literature search the AMO is real? They also say there is a good correlation between their results and tree ring studies. I was expanding some of these plots on 500 year time scale with photoshop. I am going to systematically dig more of this stuff up. If there is an interst I will post some it. -
Philippe Chantreau at 04:42 AM on 25 January 2013Lessons From Past Predictions: Ridley vs. IPCC and Hansen
Ridley is yet anbother one of those individuals whose ramblings deserve no attention whatsoever from the ones who can think, as shown above. It is really unfortunate that so many charlatans can gather so much attention these days. It seems to me there were times when the average ability of the population for critical thinking was much higher. -
renewable guy at 04:11 AM on 25 January 2013Was 2012 the Hottest La Niña Year on Record?
If I could have a little help on a topic that I think applies to this forum. I was given this link stating that 2006 should now be a la nina year and therefore 2012 is no longer the warmest la nina year on record. Link What constitutes a neutral year? 2006 starts with a la nina event and ends with a El Nino event. I suspect that Tisdale is being his PR WUWT self, I would just like to know the details of this.Moderator Response: [PW] Hot-linked reference. -
dana1981 at 02:24 AM on 25 January 2013Lessons From Past Predictions: Ridley vs. IPCC and Hansen
John Brookes @1 - yes, Ridley is one of those "lukewarmers" who's not in total denial, but also advocates for climate inaction because he doesn't believe AGW is a problem. From a practical standpoint for those trying to solve this problem, it's really not any better. Composer @2 and John Russell @3 - yes, a good scientist will admit when his prior conceptions were wrong. Ridley apparently will not (this is also a problem for some other contrarians like Richard Lindzen). -
John Russell at 02:04 AM on 25 January 2013Lessons From Past Predictions: Ridley vs. IPCC and Hansen
Ridley is not sceptical, he's heels-in-the-mud entrenched. Completely unwilling to consider evidence, he clearly exhibits the ideological zeal of which he accuses others. Is he an example of psychological projection? -
Composer99 at 23:56 PM on 24 January 2013Lessons From Past Predictions: Ridley vs. IPCC and Hansen
I think the contrast between Hansen's re-assessment of his 1988 projections vs. Ridley's doubling down on his 1993 projections makes plain the difference between scientific and pseudo-scientific thinking. (If anyone cares to quote-mine the above, let me also note that the contrast makes plain that it is Ridley who is engaged in the pseudo-scientific thinking here.) -
John Brookes at 21:38 PM on 24 January 2013Lessons From Past Predictions: Ridley vs. IPCC and Hansen
At least Ridley predicts warming... -
curiousd at 20:50 PM on 24 January 201316 ^ more years of global warming
Tom Curtis and Kevin, Does the the lowest graph in Tom's post 104 still contain the CO2 forcing? In my case I have subtracted the CO2 forcing for my graph in 102 above. It is not obvious to me that you would not get something similar to my graph in 102 if the lowest graph in 104 still contains the CO2 forcing, but that was removed using my method. -
curiousd at 20:34 PM on 24 January 201316 ^ more years of global warming
Practical point here: Forgetting about whether my graphs in 101 and 102 are "publishable", clearly not...there is the practical question of how to best present the case for significant AGW to a hostile (mostly deniers) audience. I still like these long term plots of temperature versus log CO2 ratio. I show in 103 above that the 2 degrees C.S. is consistent with Foster and Rahmsdorf and others in the recent limit in which the first term in the expansion of the log is all you need. If I do the same log plot with Berkeley Earth I get 3 degrees C.S., not 2 which makes sense as Berkeley Earth is land based. (I recognize that these C.S. values are a form of transient response, and that once Arctic sea ice melting really strikes the C.S. will probably increase?) IMO, if you need to make the case that AGW is real and dangerous to an audience, the argument that "The climate simulations say it is happening and dangerous, therefore it is" is an argument that does not hack it, even to scientifically trained, but non climate trained, scientists and educators. This AMO thing......I am now bound and determined to go through the publications with a fine toothed comb...is there real evidence for a historical 70 year cycle or not, I mean going back before there was any AGW at all? If there is such evidence we can't just say there is no AMO and will have to deal. -
Kevin C at 19:55 PM on 24 January 201316 ^ more years of global warming
Tom: The natural-subtracted versions of the plot give a pretty good idea of the residuals... see here. The pure residuals will need me to implement csv output on that web app, it's on the to-do list, but very busy atm. -
curiousd at 18:20 PM on 24 January 201316 ^ more years of global warming
Yes, but I am doing the CO2 forcing correctly, no, and the transient C.S. due to CO2 I get is reasonable. Somehow Zhou and Tung are getting a wildly wrong answer, with a CO2 C.S. about half what it really is? -
Tom Curtis at 18:05 PM on 24 January 201316 ^ more years of global warming
Curiousd @102, once again, total CO2 forcing is not the same as total anthropogenic forcing. Taking one recent assessment of the anthropogenic forcings since 1850, Skeie et al (2011), we see that total anthropogenic forcings were negative till about 1880, and zero from then till about 1900. After that they rose till about 1940, before falling back to zero around 1970, rapidly rising there after (red dashed line): That is quite different from the pattern exhibited by CO2 forcing over the same period (dark blue line):
 Note that Skeie et al do not show the close approximation between CO2 forcing and total anthropogenic forcing in the 21st century that is a feature of the IPCC AR4 and GISS forcing data. The aerosol forcing is uncertain, so it is unsurprising that this disagreement should exist. More importantly, the close approximation of the two values in the early twenty first century in those data sets that show it is a coincidence only, and does not apply throughout the nineteenth or twentieth century.
It follows that what you show as a residual of the temperature record minus ENSO, solar, volcanic, and anthropogenic forcings actually contains a large component consisting of the time varying difference between CO2 and total anthropogenic forcing. If you use all forcings (in this case from GISS, and with GISTEMP as the temperature record), the residual will be much smaller, and without the apparent pattern shown in your residual:
Note that Skeie et al do not show the close approximation between CO2 forcing and total anthropogenic forcing in the 21st century that is a feature of the IPCC AR4 and GISS forcing data. The aerosol forcing is uncertain, so it is unsurprising that this disagreement should exist. More importantly, the close approximation of the two values in the early twenty first century in those data sets that show it is a coincidence only, and does not apply throughout the nineteenth or twentieth century.
It follows that what you show as a residual of the temperature record minus ENSO, solar, volcanic, and anthropogenic forcings actually contains a large component consisting of the time varying difference between CO2 and total anthropogenic forcing. If you use all forcings (in this case from GISS, and with GISTEMP as the temperature record), the residual will be much smaller, and without the apparent pattern shown in your residual:
 (Kevin C shows a picture of anthropogenic forcings used here. I would appreciate it if he were to show his actual residuals as well.)
Obviously exact results will depend on which set of forcing data you consider more accurate and use.
(Kevin C shows a picture of anthropogenic forcings used here. I would appreciate it if he were to show his actual residuals as well.)
Obviously exact results will depend on which set of forcing data you consider more accurate and use.
-
KJD at 18:04 PM on 24 January 2013Putting an End to the Myth that Renewable Energy is too Expensive
#60/61 winfield100: the analysis on reduced risk/impact of blackouts would apply to any form of distributed generation, e.g. small diesel generators. They would be able to provide a similar service even during night-time. Cheaper still would have been to clear the vegetation around the transmission line... -
curiousd at 17:55 PM on 24 January 201316 ^ more years of global warming
O.K. see above graphs. Here is objection number one to Zhou and Tung. Foster/Rahmsdorf get 0.17 degrees C per decade. Lets check this with expectations. 1. C2/C1 = 2^ (temp/Tc.s.) 2. log base 2 (C2/C1) = temp/T c.s. 3. temp = T c.s. log base 2 (C2/C1)= T c.s. Ln (C2/C1)/ .693 [ .693 is natual log of 2] 4. Expand Ln (C2 / C1) around unity. Leading linear term is [(C2/C1)-1]. What is ( d/d time ) of [ (C2/C1) - 1 ] these days? maybe 2 ppm /year. Say {(384 - 280)/280} minus {(382 - 280)/280} ~ .3742 - .3643 = .007 . multiply by C.S. of 2, divide by .693 = .02 per year or 0.2 per decade. 5. Foster Rahmsdorf get about .17 degrees per decade, which is pretty close to what I get (0.20) for transient climate sensitivity of 2 degrees per doubling CO2 in the limit where we only need the first term in the expansion of the log around unity. By Zhou and Tung their AMO removal makes the increase per decade due to CO2 go down to less than half that which is the C.S. of CO2 alone no water vapor feedback!!!!! Spencer, et all are rejoicing!!! But if you do this right, as in my top graph, clearly everything fine with transient C.S. of about 2 degrees per doubling of CO2. Now go to second graph.....I think I recall there was recent work attributing the big 1940 peak partly to aerosols, somehow, but I also think I recall a phrase to the effect that they could not completely get all that peak this way. Then it is IMO most interesting that if you subtract expected CO2 , ENSO, solar, and volcanoes at the end of the day we are left with three peaks with about 70 year spacing? So maybe the "What's left over" does contain some AMO. And it looks like we are presently kind of near the top of a smaller such peak,and global temp increases are slowing, though clearly if analyzed correctly, the CO2 eventually takes over and we do have about the expected transient C.S. -
KJD at 16:41 PM on 24 January 2013Carbon - the Huge and Yet Overlooked Fossil Fuel Subsidy
To add to the comments of Ron @15: Considering externalities is useful but there are problems in calling them subsidies. Firstly, true subsidies are more likely to be susceptible to exact calculation, whereas externalities must necessarily be estimated. Secondly, the policy solution to each is very different. Subsidies can simply be withdrawn, while pricing externalities is more complex and requires institution of measurement and audit protocols for example. I'd also note that most estimates of subsidies in Australia for example incorporate tax expenditure that is a rebate on fuel excise already paid for certain qualifying uses of that fuel. So it's effectively a lower tax rate rather than a subsidy (this may or may not be a sound policy of course). Since 1 July 2012 the rebates have been lowered (i.e. tax rates raised) to include an estimate of the externality due to greenhouse gas emissions. -
curiousd at 14:40 PM on 24 January 201316 ^ more years of global warming
 Moderator Response: [DB] Fixed image.
 -
curiousd at 14:11 PM on 24 January 201316 ^ more years of global warming
 Moderator Response: [RH] Fixed image.
 -
curiousd at 13:09 PM on 24 January 201316 ^ more years of global warming
Hi, I thought of the clearest way to state what I did here. 1. Start with data that has had ENSO,solar, volcanoes removed 2. Go all the way back to 1861, (where the linear approximation fails...note Zhao and Tung cannot go there!(their fig.4)) and plot log2( C/C1861) on horizontal axis, temp on vertical. Find good linear fit with transient C.S close to two. 3. Subtract the linear fit from data. Now we have data with volcanoes, solar, ENSO, and expected human caused AGW all removed. 4. Then you get,plotted against year what I call... Ta ta te ta te taaah "What's Left!" IMO the plot of "what's left" versus year is veerry interesting. Working on posting these. -
rockytom at 11:44 AM on 24 January 2013New textbook on climate science and climate denial
In answer to comment #12 by calyptorhynchus, the second volume will be a tour through climates of the past and how our current global climate compares with past climates. There will also be coverage of health impacts on both animals and plants throughout Earth history. Volume 2 is in the planning stage and any and all suggestions are welcome. To comment #14 by jimvj, sorry about misspelling our great president's name. It's something neither the authors nor editors caught. The second edition will correct the spelling. -
jimvj at 11:30 AM on 24 January 2013New textbook on climate science and climate denial
I used the "Look Inside" feature at Amazon to scan the Table of Contents; the first name of Barack Obama is misspelled as Barak Obama (22.6.4 section header). -
16 ^ more years of global warming
Tom Curtis - One problem I see in discussing the AMO is multiple definitions; ESRL's, Trenberth, etc. Each definition really requires its own analysis, something not clear when discussing the "AMO" without further qualifications. Kevin C - My expectations match your results. I'm looking forward to your updates. -
Kevin C at 09:37 AM on 24 January 201316 ^ more years of global warming
For what it's worth I've tried AMO and PDO. In both cases the statistics reject adding them to the model. In neither case does adding them change the conclusions. There will be an update in the next month or so including this and other FAQs. -
Tom Curtis at 09:05 AM on 24 January 201316 ^ more years of global warming
KR @95, land temperatures rise faster than sea surface temperatures under forcing. That means that GISTEMP will rise faster than SST under forcing solely on the basis that it includes large sections (30%) of land, meaning a chart of the North Atlantic SST anomaly minus Gistemp is not a useful indicator of anything much. Far more useful, and a far better definition of the AMO, is the North Atlantic SST anomaly minus the Global SST anomaly, as shown in the third panel of this graph:
-
RedPanda at 07:44 AM on 24 January 201316 ^ more years of global warming
Fantastic video! May I ask how did you do your animations? I work with time series all the time and would love to have something like this for presentations. It was awesome! -
vrooomie at 04:37 AM on 24 January 2013Subcap Methane Feedbacks. Part 4: Speculations
"Once the Arctic carbon-cycle feedback boulder starts rolling down the mountainside, its course will be uncertain. Perhaps it will quickly come to rest again, or maybe it will trigger an avalanche that will wipe out the village below. This would be an entertaining and educational spectacle to watch from a safe vantage point on another planet, but the responsible thing for those of us who live here to do, of course, is to stop the fossil fuel emissions that are currently levering this boulder over the brink." Great final graph. Well-done! -
16 ^ more years of global warming
jyyh - Given that the AMO (definition here) is a detrended sea surface temperature of the northern Atlantic, it's hugely correlated with global temperatures. Tamino discusses that here; if you look at the difference between northern Atlantic SST and GISTEMP trends, it's not terribly useful: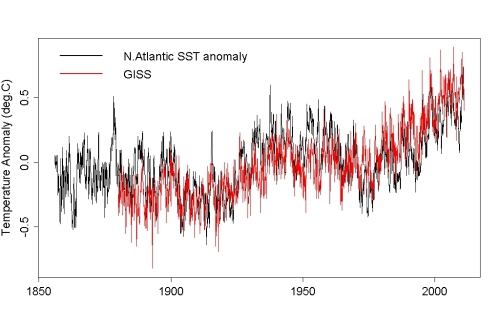
 Global temperatures are really the cause, not the effect, of most of the AMO. Further evidence to this end comes from looking at lead-lag relationships (here's another Tamino post on this), where analysis shows a somewhat stronger correlation with AMO lagging temperatures by a month or two - and a negative delay is a very strong argument against causality. ENSO, by comparison, best correlates with an ENSO leading by 4-5 months, the correct causal direction.
If you attempt to relate AMO to global temperatures, there is a tendency to actually be subtracting the signal from itself, which leads to some very unrealistic estimates of climate sensitivity.
---
The PDO may have some influence on global temperatures, but quite frankly we (a) don't have a huge amount of data, and (b) the duration and strength of observed PDO changes don't scale to the rapid and large temperature changes of the last 150 years. I suspect (IMO) that the PDO is at most a minor influence.
Global temperatures are really the cause, not the effect, of most of the AMO. Further evidence to this end comes from looking at lead-lag relationships (here's another Tamino post on this), where analysis shows a somewhat stronger correlation with AMO lagging temperatures by a month or two - and a negative delay is a very strong argument against causality. ENSO, by comparison, best correlates with an ENSO leading by 4-5 months, the correct causal direction.
If you attempt to relate AMO to global temperatures, there is a tendency to actually be subtracting the signal from itself, which leads to some very unrealistic estimates of climate sensitivity.
---
The PDO may have some influence on global temperatures, but quite frankly we (a) don't have a huge amount of data, and (b) the duration and strength of observed PDO changes don't scale to the rapid and large temperature changes of the last 150 years. I suspect (IMO) that the PDO is at most a minor influence.
-
MA Rodger at 00:06 AM on 24 January 2013Open Letter to London Mayor Boris Johnson - Weather is not Climate
Bob Loblaw @21 & JasonB @22. The UK Tory party's leader election process is a little odd. It still has the same rules that saw Thatcher unexpectedly ousted as Prime Minister in 1990. That took just 14 days. The rules allow a vote of no confidence in the leader by Tory MPs if 15% of them call for it (and the call is an anonymous one). Losing the no-confidence vote results in a party leadership contest. For the Tories it matters not that the leader is also Prime Minister of the country. To win the leadership you need 50% of the vote of Tory MPs and if that is not achieved, the least successful candidate is eliminated and the vote re-run. Due to tactical voting and backroom deals, this system can throw up unexpected winners like John Major and Iain Duncan Smith. Remember Cameron was far from being the front runner in 2005. If it wasn't for the coalition partners, Cameron today would be very vulnerable to a challenge from the growing number of his dissatisfied right-wingers. Then again, if the coalition agreement didn't bind Cameron's hands, he may well have done a lot more of their bidding including reversing the UKs GHG policies.Moderator Response: [PW] All interesting, folks, but maybe we can steer this back to the topic of the post? Election processes are good to know about but perhaps this isn't *quite* the correct venue to elaborate a lot further on that subject. -
jyyh at 00:03 AM on 24 January 201316 ^ more years of global warming
imho the AMO (and PDO) indexes should be incorporated in areal predictions. it's still imho possible that they are representations of an 'ocean harmonic' with the approximate periods they suggest. is there a third hithero unnoticed ocean index that would fall in between AMO and PDO peaks making these negliglible in the whole system of global heat balance? (the missing heat problem comes to mind, though that was largely solved). i'm also curious of the possibility of such a long period oscillation but thus far haven't found any detailed temperature records for the last 1000 years that would be necessary to state there is a long period harmonic in the ocean. maybe it is just the variations in aerosols (use of unleaded lowsulfur gas f.e.) that makes the 20th century reconstruction hard. One can use log CO2 instead of linear assumption, I've seen that done somewhere (it was probably someone commenting on Tamino) but I don't remember when and did he take things mentioned by Tom and Kevin into account. Of long records, I tried once to create a volcanic record for the last 1000 years but there was a snag in the Carbon dating system and I've still not corrected that. -
Tom Curtis at 00:02 AM on 24 January 201316 ^ more years of global warming
Dikran Marsupial @92, a linear function is a reasonable approximation to the rise in CO2 forcing only since about 1970. Taken since 1850, it overstates the rise in forcing significantly up to then, and significantly understates it thereafter. The following shows HadCRUT4 plotted against 0.5 times CO2 forcing, ie, a transient climate response of 1.85 C per doubling of CO2: For what it is worth, this crude model shows a strong correlation to global temperature rise over that period, with an r^2 of 0.754. The slope of the scatter plot of observed vs predicted temperatures is 0.72, indicating temperatures have risen faster than is predicted by this model:

-
Dikran Marsupial at 23:35 PM on 23 January 201316 ^ more years of global warming
@curiousd As CO2 is rising approximately exponentially with time (which is I suspect responsible for the near constant airborne fraction), there isn't a great deal of difference between taking radiative forcing to be logarithmic in CO2 or taking it to be a linear function of time. Note also the 2 degrees C per doubling CO2 will be an estimate of transient climate sensitivity and that equilibrium climate sensitivity will be higher. -
curiousd at 23:26 PM on 23 January 201316 ^ more years of global warming
Tom Curtis, Thanks for comments! IMO the log CO2 is an improvement on the assumption that AGW is linear with time, especially going back to 1875. If you try to fit a logarithm with a straight line it does not work well. Is it better to assume linearity, and limit data to a really short time period, then fit that with an AMO index, or assume Log CO2 and take advantage of the longer time period and not try to fit something that depends itself on the AGW trend? (BTW the Berkeley Earth folks do use a log fit to their long term temp data). It is not clear to me that the short time period choice is better, and at the same time I anticipate that the paper by Zhou and Tung will become one of the main denialist staples. If it is o.k. I will post my two curves here and see what people think. -
jyyh at 23:25 PM on 23 January 20132013 SkS Weekly Digest #3
It looks like the koeln university predicts the southern Greenland melt of 2013 is under way. Also the SSW (sudden stratospheric warming) event up in the stratosphere might be worth of note (not common in winter). Ice circulation this winter has been stronger than usual, likely much of it is still (in january) because the melt extent last summer. At least in the Baltic, only when the temperatures start to warm up for the spring the last of the leads close. Anyway
the circulation pattern has been unusual. If there was no GW, that sort of circulation would have been interpreted as building thicker ice, but this year there are still places
where ice may expand I doubt this is happening.
OK, now that I learned this image stuff (again) I'll try to link outside: 'Wipneus' @ Neven's Arctic ice blog has done a great job in extracting ice volumes (from the Piomas model), gridding and extrapolating to (what may be Maslowskij's style) zero. If the extrapolation 'holds water' the result is rather notable.
Much talk there, some going over my head. Anyway here's the image (let's see if it sticks)
Ice circulation this winter has been stronger than usual, likely much of it is still (in january) because the melt extent last summer. At least in the Baltic, only when the temperatures start to warm up for the spring the last of the leads close. Anyway
the circulation pattern has been unusual. If there was no GW, that sort of circulation would have been interpreted as building thicker ice, but this year there are still places
where ice may expand I doubt this is happening.
OK, now that I learned this image stuff (again) I'll try to link outside: 'Wipneus' @ Neven's Arctic ice blog has done a great job in extracting ice volumes (from the Piomas model), gridding and extrapolating to (what may be Maslowskij's style) zero. If the extrapolation 'holds water' the result is rather notable.
Much talk there, some going over my head. Anyway here's the image (let's see if it sticks)

-
Kevin C at 23:07 PM on 23 January 201316 ^ more years of global warming
To add to Tom's point, a more sophisticated version of the same calculation would be to use the 2-box model with a full set of forcings. This can give you a TCR estimate directly. However I still don't think you would have a publishable result, for the simple reason that the result is totally dependent on the uncertainties in the forcings. You can get pretty much any answer you want. This type of calculation is useful for understanding the likely contribution of different forcings and it can provide a link between uncertainties in the forcings and uncertainty in TCR, but it cannot give us a absolute answer. It is an interesting and useful tool, but only when used within its limitations. -
Tom Curtis at 20:13 PM on 23 January 201316 ^ more years of global warming
curiousd @88, I do not know whether or not the used of digitized data would be a bar to publication, but the use of just log CO2 as the only forcing probably would be. It is well known that there are a number of forcings in addition to CO2. By most analyses, the CO2 forcing has been approximately equal to the sum of all anthropogenic forcings, with negative forcings (aerosols) approximately balancing other well mixed greenhouse gases. However, the uncertainty on the aerosol forcing is large, so that balance is not guaranteed, and nor will it be exact at all times. Consequently, while the use of log CO2 is useful for teaching, it is doubtful that it is useful in a publishable result. One small point, the 2 degree C per doubling of CO2 calculated equates to the transient climate sensitivity rather than the equilibrium climate sensitivity. There is significant variation in the ratio of TCS to ECS in models, but the central estimate is around 0.66, suggesting an equilibrium climate sensitivity of about 3 C per doubling of CO2 from your analysis. -
curiousd at 19:20 PM on 23 January 201316 ^ more years of global warming
I have now done the following: 1. Went to Zhao and Tung again. At one point they show a graph where they have regressed volcanos, solar, ENSO from temperature. I digitize this graph using online manual digitizer. 2. I look up Law Dome and Mauna Loa CO2 and correctly plot the temp, as digitized, versus log Conc/Conc 1875 as Zhou and Tung should have done. 3. Straight line fit yields C.S. of close to 2 degrees C per doubling CO2. (Not small C.S. Zhou and Tung get). 4. I subtract the straight line fit from their temperatures to yield a plot of temperature versus year showing three peaks about 70 years apart. We at present appear to be on top of the last, and smallest, of the three peaks. Question:(a) I think in principle this result is publishable, but it is based on digitizing someone else's result. I have published considerable in - say - Phys Rev, but not climate journals. Is the fact that I used digitized data going to be a killer? (b) If consensus answer to (a) is "forget it" would anyone here be interested in collaborating, someone who knows how to regress volcanoes, ENSO, which I do not? -
jyyh at 15:13 PM on 23 January 2013New textbook on climate science and climate denial
Congrats, John Cook! You'd be the 2nd person I know who has his name on the cover of a Springer book. Did someone from Springer ask you to write this? It looks like it handles the subject very broadly 'Pliny the Elder', 'History of Science'??? There are definitely chapters in there I'd need to read in order not to make a fool out of myself in scientific discussions. I've no influence on what the local university does in it's library, though I've got a couple of friends who might have. Unfortunately one is a mathematician, and the others ecologists. One of them might have good contacts to physics dept, though. I believe the Enviro intro classes still go by the classic 'Understanding the Forecast' by David Archer, but I'd have to ask about that. -
JasonB at 14:46 PM on 23 January 2013Open Letter to London Mayor Boris Johnson - Weather is not Climate
Tom @17, a much closer approximation would be no electoral college and the majority leader in the House of Representatives is the head of government (Prime Minister) instead of the President, and the secretaries (ministers) are all members of Congress and appointed by the majority leader. (The minority leader would be called Leader of the Opposition, and he would in turn appoint "shadow ministers" who are responsible for keeping an eye on the corresponding minister.) The head of state would still be the President (Queen or Governor General, depending on country) but the role is not a political one, more symbolic (but with reserve power that is rarely exercised). The key difference with this rather than the electoral college is that those choosing the leader are (usually) politicians who's political future depends on the success of their choice, so being Prime Minister is a much more precarious position that can be revoked at any time (as happened to Australia's Prime Minister a couple of years ago) if the members of the ruling party get nervous about their political prospects at the next election. Different parties can have different rules about who gets to vote for the leader of their party and when but members of the party who have been elected to parliament is very common. (The Australian Democrats elected their leader on a popular vote of all party members, if I recall correctly.) The House of Representatives can also effectively dismiss a PM at any time by passing a motion of no confidence. (Technically, the person picked to become PM is the person who convinces the head of state that they can survive motions of no confidence, which would naturally be the leader of a party that happened to have a majority in the House of Representatives but can also be a minority leader if they can get enough other MPs to agree not to support motions of no confidence, such as the current Australian PM.) -
Bob Loblaw at 14:08 PM on 23 January 2013Open Letter to London Mayor Boris Johnson - Weather is not Climate
Tom@17: ...well, in Canada the executive branch (cabinet ministers) also need to be selected from the MPs (elected) and senators (appointed), and the governing party almost always has a majority in the House, so you don't get the dysfunctional US pattern of a President without support in Congress, and when the government doesn't have a majority the whole government can fall on confidence motions, giving the electorate another chance without having to wait until the normal end of term. And having more than two parties gives more choice, and less polarization (although we're working on that). ...but other than that, pretty much the same. -
calyptorhynchus at 13:10 PM on 23 January 2013New textbook on climate science and climate denial
What does the second volume cover? I can persuade my institution's library to buy vols 1 & 2, but only if the second volume has coverage of the health impacts of global warming. -
Mikemcc at 11:43 AM on 23 January 2013Open Letter to London Mayor Boris Johnson - Weather is not Climate
I have submitted a message to his official communictaions site. I would advise others to do so, but please keep it very polite, we don't want to stoop to the lows of the more outragous deniers! Official Communications site -
Mikemcc at 11:20 AM on 23 January 2013Open Letter to London Mayor Boris Johnson - Weather is not Climate
Increased winter precipitation is even mentioned! "Hotter and drier and warmer and wetter The summers are set to get hotter – by an estimated 1.6°C in the 2020s and 2.7°C in the 2050s. They are also getting drier – by an estimated 7% in the 20020s and 19% in the 2050s. The winters by contrast will get warmer and wetter – 6% wetter in the 2020s and 14% in the 2050s. In London we face three major challenges as a result of this changing climate and weather: •flooding •drought •heatwaves. To ensure we stay on top of the threats, we are responding to each challenge with a set of management measures that form part of the London Plan. LinkModerator Response: [PW] Hot-linked reference -
Mikemcc at 11:17 AM on 23 January 2013Open Letter to London Mayor Boris Johnson - Weather is not Climate
His comments don't even fit in with his official policy! “London has an unrivalled opportunity to benefit from the shift to a low carbon economy. The time for trials and experiments is over - we are putting in place large scale programmes that can deliver significant CO2 reductions and billions of pounds of energy savings.” Boris Johnson, Mayor of London http://www.london.gov.uk/priorities/environment/climate-change -
Sceptical Wombat at 10:13 AM on 23 January 2013New textbook on climate science and climate denial
As far as content review is concerned it is worth noting that Salby has published a textbook which includes his theory that the increase of CO2 in the atmosphere is not driven by human emissions. So far he has been unable to publish it in a peer reviewed journal. Of course this is a very small part of a text book that is presumably otherwise accurate. -
Sceptical Wombat at 09:45 AM on 23 January 2013New textbook on climate science and climate denial
I intend to recommend it for my local library. My experience in the past has been that they almost always buy books I recommend - though this one may prove a little pricey. The advantage of doing this is that as well as getting to read it you make it available for other readers. -
Tom Curtis at 09:18 AM on 23 January 2013Open Letter to London Mayor Boris Johnson - Weather is not Climate
Bob Loblaw @16, in other words, it is pretty much the same as the US system, except the "electoral college" gets to hang around and be the legislature. -
Bob Loblaw at 09:06 AM on 23 January 2013Open Letter to London Mayor Boris Johnson - Weather is not Climate
Phil, Shoyemore: Oh, I agree that the Queen doesn't really have much choice. In Canada, it's the Governor-General that doesn't have much choice. The only time it gets interesting is when one party doesn't have a clear margin of seats, or has lost a confidence vote shortly after an election, and there is a question of coalitions or PMs from the non-leading parties. Then you get the constitutional lawyers arguing about precedents, the pundits pretending they know more than the lawyers, and the public wondering what it's all about. The point is, there isn't an election for Prime Minister. You get elected to the house as an MP, not a PM, and you get chosen (maybe "elected") by your party to become leader. If you become leader of an opposition party, then people can elect your MPs in the hope that you'll become PM. If your party already forms the government, then you can become PM by being chosen as leader, even if the people never had a say. -
shoyemore at 08:40 AM on 23 January 2013Open Letter to London Mayor Boris Johnson - Weather is not Climate
Bob Loblaw #13 The British have an unwritten Constitution, or accretions of tradition over the the years. The day when the Monarch could independently choose the Prime Minister are long gone - now the outgoing PM (one who has lost the Party leadership, lost an election, retired or lost a vote of confidence) "advises" the Monarch on whom to call to form a Government - always the leader of the strongest party in the House of Commons. Boris is an eccentric, an endearing one, a true original, but I think pretty shrewd on the inside. He has made quite a competent Mayor of London, and he surely must be looking for his next career move. I think this is a false step on his part, but he might undo it with a brilliant speech somewhere on science. He has been contradictory in the past. I think you are right in that this is not really for public consumption, but a politician saying to a group of potential supporters "I am one of you". Bit off-topic I suppose, but when an ambitious politician starts sounding off on climate, then look out. There is more going on than meets the eye. -
Bob Lacatena at 08:29 AM on 23 January 2013New textbook on climate science and climate denial
What are the chances that I can convince my daughter to take a course that uses that as the text? Then I can inherit her copy... :) -
Phil at 07:56 AM on 23 January 2013Open Letter to London Mayor Boris Johnson - Weather is not Climate
"The PM is chosen by the Queen" In theory, but not in practice. This provides a good explanation. -
rockytom at 07:28 AM on 23 January 2013New textbook on climate science and climate denial
I would like to thank all the readers to this point who have commented on the above textbook. I will contact Springer about releasing a soft-cover version at a reduced price in the near future. I am a firm believer in the "Henry Ford approach." Having worked closely with John on the above textbook, I agree that there must be more than one "John Cook" related to this site. His posts and other works are first rate and he even has time to work toward his Ph.D. GTF
Prev 980 981 982 983 984 985 986 987 988 989 990 991 992 993 994 995 Next


