


 Arguments


Recent Comments
Prev 983 984 985 986 987 988 989 990 991 992 993 994 995 996 997 998 Next
Comments 49501 to 49550:
-
sauerj at 00:02 AM on 20 January 2013Skeptical Science and social media - Ask not what SkS can do for you, but what you can do for SkS
I've put key graphs on my FB "Cover". I think this is a good way to advertise to friends key persuasive information. When they mouse over your profile picture, they will see this cover picture pop up. I've had one image in place now for several months; it would be better if I rotated through different pictures so to keep interest up. But, one issue is that to effectively show the whole picture requires cropping and re-sizing the image to 712(W)x260(H) pixels. This is a very wide & squatty image. This doesn't work for most of the graphs and yet still show a proportionally sized image. Not asking for a lot of work to issue 2nd set of images, but just laying this out as something to think about when generating these images. -
Soilfertility at 21:01 PM on 19 January 2013CO2 is plant food
Hi Doug: I said that I have come to the conclusion that blaming consequences of declining soil fertility on global warming is a scientific mistake. I did not say that any scientist has ever written a scientific paper blaming the consequences of declining soil fertility on global warming. I am not aware of any global warming research scientist who has knowledge of the consequences of declining soil fertility that would allow his or her writing of such an paper. What lead to my coming to that conclusion was, as I suggested at the end of my post answering the question I posed, was my reading of papers left by the late soil scientist, William A. Albrecht, Ph.D. In his papers, Albrecht explains many consequences of declining soil fertility. Albrecht did not address global warming as he was dead before global warming became an issue. Around the middle of the last century, Albrecht explained how declining soil fertility was increasing the severity of weather hazards such as floods and droughts. He also explained that the soil fertility controls the erosion of the soil itself with lower soil fertility being the primary cause, not the wind or rain. With respect to CO2, the subject of the article above, he explains how the carbon dioxide dissolving in the rain creates a weak carbonic acid that is beneficial in increasing soil fertility by breaking positive ions necessary for life (such as calcium, magnesium and potassium) out of rocks that contain these elements when such rocks are still in the soil. This certainly suggests how to restore or increase soil fertility when parent rocks containing these minerals have been exhausted from the soil and soil fertility is necessarily declining. If you wish to read an article I wrote I titled "Albrecht on Droughts and Soil Fertility" you can read it here: http://thebovine.wordpress.com/2012/08/11/droughts-and-soil-fertility/ Hopefully it might inspire you to wade through Albrecht's papers which I think will serve you better than wading through a post of mine. -
skywatcher at 20:39 PM on 19 January 20132012 Shatters the US Temperature Record. Fox, Watts, and Spencer Respond by Denying Reality
Well worth noting the utter lack of support for Backslider's claims, especially the allegations of impropriety made in the second paragraph of #42. In science, Backslider, we require evidence. You don't appear to have anything but your incredulity. A more measured take on Australia's heatwave comes from this informative article in The Conversation, written by the BoM, and published the morning before Sydney broke it's all-time high temperature record. Particular attention might be drawn to the ratio of high to low temperature records, and the ratio of night-time to daytime temperature records, consistent with the expected effect of an enhanced greenhouse effect. Others can probably highlight the links to studies showing how rural stations also show warming and are an integrl part of temperature monitoring. I'd like to draw attention to measures that cannot be attributed to UHI - the near-universal retreat of mountain glaciers, the melt in Arctic sea ice, the temperature of the lower troposphere, and the shifting poleward of species. The tough truth is, when conditions are right, heat records are much, much more likely to fall than cold records in our warming world. -
Doug Hutcheson at 16:51 PM on 19 January 2013Skeptical Science and social media - Ask not what SkS can do for you, but what you can do for SkS
Excellent, John. Puts things handy for quick reference. -
John Cook at 16:48 PM on 19 January 2013Skeptical Science and social media - Ask not what SkS can do for you, but what you can do for SkS
Note: I've just added icons in the SkS left margin linking to our YouTube channel and Pinterest page. -
Albatross at 16:05 PM on 19 January 20132012 Shatters the US Temperature Record. Fox, Watts, and Spencer Respond by Denying Reality
Regarding the outrageous (and unsupported claim) made by poster "backslider" about Stevenson screens. The fact of the matter is that, if anything, Stevenson screens have a slight cool bias when compared against the reference instruments. From a World Meteorological Organization report. (conducted in Australia as it happens): "It has been recognised since the early part of the century (Koppen 1913) that the Stevenson screen impacts significantly on the temperature measured. Its large thermal mass results in a large thermal lag and as a consequence underestimates the maximum and minimum temperature. Despite this it remains a useful screen." Other field tests have made similar findings, see here for example. Stevenson screens are not the problem here, it is some people's ignorance and denial about global warming that is the real problem. -
Tom Curtis at 15:55 PM on 19 January 20132012 Shatters the US Temperature Record. Fox, Watts, and Spencer Respond by Denying Reality
Backslider @41:"We have records since the first fleet in fact, kept by reputable scientists using well calibrated equipment and a far more sane method of measuring which is totally at odds with a Stevenson hot box."
My, the joys of being a Sydney-sider and imagining that Sydney is all of Australia. Anyway, more importantly, name these "reputable scientists" and their scientific qualifications. You will in fact find that they are, in the early period, army or navy officers with a pro-forma interest in accurate temperature records using instruments of far inferior quality to those today."Try sitting in your car in forty degree heat with the windows down - that's what a Stevenson box is like."
Do you even know what a Stevenson Screen is? They are double louvred on all sides so that there is no impediment to passing breezes, and no possibility of accumulating heat through restricted convection. The proper comparison is sitting under an extensive wooden roof guaranteeing full shade but not restricting any air flow. I tire of you now. You have done nothing but regurgitate talking points from Jonova without any apparent understanding of what you are talking about. What is more, you are demonstratably making up claims to bolster your case with no knowledge of the relevant facts ("respected scientists", "explorers ... were scientists"). You are adding nothing useful this conversation except for those with a taste for the absurd. -
Tom Curtis at 15:42 PM on 19 January 20132012 Shatters the US Temperature Record. Fox, Watts, and Spencer Respond by Denying Reality
Backslider @37: 1) You may not be able to get your head out of Sydney, but the rest of Australia can. We (those Australian's outside of Sydney) are talking about a heat wave not because of two very hot days in Sydney, but because of 46 individual maximum temperature records in Australia so far in 2013; and because of repeated Australian mean maximum temperatures at or near record levels. 2) The early explorers were not scientists, but ex-Navy or Army officers like Charles Sturt and Burke with the occasional surveyor like Wills. (And for non-Australian's, please read up on the Burke and Wills expedition to see just how absurd is this suggestion that because records were taken by explorers, they were taken with unusual competence.) Charles Sturt was, of course, very competent, but the suggestion that measurements made on thermometers packed and carried very day, then set up in an ad hoc fashion in tents or in the partial shade provided by eucalypt trees, and at an unknown distance from the ground should be more accurate than that provided by Stevenson Screened instruments is absurd. 3) I do not have to make a comparison between Stevenson Screened instruments and others. It has already been done:"In view of the implications for the assessment of climatic changes since the mid-nineteenth century, systematic changes of exposure of thermometers at land stations are reviewed. Particular emphasis is laid on changes of exposure during the late nineteenth and early twentieth century when shelters often differed considerably from the Stevenson screens, and variants thereof, which have been prevalent during the past few decades. It is concluded that little overall bias in land surface air temperature has accumulated since the late nineteenth century: however, the earliest extratropical data may have been biased typically 0.2°C warm in summer and by day, and similarly cold in winter and by night, relative to modern observations. Furthermore, there is likely to have been a warm bias in the tropics in the early twentieth century: this bias, implied by comparisons between Stevenson screens and the tropical sheds then in use, is confirmed by comparisons between coastal land surface air temperatures and nearby marine surface temperatures, and was probably of the order of 0.2°C."
See also here for comparisons between modern methods. I also know, as you obviously do not, that temperatures taken in the shade in poorly ventilated locations locations, or unusually close to the ground can exceed temperatures recorded in Stevenson Screens by up to ten or 15 degrees. That is why it is now law in Australia that you are not permitted to leave unattended children in parked cars. Poor house design in outback and subtropical Australia can easily result in internal temperatures several degrees above that found in neigbouring Stevenson Screened instruments, as indeed can internal temperatures in tents, particularly tents lacking a fly. @38, living in Mount Isa, I know from personal experience that the numbers of birds described as dying are way in excess of the carrying capacity of the land they are described as dying in. I also know that hyperbole is a favoured technique in Australian story telling. You do the maths. So many birds they snapped the branches of the trees, according to one account. Which makes a good yarn, and a better one when some (--snipped--) can't recognize when a yarn is being spun.Moderator Response: (Rob P) Inflammatory snipped. -
Backslider at 15:38 PM on 19 January 20132012 Shatters the US Temperature Record. Fox, Watts, and Spencer Respond by Denying Reality
And yes JasonB, the equipment., even from the 1700's has been acknowledged as very accurate by very real modern day scientists..... -
Backslider at 15:30 PM on 19 January 20132012 Shatters the US Temperature Record. Fox, Watts, and Spencer Respond by Denying Reality
@Jason - Let me be clear. In my very logical opinion, a Stevenson box is the most unscientific contraption ever invented. I don't actually accept any of their readings as being close to accurate. The biggest flaw with modern climatology is all the unscientific generalisation and adjustments being made, which ultimately are based only upon opinion. "Oh yes, I think we should deduct a degree or two here and perhaps add a couple over there". That, in truth, is what we have. A far better measure is to collate records only from areas that have not subsequently become urbanised. Then we would have a far clearer picture of the true situation. Then we would havesomething that I could regard as perhaps a little closer to scientific (except for Stevenson screens). Alas, we do not have that. -
Backslider at 15:24 PM on 19 January 20132012 Shatters the US Temperature Record. Fox, Watts, and Spencer Respond by Denying Reality
@JasonB - Exactly where have I said that old temperature records are suspect? Or do you think that your "scientific" generalisation fits just because you want it to? Old records show global warming do they?.... I don't think so. They show a far hotter Australia way back in the 1700's -
Backslider at 15:22 PM on 19 January 20132012 Shatters the US Temperature Record. Fox, Watts, and Spencer Respond by Denying Reality
"the first time that has happened since record keeping began in 1910" Since record keeping accepted by you began you mean. We have records since the first fleet in fact, kept by reputable scientists using well calibrated equipment and a far more sane method of measuring which is totally at odds with a Stevenson hot box. Try sitting in your car in forty degree heat with the windows down - that's what a Stevenson box is like. -
Doug Hutcheson at 15:20 PM on 19 January 2013CO2 is plant food
Soilfertility @ 7, After wading through your post, I find you saidblaming consequences of declining soil fertility on global warming is a scientific mistake
Excuse my ignorance, but exactly which scientific papers are you referring to? I cannot recall ever hearing a scientist blame 'consequences of declining soil fertility on global warming'. It sounds suspiciously like a strawman argument to me. -
JasonB at 15:14 PM on 19 January 20132012 Shatters the US Temperature Record. Fox, Watts, and Spencer Respond by Denying Reality
It's funny how old temperature records are considered suspect when they show warming, but are made by "scientists, using calibrated equipment which has been acknowledged as accurate" when they show high temperatures in the past. Anyway, my favourite is Darwin and the change that happened during WWII. :-) -
Albatross at 15:05 PM on 19 January 20132012 Shatters the US Temperature Record. Fox, Watts, and Spencer Respond by Denying Reality
What has made this recent heat wave in Australia unusual is its scope in terms of the area affected and the duration, respectively. The latter was unprecedented in the record. From Dr. Masters' blog: "The nation's [Australia's] average high temperature exceeded 102°F (39°C) for seven consecutive days January 2 - 8, 2013--the first time that has happened since record keeping began in 1910. To put this remarkable streak in perspective, the previous record of four consecutive days with a national average high temperature in excess of 102°F (39°C) has occurred once only (1973), and only two other years have had three such days in a row--1972 and 2002." [Source] Expect much more, and worse, in the future folks. -
Soilfertility at 14:43 PM on 19 January 2013CO2 is plant food
It seems a shame that apparently no one informed on global warming is also informed about declining soil fertility. As a result, consequences of declining soil fertility are incorrectly said to be caused by global warming. This article on CO2 is a good example. Depending on their protein requirement to be healthy, plants require a certain level of soil fertility. This soil fertility is based on the minerals necessary to support life. In low soil fertility the plants are primarily carbonaceous or high in carbohydrates with low protein content. As such, they are of little use to support animal life in health. As soil fertility is increased, the protein content of the plants is increased as a percentage of the dry matter and the carbohydrate content is decreased. This allows a greater density of animal life per acre. Plants being damaged by insects indicate malnourished plants that are growing in soil that cannot meet their protein requirements. Increase the soil fertility and you won't need to worry about insect damage. Adding NPK only to soil to increase fertility only creates an unbalanced soil that causes the grower to go back to the same guy who sold the grower the NPK for the poisons to treat the symptoms of the low soil fertility, i.e. the insects doing the damage, the weeds out competing the crop and the diseases the plants are getting. When it rains in conditions of high soil fertility, the top soil acts as a blanket allowing the rain to soil into the soil and thereby to gradually go down into the subsoil raising the water table. In conditions of low soil fertility the shallow surface top soil not only absorbs little water from a rainfall, it actually often seals the surface so that very little water penetrates during a rainfall and this runoff often causes erosion of the soil itself. Downstream the drainage from a large land area can often result in floods. Later in the year the complaint is about a lack of rainfall and high temperatures and the increasing severity of droughts. In droughts it is usual for the high heat to damage the protein of the plants more than the lack of water. If the plants are damaged but are not wilting, the problem is the heat, not a lack of water, i.e. corn firing in a drought. Wind or rain are necessary but not sufficient for soil erosion. The "dust bowl" is an example of a result of declining soil fertility. Where can someone learn about the consequences of declining soil fertility and perhaps, as I have, come to the conclusion that blaming consequences of declining soil fertility on global warming is a scientific mistake and we should direct our primary climatic ecological concern to the former, not the latter? "The Albrecht Papers" by the soil scientist, William A. Albrecht, Ph.D. -
Backslider at 14:24 PM on 19 January 20132012 Shatters the US Temperature Record. Fox, Watts, and Spencer Respond by Denying Reality
@Tom - you might just sit down and take the time to actually look at the temperature records, rather than (-snip-). For example, Sydney has had two hot days this month and everybody is screaming "heat wave due to climate change". Tommy rot. (-snip-)? (-snip-). The explorers who took those measurements (and made those reports) were scientists, using calibrated equipment which has been acknowledged as accurate - (-snip-). You may be certain that their shade was a great deal cooler than the little hot box known as a Stevenson screen. I challenge you: Try it - put the two together and see just how much hotter the Stevenson readings are. (-snip-)Moderator Response: [DB] Inflammatory and sloganeering snipped. Please stick to the science with less rhetoric. And please familiarize yourself with this site's Comments Policy. Complaints about moderation are summarily deleted. Also, if you cannot maintain a civil tone in this discussion than further moderation will ensue. -
Tom Curtis at 14:10 PM on 19 January 20132012 Shatters the US Temperature Record. Fox, Watts, and Spencer Respond by Denying Reality
Backslider @33 & @34: 1) I grew up in the outback (Mount Isa) so I know when accounts have been grossly exaggerated. The accounts of bird deaths are clearly so. Curiously, the accounts of bird deaths seem to include no deaths from heat alone. So, I'm not inclined to take sensationalized anecdote (they are after all reported in newspapers) over official records. 2) "In the shade" is a very variable quantity. Is it in the shade under a Morton Bay Fig, or under a Ghost Gum? The former provides full shade, while the later does not. Or perhaps it was "in the shade" in a tent house, in which case the maximum day time temperature recorded would have been well above that recorded in a Stevenson Screen. The point here is not that it has never been hotter in Australia. It may well have been, but without reliable records we cannot know. What we do know is that the first eight days of 2013 were all rated in the hottest 20 days since 1910, and that one of them was the hottest on record. We also know that that was not because of a lack of sea breazes or potential urban heat island effect in Sydney. You may be desperate to scrabble for any reason not to consider any implications of the recent heat wave. I prefer a more measured view. -
DSL at 14:08 PM on 19 January 20132012 Shatters the US Temperature Record. Fox, Watts, and Spencer Respond by Denying Reality
Actually, backslider, Tom is pretty good with the critical thinking. You may want to check out this post. The SST animation suggests pretty strongly that the heat was hardly local. Your responses need to step it up a notch. Bring the data. The rhetoric is empty. -
Backslider at 13:33 PM on 19 January 20132012 Shatters the US Temperature Record. Fox, Watts, and Spencer Respond by Denying Reality
I might also remind you Tom that climate events do not constitute climate change. You will find this to be the prevalent view among scientists. While some may indeed be new records, these will always be arguable and uncertain for a number of very good reasons, the primary reason being that many previous measurements, while at the same time describing horrific events such as animals dying, birds and bats falling out of the sky and many people perishing, were measured in the shade, not a little hot box sitting out in the sun as we now have with Stevenson screens. -
Backslider at 13:02 PM on 19 January 20132012 Shatters the US Temperature Record. Fox, Watts, and Spencer Respond by Denying Reality
Well gee Tom, you present yourself as such a thinker. Let me remind you that when the real records were set, when birds and bats were falling out of the sky in their millions, we did not have the urban sprawl of Sydney's Western Suburbs... which is the prime source of extra heat on its way to Observatory Hill..... as explained by a qualified Meteorologist in Sydney itself. You can deny experts all you like, it does not prove anything.Moderator Response: (Rob P) All Caps (now removed) are a contravention of the comments policy. No more thanks. -
Tom Curtis at 12:38 PM on 19 January 20132012 Shatters the US Temperature Record. Fox, Watts, and Spencer Respond by Denying Reality
Backslider @31, so your explanation of the new maximum temperature record at Dunedoo is the failure of sea breezes, and the temperature increase from the wind blowing across all those roads its 836 inhabitants have built? Presumably that is also the explanation for the new maximum temperature at Curtin Springs. And so on for all of the more than 34 new maximum temperature records set in Australian since January 1st. (More than 34 because M Hrerrera has not caught up with the new record at Observatory Hill on Friday). Perhaps you might want to consider that local geography cannot explain a national heat wave. Or that previous records set at Observatory Hill were also set when hot westerlies prevented the onset of sea breezes. Perhaps you might even want to consider that your desperaton to throw out the data shows clearly that the data refutes your (--snip--) views.Moderator Response: (Rob P) Inflammatory snipped. -
Andy Skuce at 12:30 PM on 19 January 2013Skeptical Science and social media - Ask not what SkS can do for you, but what you can do for SkS
A number of us are already on G+ but we are not really organized there yet. John, I agree with you about Twitter. It's much more useful than I thought it would be and it's the best climate news feed I have got. I'm relatively new there and am slowly learning my way around. Your advice seems sound. -
Backslider at 12:10 PM on 19 January 20132012 Shatters the US Temperature Record. Fox, Watts, and Spencer Respond by Denying Reality
These so called "records" are pretty much meaningless, as are most temperature measurements. This was best put by a meteorologist with the Australian Bureau of Meteorolgy when commenting on Fiday's hot day in Sydney (which also broke supposed records): “Without a sea breeze it meant we had westerly winds billowing across the city, gathering heat off the roads and concrete buildings” Read more: http://www.smh.com.au/data-point/lack-of-sea-breeze-leaves-sydneysiders-to-bake-20130118-2cyre.html#ixzz2INO801Zd Nice to see a reasonable explanation for a change rather than all the (--snip--). Thus, whether its the highest recorded temperature or not, the fact that the heat is significantly increased by development puts paid to any argument that its particularly hotter than ever before.Moderator Response: (Rob P) Inflammatory snipped. Please note that record-breaking heat has increased, and will continue to increase, in frequency and severity, as the Earth warms further. This should be transparently obvious. Clearly other non-climate related factors (such as weather fluctuations) play a part in record-breaking temperatures too. -
Doug Hutcheson at 11:51 AM on 19 January 201316 ^ more years of global warming
Rob, I have noticed a trend where comments linking to SkS posts trigger the denier zombie hordes to reply with comments like "Skeptical Science is a religious activist site, run by spin merchants", or variations of that. To counter this, I have now taken to finishing my comments linking to SkS with this:Skeptical Science http://www.skepticalscience.com is an award-winning web site where scientific research is discussed in a civil manner and questions from ordinary yobs like me are answered intelligently. It is well worth a visit, if you are genuinely interested in the science behind AGW theory. (Cue the outraged bluster from contrarians, who will claim that a science-backed venue like Skeptical Science must really be an 'AGW religious site'. Sigh!)
So far, this tactic has worked to prevent such follow-up zombie comments, but I wonder for how long? -
Tom Curtis at 11:31 AM on 19 January 2013Water vapor is the most powerful greenhouse gas
AlanSE @137: 1) Greenhouse effect: The explanation of the greenhouse effect at sierrapotomac.org is of poor quality, and will only confuse you if you are trying to understand it correctly. In particular, it describes the greenhouse effect as causing a greater absorption of heat. In fact, an increase in atmospheric CO2 would result in a greater increase in heat only while the Earth was not a radiative equilibrium. Once the Earth reached radiative equilibrium, there would be no further net gain in heat, but the greenhouse effect would still be enhanced relative to the condition with less CO2. It also says,"The heating of the earth due to the radiant heat of the sun is called the greenhouse effect", which is egregiously wrong. The radiant energy received from the Sun at the Earth's current albedo is 239 W/m^2. In the absence of a Greenhouse effect, the temperature of the Earth's surface would rise till it emitted 239 W/m^2, ie, approximately 255 degrees Kelvin (-18 C). A low IR emissivity would raise the temperature slightly; while a less than even temperature distribution across the surface would lower it. In practice, the second is the stronger effect so that the mean global surface temperature would be less than 255 K. As it happens, the Earth's global mean surface temperature is approximately 288 K (15 C). The higher temperature results in a much higher outward IR flux at the surface than the energy received from the Sun, and indeed, much higher than the outward flux at the top of the atmosphere. The difference between the outward flux at the surface and that at the top of the atmosphere is the atmospheric greenhouse effect. Trenberth et al (2010) give that difference as 156 W/m^2 (see diagram below), while Schmidt et al (2010) gives it as 155 W/m^2. It is very important that the IR radiation at the TOA is less than that at the surface only because greenhouse gases absorb outgoing IR radiation; and because those gases are cooler than the surface, so that when they emit IR radiation it has a reduced flux. It is also important to recognize that the TOA flux can only be smaller because energy absorbed by the atmosphere is also transferred to the surface. Without the energy transfer to the surface both the reduced flux at TOA, and the flux at the surface greater than solar radiation absorbed would violate conservation of energy. As it happens, the energy equations do balance (see diagram above). The energy transfer from atmosphere to surface is in the form of back radiation, but could be in another form and you would still have a greenhouse effect.
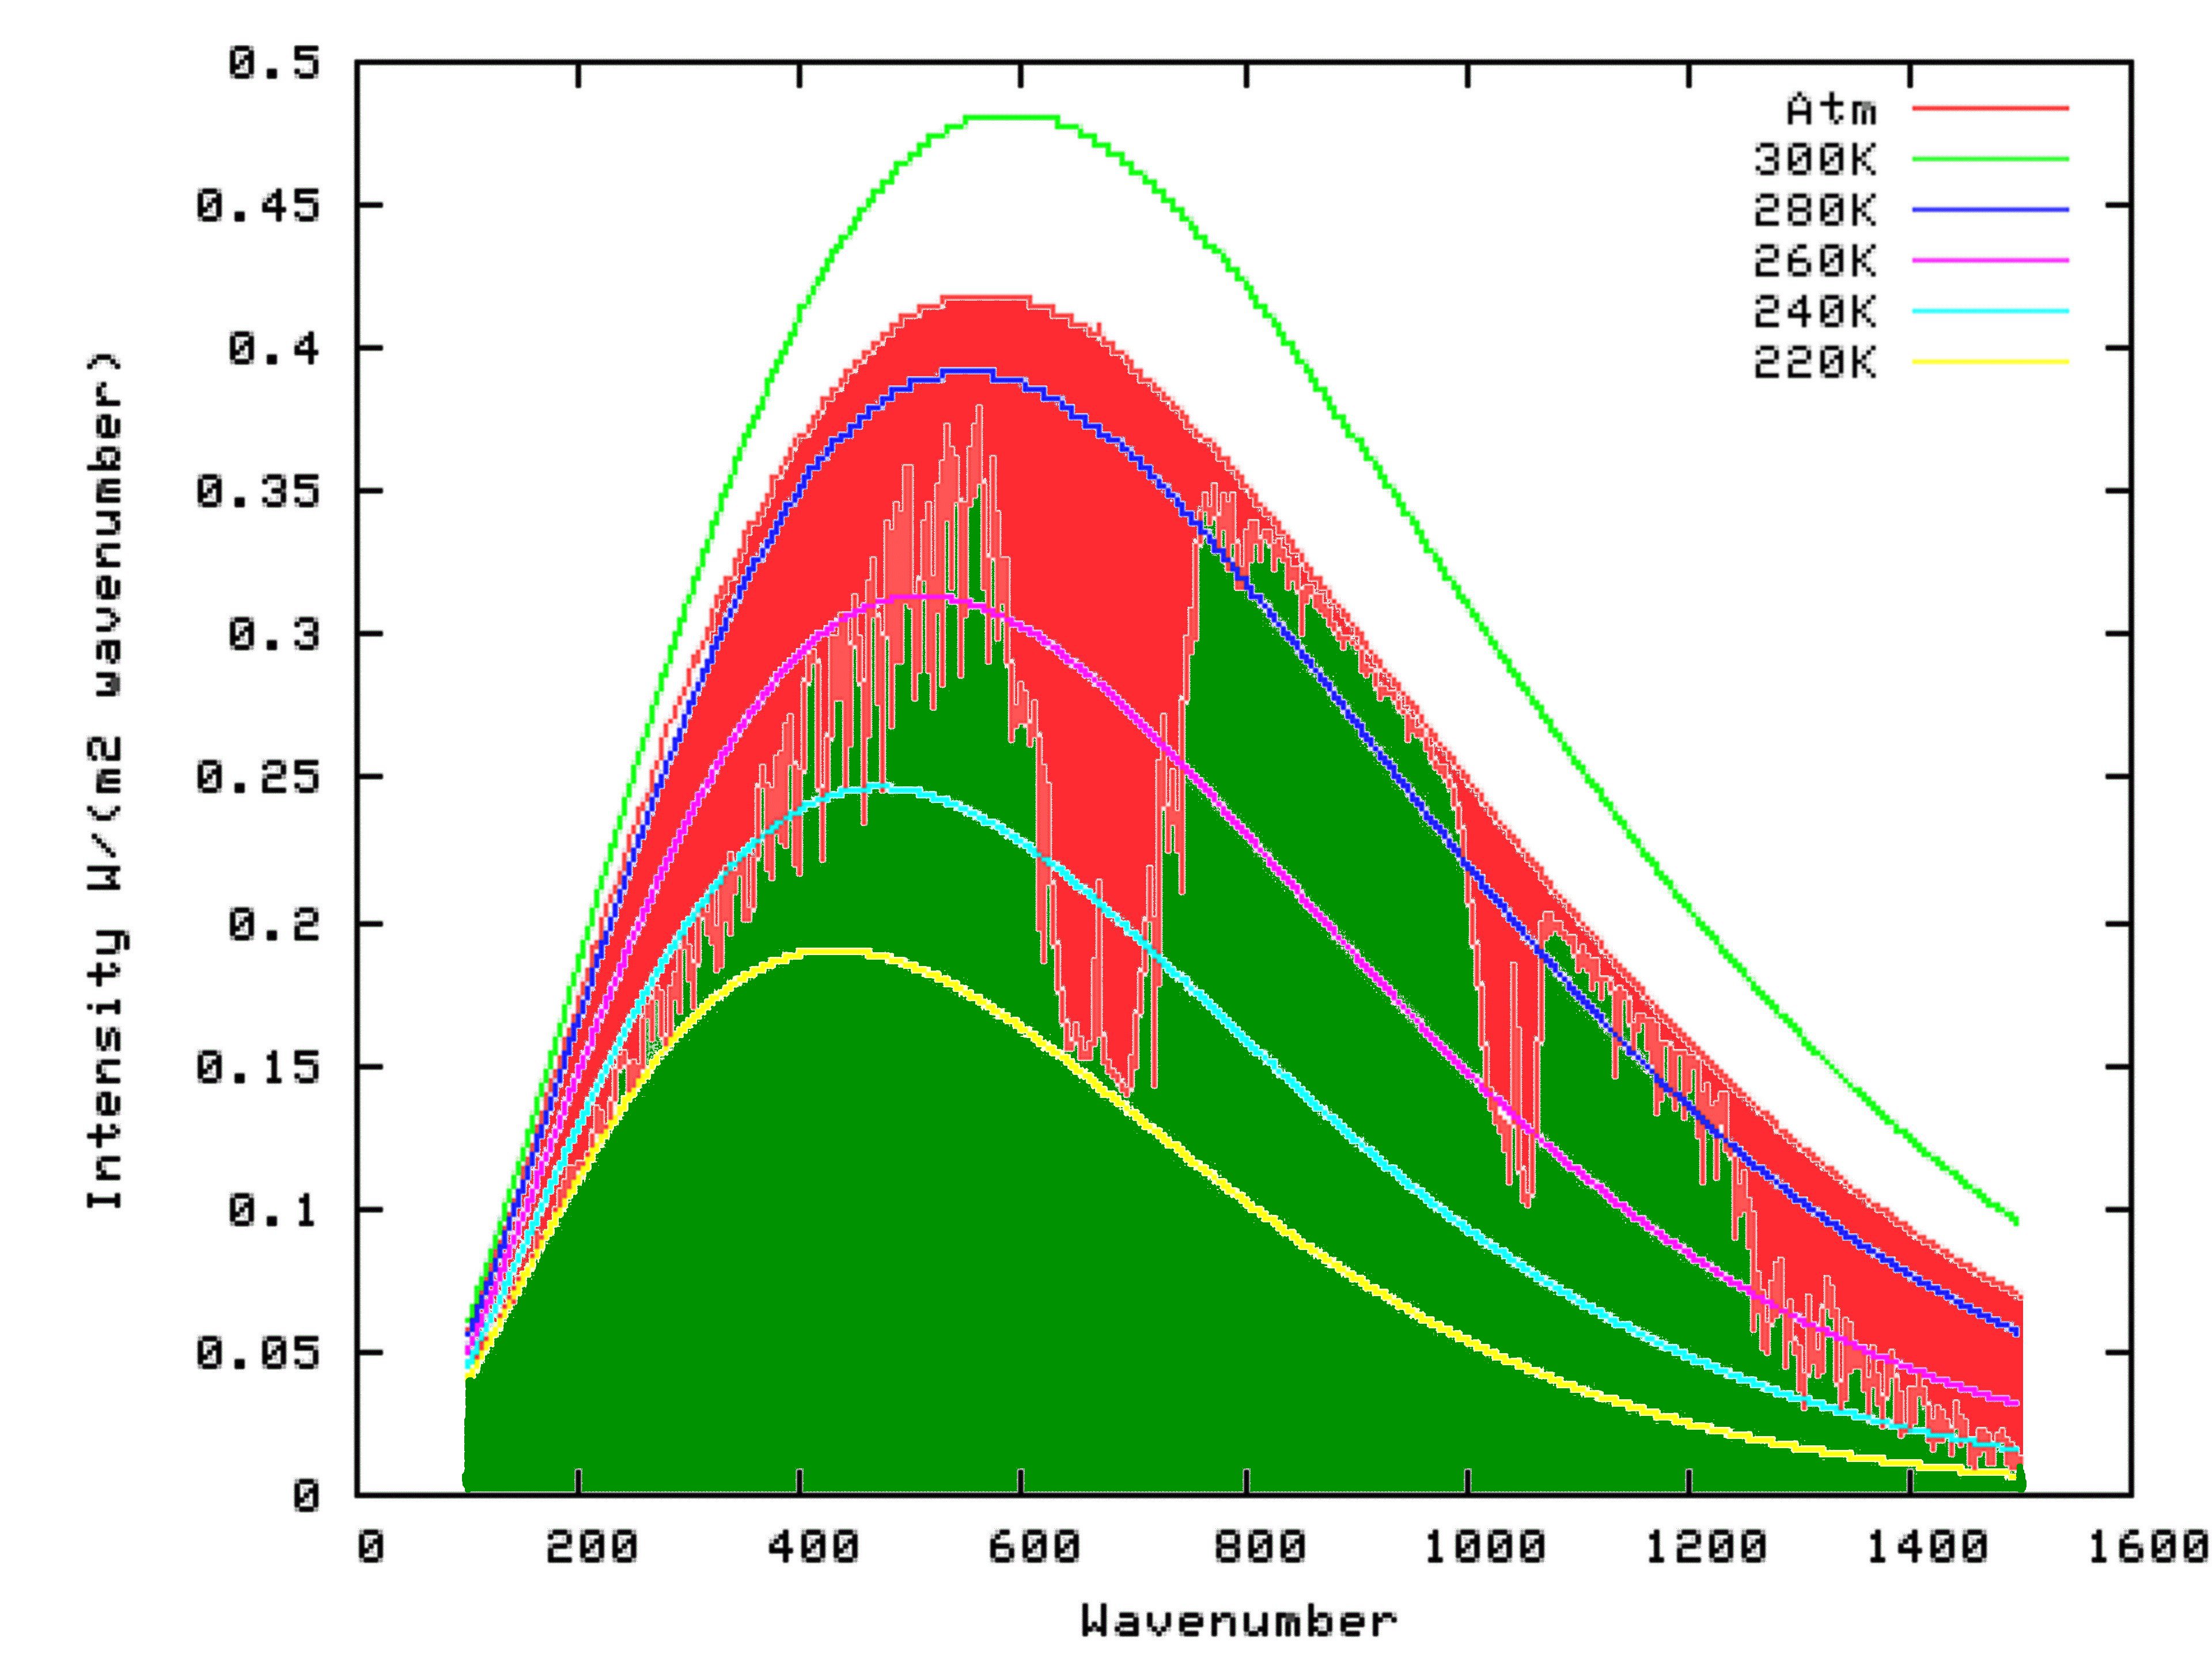
2) Atmospheric Window: You appear to be confused by the "atmospheric window". "Atmospheric windows" are frequencies within the electromagnetic spectrum in which there is almost no atmospheric absorption, so that radiation in the window can go directly from the surface to space (or vise versa). As can be seen in the modtran image below, there is an IR atmospheric window between wavenumbers 800 cm^-1 and 1000 cm^-1, and another smaller window around 1100 cm^-1. As it happens, about 40 W/m^2 escapes from the surface to space through these "atmospheric windows", but they should not be confused with the total radiation to space (236 W/m^2, most of which comes from the atmosphere) or with the atmospheric greenhouse effect.
It is very important that the IR radiation at the TOA is less than that at the surface only because greenhouse gases absorb outgoing IR radiation; and because those gases are cooler than the surface, so that when they emit IR radiation it has a reduced flux. It is also important to recognize that the TOA flux can only be smaller because energy absorbed by the atmosphere is also transferred to the surface. Without the energy transfer to the surface both the reduced flux at TOA, and the flux at the surface greater than solar radiation absorbed would violate conservation of energy. As it happens, the energy equations do balance (see diagram above). The energy transfer from atmosphere to surface is in the form of back radiation, but could be in another form and you would still have a greenhouse effect.
2) Atmospheric Window: You appear to be confused by the "atmospheric window". "Atmospheric windows" are frequencies within the electromagnetic spectrum in which there is almost no atmospheric absorption, so that radiation in the window can go directly from the surface to space (or vise versa). As can be seen in the modtran image below, there is an IR atmospheric window between wavenumbers 800 cm^-1 and 1000 cm^-1, and another smaller window around 1100 cm^-1. As it happens, about 40 W/m^2 escapes from the surface to space through these "atmospheric windows", but they should not be confused with the total radiation to space (236 W/m^2, most of which comes from the atmosphere) or with the atmospheric greenhouse effect.
 As noted in section one, the atmospheric greenhouse effect is the difference between the upward IR radiation from the surface and the upward IR radiation to space from the Top of the Atmosphere. Doubling CO2 concentration creates a radiative forcing of 3.7 W/m^2, ie, it reduces the IR radiation to space by 3.7 W/m^2. The reduced upward flux at the TOA creates an energy imbalance which warms the Earth until the imbalance ceases to exist. Ignoring all feed backs, that requires a warming of approx 1.1 C at the surface to accomplish; or in other words an increase in the upwards IR flux at the surface by about 6 W/m^2. Because equilibrium is reached (ignoring feedbacks), the upward IR flux at the TOA will have returned to 239 W/m^2, so a radiative forcing of 3.7 W/m^2 will have caused a total change in the net atmospheric greenhouse effect of 6 W/m^2. In practice, the net change will be approximately two to three times that amount, with much of the increase attributable to the water vapour feed back.
This may seem confusing, but only if you mistake radiative forcing, ie, the net change in TOA radiative flux before temperature adjustments with the net atmospheric greenhouse effect, ie, the difference between surface and TOA upward IR flux. Unfortunately, that is a mistake I made in my previous post @134. I apologize for any confusion I have caused as a result.
3) Increased CO2: Increasing CO2 in the atmosphere widens the large valley in outgoing radiation between 600 and 700 cm^-1 (see modtran graph above). To maintain equilibrium, the total area of the graph, which represents the total upward flux, must remain constant. Because the area is reduced near 600 and 700 cm^-1, it must be increased elsewhere, including in the atmospheric windows. As the upward flux in the atmospheric windows comes from the surface, this means the surface temperature must increase. Consequently your assumption that most of the warming would occur in the atmosphere (ignoring feed backs) is mistaken.
As noted in section one, the atmospheric greenhouse effect is the difference between the upward IR radiation from the surface and the upward IR radiation to space from the Top of the Atmosphere. Doubling CO2 concentration creates a radiative forcing of 3.7 W/m^2, ie, it reduces the IR radiation to space by 3.7 W/m^2. The reduced upward flux at the TOA creates an energy imbalance which warms the Earth until the imbalance ceases to exist. Ignoring all feed backs, that requires a warming of approx 1.1 C at the surface to accomplish; or in other words an increase in the upwards IR flux at the surface by about 6 W/m^2. Because equilibrium is reached (ignoring feedbacks), the upward IR flux at the TOA will have returned to 239 W/m^2, so a radiative forcing of 3.7 W/m^2 will have caused a total change in the net atmospheric greenhouse effect of 6 W/m^2. In practice, the net change will be approximately two to three times that amount, with much of the increase attributable to the water vapour feed back.
This may seem confusing, but only if you mistake radiative forcing, ie, the net change in TOA radiative flux before temperature adjustments with the net atmospheric greenhouse effect, ie, the difference between surface and TOA upward IR flux. Unfortunately, that is a mistake I made in my previous post @134. I apologize for any confusion I have caused as a result.
3) Increased CO2: Increasing CO2 in the atmosphere widens the large valley in outgoing radiation between 600 and 700 cm^-1 (see modtran graph above). To maintain equilibrium, the total area of the graph, which represents the total upward flux, must remain constant. Because the area is reduced near 600 and 700 cm^-1, it must be increased elsewhere, including in the atmospheric windows. As the upward flux in the atmospheric windows comes from the surface, this means the surface temperature must increase. Consequently your assumption that most of the warming would occur in the atmosphere (ignoring feed backs) is mistaken.
-
ChrisJJ at 10:16 AM on 19 January 2013Skeptical Science and social media - Ask not what SkS can do for you, but what you can do for SkS
Yes, I agree with pbjamm. I realise you can't do everything at once, but Google+ is quite large now, 500 million users to Facebook's 1000 million. G+ is still growing fast, FB is showing signs of struggling. At the very least set up an account before someone else takes the name. Do that now, today, right away. Come back and develop it later but secure the name now. -
John Russell at 09:32 AM on 19 January 2013Skeptical Science and social media - Ask not what SkS can do for you, but what you can do for SkS
I was very sceptical of Twitter for several years, believing it was just used for inane chat. Then I spoke to someone who explained their use of it. I was intrigued; and not too long ago I signed up. I then discovered that in fact Twitter is whatever you want it to be. My approach is to focus, choose a range of complementary subjects to tweet about and don't be tempted to stray into areas where one group of your followers will be put off by what another group is discussing. As an extreme example; don't tweet about climate change and about your love of drag racing; or your belief in creationism and your support for abortion. You get the drift. Next; only follow people that discuss things you are really interested in and who are consistent (see para above). Following other people just because they've followed you is tempting but ultimately just clogs your in-box. Last; keep the standard of your tweets as high as you can. By which I mean original, interesting, informative and occasionally funny. You'll be rewarded with a good band of followers: quality not quantity. Hey, I've just 193 as I write, but they include 24 scientists; 31 journalists; 15 climate scientists; oh, and 3 people who are, let's say 'in denial' (one can't have everything). So jump on in if you've not tried already. The main benefit is that if something happens that's important to your interest areas, you'll hear about it within minutes of the news breaking. Who knows, you might be instrumental in making the news. If you have an original thought or stumble across some interesting info and tweet it (like I just did about this SkS post!), there's a lot of pleasure in seeing a top journalist or climate scientist re-tweeting it within seconds. So please follow me @JohnRussell40 -
JoeT at 08:49 AM on 19 January 2013Ridley, Murdoch, and Lomborg Attempt to Greenwash Global Warming
As a follow-up to my post above, I did a cursory search for papers by Myneni to see if he ever wrote anything suggesting that carbon fertilization is responsible for the greening of the planet as suggested by the Ridley article. I was unsuccessful in finding anything by Myneni, but I did find the following in a paper in which Nemani is a co-author regarding the western Amazon basin: "CO2 fertilization effects were evenly distributed over the course of an entire year, but NDVI did not show such an overall increase. Our results do not exclude the possibility that potential gains in productivity resulting from CO2 fertilization effects were not likely distributed to leaf production; however, we suggest that changes in climate rather than CO2 fertilization effects could explain the increasing trend in NDVI. Specifically, a positive trend in shortwave radiation and negative trend in cloud cover most strongly explain the corresponding increase in NDVI, as our simulations showed that these factors drove a simulated increase in NPP for the same months (from August to December) in which the increases in NDVI have been observed." -
pbjamm at 08:28 AM on 19 January 2013Skeptical Science and social media - Ask not what SkS can do for you, but what you can do for SkS
Don't forget G+! -
smerby at 07:42 AM on 19 January 2013Resolving Confusion Over the Met Office Statement and Continued Global Warming
Thanks for the insight, Smerby -
John Hartz at 07:28 AM on 19 January 2013Ridley, Murdoch, and Lomborg Attempt to Greenwash Global Warming
Ruppert Murdoch’s transformation from a climate hawk to a climate skeptic Is nicely covered in: Has Rupert Murdoch turned into a climate change sceptic? by Ian Burrell, the Independent, Jan 11, 2013 Like Dana’s excellent OP, this article was precipitated by Murdoch’s recent tweet about Ridley’s op-ed. -
AlanSE at 05:50 AM on 19 January 2013Water vapor is the most powerful greenhouse gas
Thanks for your replies @KR, @Tom Curtis, @Bob Loblaw. I'm much further in my understanding. Here is my understanding: all the number we've talked about are TOA values. The graph I linked to (albeit outdated) gives the change in TOA from pre-industrial to future concentrations. This would be the change in the heat flux through the atmospheric window. We'll say that number is 7 W/m^2 for a change to 1000 ppm. Then the currently discussed 32 W/m^2 is the figure for radiative forcing from all CO2. Actually, it's a little more complicated since the absorption overlaps with other gases, and without the cross-correlation the paper gives 29 W/m^2. My understanding is that if you removed CO2 from the atmosphere entirely you would increase the flow through the infrared window by the 29 number. This now makes sense to me because the differential power of adding CO2 is much much greater at lower concentrations. The entire infrared window seems to be 40 W/m^2. So if industrial emissions decreases this by 7 W/m^2, we're left with 32 W/m^2. Now I have to revise my picture of the change in temperature to compensate. I previously considered an increase in surface temperature as compensating for the additional radiative forcing. Now it seems that most of this would come from a higher temperature of the atmosphere. If you look at this reference: http://www.sierrapotomac.org/W_Needham/TheGreenhouseEffect.htm You can see that longwave radiation from the atmosphere into space is 235 W/m^2, whereas the longwave directly from the surface is only that paltry 40. So as we increase CO2 the former number will increase much more. I'm still holding the assumption that the surface and atmosphere will increase in temperature by similar amounts from AGW. It's just that the additional radiation that compensate for it will mostly come from the atmosphere. Is there anything wrong with this picture? Of course, I haven't gotten into anything about feedback effects. -
JoeT at 04:56 AM on 19 January 2013Ridley, Murdoch, and Lomborg Attempt to Greenwash Global Warming
Excellent article with a lot of good references to follow up on. I'm also looking forward to the follow-up article on carbon fertilization. I finally read the Ridley article about which I have a question. He says: Dr. Myneni reckons that it is now possible to distinguish between these two effects in the satellite data, and he concludes that 50% is due to "relaxation of climate constraints," i.e., warming or rainfall, and roughly 50% is due to carbon dioxide fertilization itself. I noticed that '50% is due to carbon dioxide fertilization' is not a direct quote from Myneni. I was wondering if anyone followed up to see whether Myneni actually said this? I find it hard to believe that any scientist would make such a blanket statement without a large number of caveats. And if by chance Myneni did say this, what in the world is the method by which he came to this conclusion? Is it published or just a wild guess? What's the error bar on that 50%? Also, was anyone able to find the "online lecture last July by Ranga Myneni of Boston University, confirms that the greening of the Earth has now been going on for 30 years"? I came up short. -
Bob Loblaw at 03:50 AM on 19 January 2013Resolving Confusion Over the Met Office Statement and Continued Global Warming
smerby: To parallel Dikran's answer, the tautological answer to "should it not have a little significance?" is to test the significance - which in statistical terms means doing statistical tests, not using the eyecrometer. ...but let's step back a bit and think about what a trend line is telling us. What does it really mean to "fit a linear trend"? To begin, go even further back in the thought process, and say "what is happening to the data in this period? 1) our first step in an analysis might be to say "what is the mean (average) temperature in this time period?" We can get a number, but we know that not all values will match the mean. So the next step is usually to calculate the variance or standard deviation, which involves looking at each temperature and how it compares to the mean (then square the differences, sum for all T, etc.). These are the residuals - how much each temperature is different from the mean. Note that the value of X (time, in this case) is not used. 2) the next step is the linear regression. Basically, a linear regression is based on the idea that the mean value of Y (temperature) changes with X (time), and that the change is linear with time. So a linear trend line is basically just a "moving average". Just as the simple average leaves residuals, so does a line fit to the data. The significance of the line fit depends on how well is reduces the size of the residuals. This reduction shows up as the r^2 value in a regression result. The actual significance test requires seeing whether this reduction is likely to happen by chance, due to random variation in the data. Note that a linear regression does not require any physical reasoning as to why the trend might be linear - it's just a common first step. There is the "correlation isn't causation" effect to account for. At this point, X and Y are just numbers that don't mean anything (or, rather, could mean a lot of things). 3) let's go one step further. Let's create a different description of how the mean temperature varies with time (or how Y depends on X). Instead of a simple linear relationship, we can make T change over time using any combination of factors - the only catch being that we have to be able to specify those factors at each time, too. Let's assume we can do that - so we end up calculating T over time. Once again, we can compare those calculated values to the actual temperatures (calculated "moving averages", just as we did when we performed our linear trend calculations, or as we did when we just used the simple mean. Once again, we'll end up with residuals (differences between actual observations and our calculated values), and we can see if the residuals are smaller. We can also do significance testing on that reduction. One advantage of approach 3) over 2) is that we can start to make our "moving average" depend on known physics, instead of a simplistic linear fit. We can add different bits of "known physics" and see how much they improve the fit (reduce the residuals). This makes an end run around the "correlation isn't causation" issue, because we are already working with factors that we are fairly sure have at least some cause-effect relationship. We may not know how much the effect is, though, and that is why doing the calculation and comparing to the data is important. How difficult is approach 3)? Harder than doing a linear fit, but not necessarily by much. If approach 3) involves a full-scale 3-d general circulation model, then it's a lot of work. ...but we have an example of a much simpler application of approach 3) in Kevin C's comments and graphs present here - especially in #118. Ask yourself: does the simple, naive linear fit do a good job of following all the bumps and wiggles in the temperature data based on the implicit assumption that something linear is happening (but we don't know what - just that we think it might be linear)? Or does Kevin's 2-box model that incorporates some known physics in a fairly simple way do better? ...and if Kevin's model (yes, it's a model, but so is a linear regression) is doing better, then what does his fit to the data tell you about the "significance" of the temperatures over the past 10-15 years? More importantly, what do you think it tells you about the role of CO2? -
John Russell at 02:52 AM on 19 January 2013Ocean Heat Came Back to Haunt Australia
As someone not in the first flush of youth, I can remember phrases like "the same amount of energy as 3 Hiroshima bombs" being used throughout my life; ie back to the 50s and 60s. Thus I would suggest that the unit of the 'Hiroshima Bomb' has been around since the late 40s. I can remember Apollo rocket launches being described in 'HB's. I found this reference from the UK Parliament's Hansard dated 1990 (just under the words 'Column 332'). It relates to the fire on the Piper Alpha gas platform; "the release of energy must have approached the scale of the Hiroshima bomb". -
Rob Honeycutt at 02:27 AM on 19 January 201316 ^ more years of global warming
Funny how so few of them are willing to come here and discuss it. Go figure. -
Kevin C at 02:18 AM on 19 January 2013Ridley, Murdoch, and Lomborg Attempt to Greenwash Global Warming
Terranova: You are certainly thinking along the right lines. There is a long literature on the relationship between El Nino and/or temperature and CO2 uptake, e.g. Barcastow 1976. The rate of CO2 change in the atmosphere lags the temperature change, showing that temperature or El Nino are driving the effect. This has fooled some skeptics who haven't read this literature (e.g. Humlum) into thinking that temperature is causing CO2 emission, when in fact the emissions have been more steady and the rate of uptake has varied. -
dana1981 at 02:17 AM on 19 January 2013Ridley, Murdoch, and Lomborg Attempt to Greenwash Global Warming
Terranova - yes, that's correlation, not causation. As noted in the post, Zhao and Running made a convincing case that the causation has more to do with increasing drought. -
Dikran Marsupial at 02:00 AM on 19 January 2013Resolving Confusion Over the Met Office Statement and Continued Global Warming
@smerby wrote "The global surface surface temperature trend of the last 10 years is insignificant when compared to the long term record. Should it not have a little significance when compared to a 30 year trend or a climate cycle, it is 1/3 of that period, just a question." I'm afraid this question makes very little sense, largely because your usage of "significance" is unspecified, and at variance with the usual statistical meaning. Perhaps if you are uncomfortable with statistics, it would be better if you avoided terms with statistical meanings, such as "significant"? -
Kevin C at 01:57 AM on 19 January 2013Resolving Confusion Over the Met Office Statement and Continued Global Warming
These images may help. The first I've shown before, and is the 2-box+ENSO model fit of forcings to temperatures. Here is the same thing, but with the ENSO contribution subtracted out from both the temperature series and model.
 And here it is again, this time with ENSO, volcanoes and solar subtracted out.
 A few comments on the features.
- The spike right at the beginning is an artifact of the calculation and is meaningless.
- There is a slight predicted slowdown in warming around the early 90's, related to a slowdown in methane emissions (which have recently picked up again), but also to the regulation of CFCs following Copenhagen. It is probably too small to detect in the temperature data.
- The largest remaining features are spikes around the second world war. The 1942-45 spike and following dip are at least in part due to the fact that GISTEMP does not yet include corrections for the change in sea surface temperature measurement methods after 1945. The pre-1940 spike is unexplained.
-
smerby at 00:24 AM on 19 January 2013Resolving Confusion Over the Met Office Statement and Continued Global Warming
Hi all, thanks again for the feedback. Although it may seem otherwise, I really am learning here. I do have a lot of questions and I appreciate all the help. The global surface surface temperature trend of the last 10 years is insignificant when compared to the long term record. Should it not have a little significance when compared to a 30 year trend or a climate cycle, it is 1/3 of that period, just a question. Based on some of your feedback, the global surface temperature record has varied against the back drop of continuous AGW, especially from the middle of last century when production of GHG emissions has accelerated. The multi decadal cooling and warming of the Pacific ocean has also lined up well with these temperature variations, in addition to trends in La Ninas and El Ninos. The slight cooling from the 1880s into the early 1900 hundreds was from the after effects of Krakatoa and a couple of impressive La Ninas. The warming from 1910 through the early 1940s was from an increase in GHG, low solar and low volcanism. In addition, there was a warm phase of the Pacific and increasing El Nino and decreasing La Ninas. The leveling off in the 50s, 60s, into the mid 70s, was from increased aerosol emission along with cooler Pacific and a decrease in El Ninos and an increase in La Ninas. The warming from the late 1970s through the 1990s was from a decrease in aerosol emissions and an increase of GHG. In addition the Pacific was in a warm phase with an increase El Ninos and a decrease in La Ninas. The leveling off of the past 10 years was from low solar and a cooler Pacific with an Increase in La Ninas and a decrease in El Ninos.Moderator Response: TC: Final sentence corrected by request. -
Terranova at 22:36 PM on 18 January 2013Ridley, Murdoch, and Lomborg Attempt to Greenwash Global Warming
I wondered if there might be a connection between temperature and plant growth (greening). So, I went to woodfortrees.org and generated the below graph. I am not skilled enough with graphics to do an overlay, but this looks close enough to make one wonder if there is a link. But, then we would get into the correlation/causation dialogue.Image from www.woodfortrees.org
 Moderator Response: [RH] Can I ask you to please insert into your links this bit of html: width="500" If you do this it will keep your images from breaking the page formatting.
 -
Tom Curtis at 21:22 PM on 18 January 2013Ridley, Murdoch, and Lomborg Attempt to Greenwash Global Warming
jhoyland @26, the Houghton figures are for direct human effects on the biosphere alone. Those include deforestation, reforestation, and agricultural practices. They do not include indirect effects such as CO2 fertilization, increased growth due to increased sunshine, or water etc. Consequently there is no contradiction between Houghton, which shows the net direct human impact on the biosphere is a carbon source, and the O2 data which shows that despite that, net natural and indirect human factors draws down more CO2 from the atmosphere than direct human impacts cause in emissions. -
jhoyland at 18:39 PM on 18 January 2013Ridley, Murdoch, and Lomborg Attempt to Greenwash Global Warming
Tom @24. I'm a bit confused - you say the biosphere is a net sink but reading the graphs in Houghton article it looks to me like the flux is positive (carbon to the atmosphere). Am I missing something? -
macoles at 17:04 PM on 18 January 2013Accumulated Cyclone Energy Questions and Answers
Thanks Rob and Mike. The chart in your 02 Nov 2012 article link shows a huge difference between low intensity high IKE cyclone Sandy, and high intensity low IKE cyclone Charley. Really shows the limitations of ACE as a proxy for destructive storm seasons. -
Doug Hutcheson at 16:53 PM on 18 January 201316 ^ more years of global warming
Wow! The denier zombie hordes have kept me busy linking to this post at other venues, so much so that I have now saved it in my bookmarks. Thanks for providing such a good resource. -
Mikemcc at 16:39 PM on 18 January 2013Accumulated Cyclone Energy Questions and Answers
There's a fairly clear article in the Washington Post related to IKE Article 02 Nov 2012 -
smerby at 16:23 PM on 18 January 2013Resolving Confusion Over the Met Office Statement and Continued Global Warming
Thanks all for the feedback Smerby -
mshea at 16:15 PM on 18 January 2013Debunking Climate Myths from Politicians
Surely acting Opposition Leader Warren Truss gets a mention for these two.... ''Indeed I guess there'll be more CO2 emissions from these fires than there will be from coal-fired power stations for decades,'' IT'S ''utterly simplistic'' to suggest there's a link between climate change and Australia's heatwave and bushfire crisis, acting Opposition Leader Warren Truss says. AAP January 09, 2013
Prev 983 984 985 986 987 988 989 990 991 992 993 994 995 996 997 998 Next


