


 Arguments


Natural forces overpowering Antarctic Peninsula warming
Posted on 4 August 2016 by Guest Author
This is a re-post from Carbon Brief by Roz Pidcock
In the latter half of the 20th century, the tip of the Antarctic Peninsula was among the fastest warming places on Earth. But since the late 1990s, this fast-paced warming has been tempered by extreme natural forces, according to new research. So much so, that some parts have switched to cooling.
In many ways, the results are unsurprising. Scientists know that natural variability superimposes temporary ups and downs on top of greenhouse gas-induced warming everywhere on Earth.
Prof Robert Mulvaney, part of the team of British Antarctic Survey scientists who carried out the research, tells Carbon Brief:
“The results are as we would expect.”
The authors of the study, published today in Nature, also stress their findings are restricted to a small part of the Antarctic Peninsula, and do not imply cooling across the ice sheet as a whole.
‘Hot spot’
Such is the harsh and inhospitable nature of the Antarctic environment that carrying out field research is very difficult. Monitoring stations are few and far between.
The data for the new study comes from six research stations situated near the tip of the Antarctic Peninsula – the northernmost part of the Antarctic mainland. It is here that some of the largest temperature rises have been observed. Between 1951-2000, a station known as Vernadsky (formerly as Faraday) recorded an increase of 2.8C.
As Professor Tim Naish, director of the Antarctic Research Centre at Victoria University in Wellington, New Zealand, says:
“[The new paper] focuses specifically on the temperature records of the Antarctic Peninsula, which has often been referred to as a ‘global warming hot spot’. “
The six coastal stations are nestled quite closely together near the tip of the peninsula, as the map below shows. Together they cover an area equivalent to 1% of the Antarctic ice sheet. As the authors acknowledge, this means their results do not imply anything about the Antarctic Peninsula as a whole, much less the entire Antarctic continent.
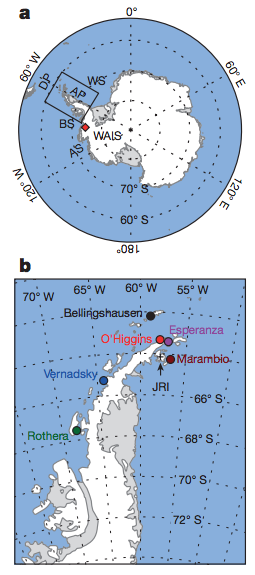
Map of the Antarctic (top) with the locations of the six stations (bottom). Turner et al., (2016)
Turning point
The researchers began by “weighting” each station based on the reliability of its information, before combining all six stations into an average temperature series.
The records of two of the stations extend back to the 1950s, but most are shorter, beginning in the 1970s. Combining the records effectively removed the influence of different local effects, the paper explains.
The scientists then applied a statistical technique, known as a Mann-Kendall test, to look for any point within the time series where the size or direction of the trend changes.
Using this method, they found such a point occurred in late 1998 to early 1999. Before this, the stations recorded an average warming of 0.32C per decade. But afterwards, the trend turned negative, showing 0.47C of cooling per decade until the last measurement in 2014.
By repeating the analysis without 1997 or 1998, the authors satisfied themselves that the switch from warming to cooling trend was not an artefact of the extreme El Niño conditions.

Average temperature anomaly for all six stations, with the annual mean shown by the thick black line. Red lines indicate linear warming trends. Turner et al., (2016)
It’s important to note that all six Antarctic Peninsula stations are warmer now than they were at the beginning of the study period. You can see this in the graphs below from the paper (each coloured line is a single station).
What the new paper shows is a change of pace within that longer warming trend, says Dr Ed Hawkins from the University of Reading, who wasn’t involved in the study. He tells Carbon Brief:
“Each of the Antarctic Peninsula measurement stations shows an overall warming trend since their measurements began, but those on the very tip of the Peninsula show an apparent cooling over the last couple of decades.”
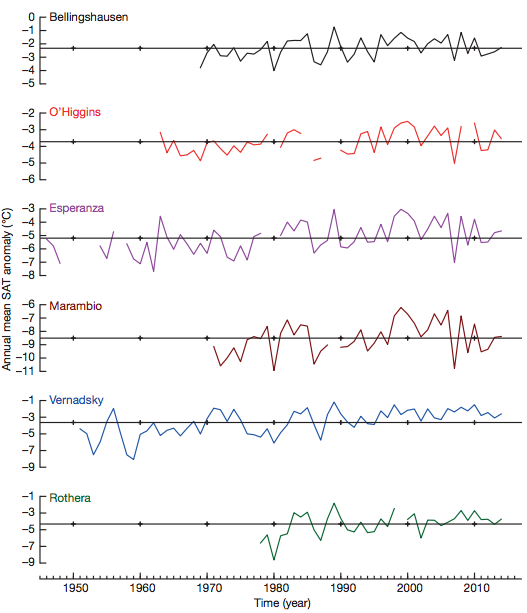
Average annual surface temperature anomalies for each of the six Antarctic Peninsula stations. Each show a warming trend since the start of the record but a statistically significant change of pace around 1998/9. Turner et al. (2016).
Natural fluctuations
With temperature records in the Antarctic Peninsula spanning just a few decades, it’s inherently difficult to tell whether or not changes observed since the 1970s are “normal” for the region.
To get around this, the scientists compared their results with a reconstruction of how the climate has changed in the past using ice cores. These retain a “memory” of past temperatures by capturing air bubbles between the ice crystals.

A slice of an ice core from James Ross Island, near the northern tip of the Antarctic Peninsula. Credit: British Antarctic Survey.
Examining the ice core record showed the ups and downs in temperature since the 1970s are within the bounds of what the region has experienced naturally in the past. At some points, the changes were much bigger, Naish says:
“[D]uring past warmer-than-present climates, when carbon dioxide levels reached 400ppm or more, Antarctica did display an amplified warming pattern up to two times more than the global average.”
The authors of today’s study attribute the cooling at the six Antarctic Peninsula stations since the late 1990s largely to more frequent cold winds, caused by a stronger mid-latitude jet.
These same atmospheric circulation changes have pushed sea ice inland, the paper notes, leading to a build up along the northern Antarctic Peninsula. The extra sea ice, in turn, has amplified the cooling trend by shutting off the flow of heat from the ocean to the atmosphere.
The image below from the paper shows the drop in sea ice during the fast warming in the 1980s and 1990s (green, left map) and the rise during the slight cooling in the 2000s (purple, right map).
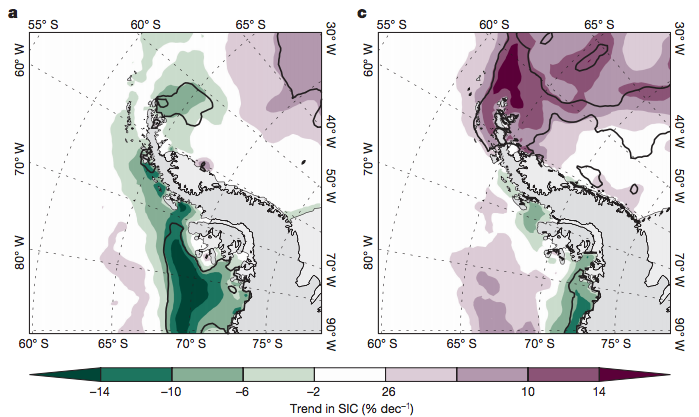
Trend in annual mean sea ice concentration from 1979-1997 (left) and 1999-2014 (right). Bold black lines indicate where changes are statistically significant. Turner et al., (2016).
Profound changes
Today’s study is a good example of natural variability working both ways, says Prof Nerilie Abram from the Australian National University, who wasn’t involved in the research. She says:
“[L]ong-term changes in our climate also have a layer of year-to-year variability on top that can cause some decades to warm particularly quickly and others to apparently not warm at all.”
In the same way that natural forces are aligning to cause temporary cooling in parts of the Antarctic Peninsula at the moment, they collectively pulled in the opposite direction during the 1980s and 1990s to amplify the warming coming from greenhouse gases.
This pattern holds true outside of the Antarctic continent. Looking at the average temperature for the whole of Earth’s surface, we see the same periodic rise and fall as natural fluctuations either amplify the signal or mask it by pulling in the opposite direction. Yet the trend is still clearly one of warming.
Back to Antarctica, warming in recent decades has triggered some profound changes across the Antarctic Peninsula, including disintegration of the region’s ice shelves, retreating glaciers and a decline in some penguin populations.
The Larsen-A ice shelf collapsed in 1995, followed by its neighbour, Larsen-B, in 2001/2. Rising air temperatures are also contributing to the thinning of Larsen-C, which is now also at risk of collapse.
Talking about Larsen B, Prof Eugene Domack from the University of South Florida tells Carbon Brief:
“The ice shelf collapse in 2001 was in response to protracted warming throughout the 1990s that preconditioned the ice shelf to collapse during the very warm summer that season.”
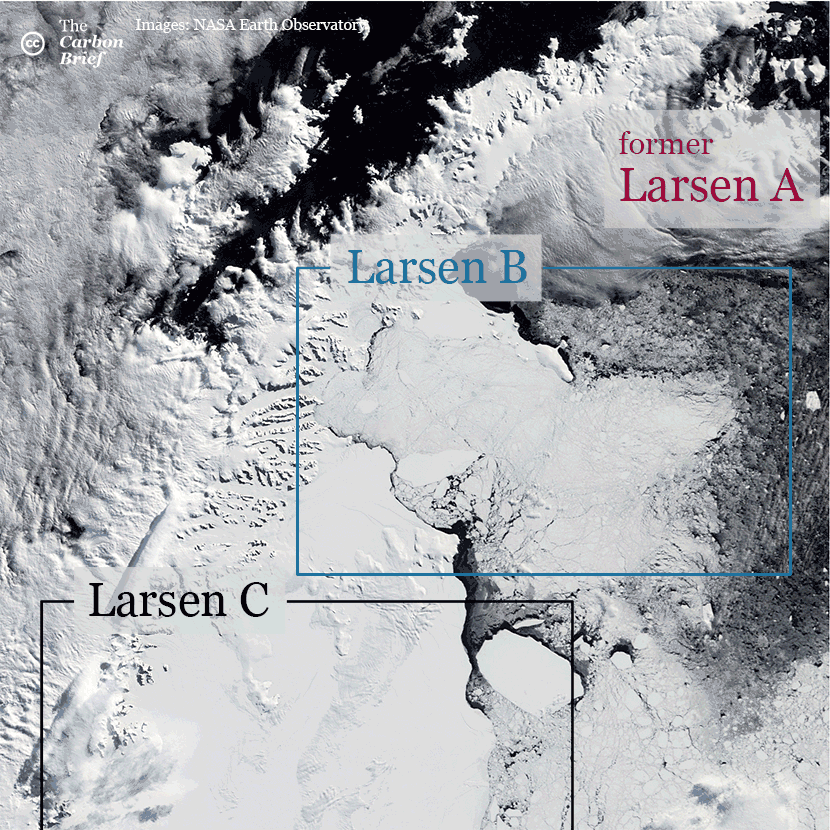
Credits | Images: NASA Earth Observatory. Gif: Rosamund Pearce for Carbon Brief.
Dual forcing
But there are other destructive forces acting on the Antarctic Peninsula, as well as the changes in air temperature that today’s paper discusses. A study last week described how of the 674 glaciers on the Peninsula’s western side, almost 90% are retreating because of rising ocean temperatures.
Lead author Dr Alison Cook from Durham University tells Carbon Brief that the new paper is not in conflict with hers, since the processes they describe are happening simultaneously. She says:
“The climatic cooling that [Turner et al.] report would not explain the acceleration in glacier retreat in the 1990s and the continuing retreat since then, whereas these patterns are consistent with ocean temperature patterns.”
Prof Andy Shepherd, an expert in monitoring the Earth’s icy expanses from space at the University of Leeds, echoes the warning about rising ocean warmth. He says:
“There are few scientists left who believe that atmospheric warming will be the main cause of Antarctic instability over the next century. The real threat is ocean warming.”
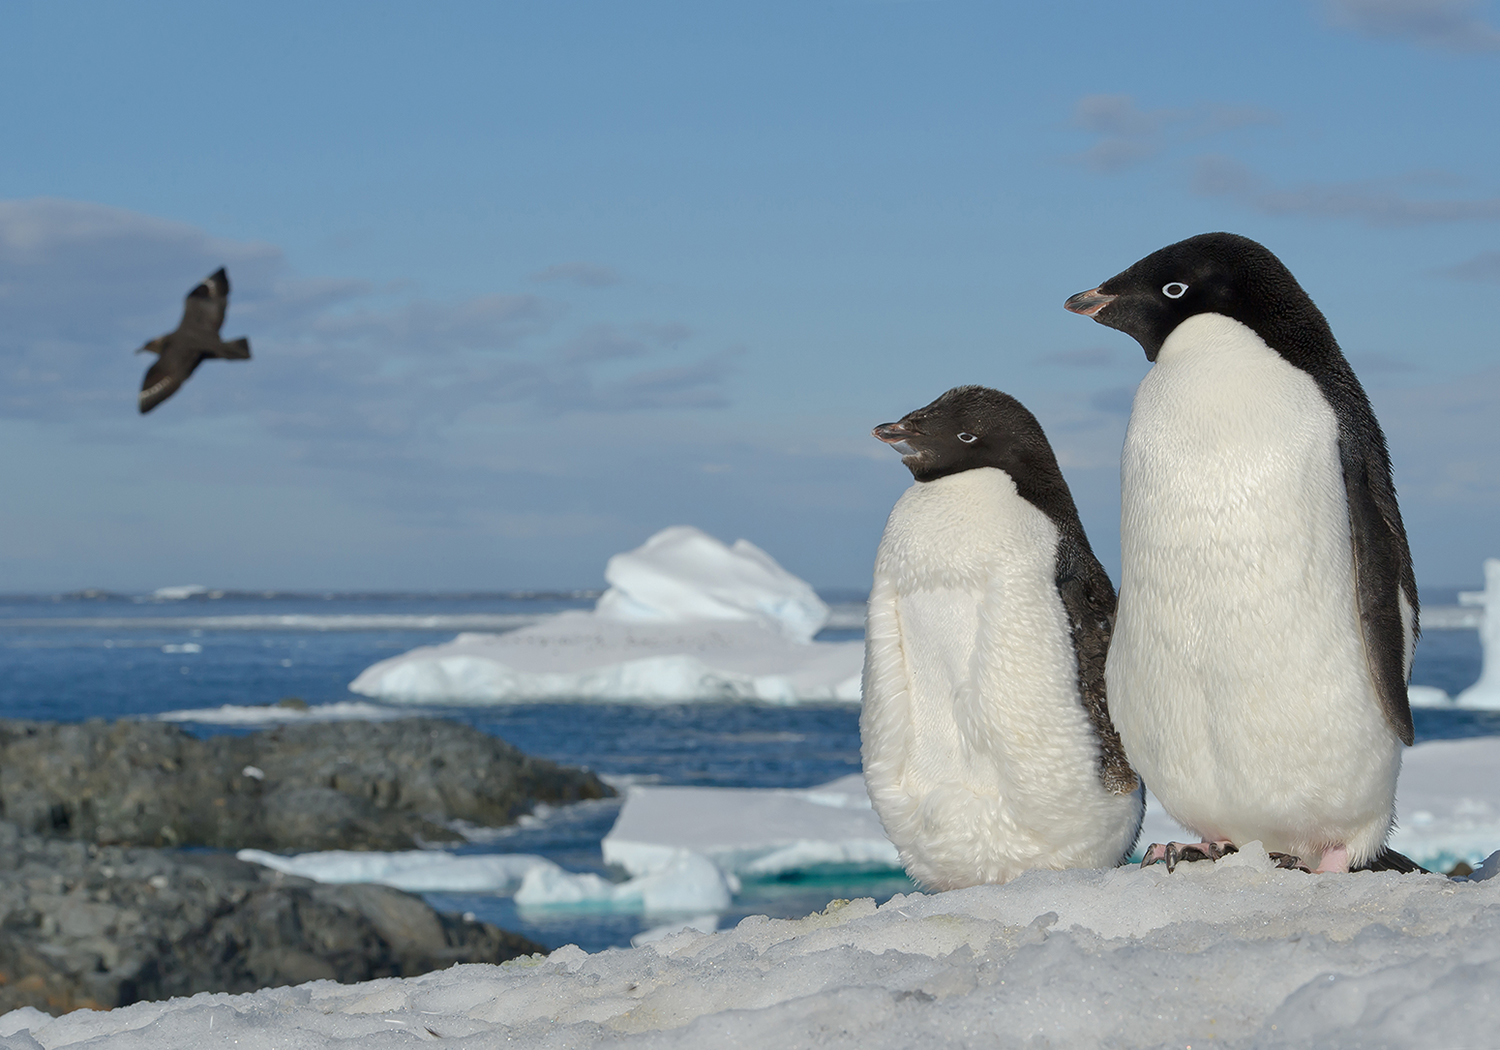
Two Adelie penguins standing on snowy hill, looking at flying skua, with blue sea and iceberg in background, Antarctic Peninsula. Photo: mzphoto11/Getty Images.
Looking ahead
The short, sparse temperature record in the Antarctic Peninsula – and across the wider ice sheet – means it may take decades to unravel the precise contribution from natural variability to changes we’re seeing on the ground.
Nevertheless, the long term outlook looks bleak. The Antarctic ice sheet is already thought to have lost 30bn tonnes of ice each year from its surface between 1992–2001, rising to 147bn tonnes per year from 2002-2011.
The portion of ice that floats on the water rather than sitting on land has increased over the satellite record. But since this is thought to be a result of natural variability rather than a response to long term greenhouse gas warming, scientists don’t expect this to continue.
The Intergovernmental Panel on Climate Change estimates that if emissions keep rising as they have been, Antarctica could see 3-4C warming above preindustrial temperatures by the end of the century – a prospect that holds clear consequences for the stability of the ice sheet.
As with anywhere on Earth, scientists don’t expect that warming to happen at the same pace everywhere. The message from the authors of today’s study is that while it’s essential to understand the extra levels of complexity that natural variability adds to the long-term climate change picture, it’s for precisely this reason that short periods of 10 years or so need to be firmly couched in context of the region in question, rather than viewed in isolation.


MHO: There are several better headlines out there on this story, and I wish you had used one of them, instead of one that seems to play into the notion that all of this stuff is natural cycles. Just Google on "Antarctic peninsula" and you will see them. Your site is fantastic, and I'd like to see all the headlines be top-notch as well.
[JH] When we reprint an article, we generally use the headline of the article as it appears on the originating website. Such is the case for this OP.
climatehawk1@1,
There are different explanations for the processes going on in the Antarctic, that have little to do with "natural variability". For example, the observation:
can be explained by decreased salinity of the shalow waters in Southern Ocean, thus giving it better chance to the winter freezing.
The fact that this article does not focus on such explanations, but tries to find other factors, does not make it bad. Its title reflects the actual focus of the article therefore appears adequate. On top of that, the article does not claim that other factors do not exists. Your argument that Google search finds all those other unmentioned factors, does not invalidates the integrity of this article, nor its title.
"The six coastal stations are nestled quite closely together near the tip of the peninsula, as the map below shows. Together they cover an area equivalent to 1% of the Antarctic ice sheet. As the authors acknowledge, this means their results do not imply anything about the Antarctic Peninsula as a whole, much less the entire Antarctic continent"
The problem I see here is that it logically follows that previous high rates of warming at the tip of the peninsula must be as equally insignificant as the recent cooling trend.
I gues we call it global warming for good reason, because localised regional climate changes, regardless of sign or phase are not necessarily related to human induced climate change.
Whether intended or not, readers will infer fromn this study that the previous attributed warming of the peninsula to greenhouse warming was exaggerated.
Thanks, I understand about using the original headline, just want to urge careful consideration, as with all due respect, I don't think it's the best choice in this case.
chriskoz @2, the question is not scientific integrity, but of communication with a general audience. Try to see the headline for a moment with "fresh eyes"--as if you knew nothing about climate science. The other articles, with different headlines, are all scientifically accurate, as far as I can tell--the question is what the headline conveys.
OK, thanks all for listening.