Climate Science Glossary

Term Lookup

Enter a term in the search box to find its definition.

Settings

Use the controls in the far right panel to increase or decrease the number of terms automatically displayed (or to completely turn that feature off).

Term Lookup

Settings


All IPCC definitions taken from Climate Change 2007: The Physical Science Basis. Working Group I Contribution to the Fourth Assessment Report of the Intergovernmental Panel on Climate Change, Annex I, Glossary, pp. 941-954. Cambridge University Press.

Home Arguments Software Resources Comments The Consensus Project Translations About Support

Bluesky Facebook LinkedIn Mastodon MeWe

Twitter YouTube RSS Posts RSS Comments Email Subscribe


Climate's changed before
It's the sun
It's not bad
There is no consensus
It's cooling
Models are unreliable
Temp record is unreliable
Animals and plants can adapt
It hasn't warmed since 1998
Antarctica is gaining ice
View All Arguments...


Username
Password
New? Register here
Forgot your password?

Latest Posts

Archives

Kung-fu Climate

Posted on 6 May 2010 by Rob Honeycutt

Guest post by Rob Honeycutt

The other day I happened upon the Popular Technology blog that has a list of "700 peer reviewed papers supporting skepticism of man-made global warming." This was news to me so I started to look into the first paper on the list. Loehle 2007 titled A 2000-Year Global Temperature Reconstruction Based on Non-Treering Proxies published in Energy & Environment. I'm sure many Skeptical Science readers are familiar with this paper and Loehle's 2008 correction. I was not.

I decided to email Dr. Loehle with some questions and got a very prompt response from him. This was followed by a number of back and forth emails. What I got from him was that he believes himself to be one of the scientists whose work is blocked from publication for political reasons. And I got that his motivation for this 2007/2008 paper was to point out the "politically motivated" science trying to obscure the MWP by Michael Mann and others. I do not doubt Loehle is genuine in this statement and that he is genuine in his desire to do good science. Nor do I doubt that Mann, Briffa, Moberg and other who have done similar temperature reconstruction to be any less genuine in their desire to do good science. I have no reason to doubt either. But as I put it to Loehle, "I think contentious issues in science have always been a bare knuckle brawl." This is not new to climate science. Often it comes down to whether my kung-fu is better than your kung-fu.

So, in this kung-fu match, not being a scientist myself, I have to place myself in the position of the audience watching the fight. I'm not a kung-fu master. I'm a spectator trying to decide whose kung-fu is better. I've read all the arguments against Loehle's 2008 paper with regards to it having far fewer (only 18) data sets opposed to Mann's 1200 data sets. But that's fine. I accept that Loehle is trying to tease out potential errors imposed from treering data.

As I was researching this I came onto one post on Yahoo Answers from a person called Keith P who tries to answer the question, "Does Loehle actually refute Mann in any way?" Keith does something quite simple that I have reconstructed for myself. He just scales Loehle's to the "hockey team" chart that contains Mann, Briffa, Moberg and other temperature reconstructions and overlays the two. The result, to me, was very illuminating but I'm going to take a slightly different approach than Keith P.
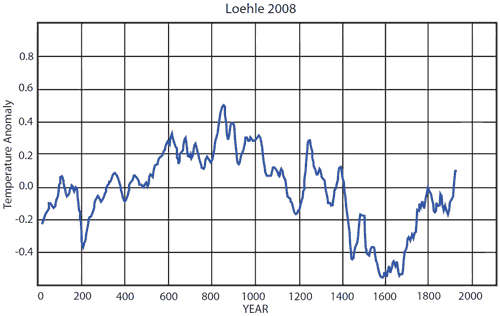

Figure 1: Loehle 2008 temperature reconstruction.

In Fig 1, I have taken Loehle's temperature anomalies and kept his scale in both the X and Y axis. I've also kept his zero axis. I believe this is a reasonably faithful reconstruction of Loehle's data. My apologies to the data purists out there who might find some inherent abomination in my method. Graphically it works (I don't know why more scientists don't either enlist the help of a graphic artist or at very least audit a couple of courses at their local university).

The other critique of Loehle's paper has been that the data ends in 1935. This, from my position in the bleachers of the kung-fu match, is much more problematic for Loehle. I know the paper is not about current warming. I know it's about treering proxy errors but that is sort of missing the forest for the trees (pun is definitely intended). I understand why the data ends at 1935. But I just can't buy NOT making the attempt to concatenate this data with the past 150 year of recorded temperature readings. Even if the modern temperature records are not central to the topic of the paper to not add the blade to his hockey stick is a mistake. Maybe not from a scientific perspective, but from the bleacher's perspective it is.
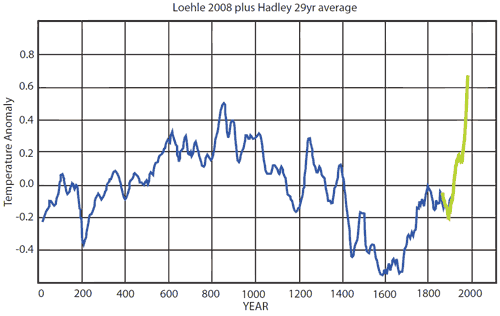

Figure 2: Loehle 2008 temperature reconstruction with Hadley instrumental record.

While I was writing this Loehle was kind enough to provide me with a Hadley chart with the same 29 year smoothed average as his data allowing me to compare apples to apples. In Fig. 2 I have added the Hadley data to his. It takes quite a bit of scrunching (my technical term) to fit 150 years of data into a 2000 year chart. This is definitely a rough cut and paste so I would not be prepared to make any claims about precisely how many degrees warmer today is over the MWP based on this chart. One should note that since this is a 29 year smoothed average not all the most recent (less statistically significant) data is included. The only conclusions I can come to is that the current warming has happened as fast or faster, and is more sustained, than any time in the past 2000 years, and that we are at least as warm as the MWP and maybe warmer. I would not assume Loehle's work to be definitive here any more than I would consider Mann's to be so. No, it's not a scientific conclusion. It's a conclusion that the rest of the 99.9999% of the non-scientific world has to try to grapple with.

In the final battle in this kung-fu match I have to throw everyone into the ring together. Mann with his Crouching Tiger style. Crowley and Lowery with their Striking Serpent. Jones and his Monkey Fist style. Moberg is a student of Jackie Chan's Drunken Boxing. Briffa's Shaolin and his et al grasshoppers. And all the others pasted in behind Loehle's Wing Chung style chart. This is Fig 3.
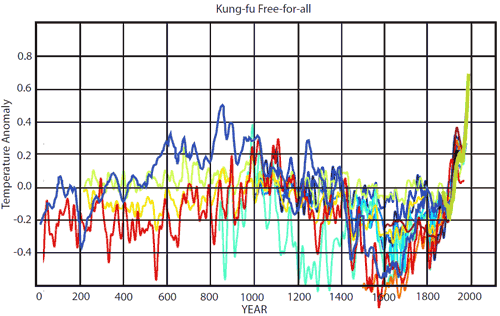

Figure 3: Loehle 2008 temperature reconstruction (blue) with other temperature reconstructions (source: Wikipedia).

What a bizarre, almost absurd, cacophony. What I see in this is a battle of home made hockey sticks. Some straight, some crooked, some short, some long. But I see all our kung-fu masters each beating the other with their own hockey sticks. What's most strange to me is that it seems like the MWP battles are all about the shape of their hockey sticks and miss the rather more important question of NOW. I have two kids that are 5 and 6. When they are in their 20's or 30's I'm going to have to answer to them and tell them what I did back in 2010. What did I know and what did I do about it? Now really is everything.

There is a wide gap between you kung-fu masters in the ring as you bloody each other up over these kinds of issues and those of us in the bleachers trying to understand what this fight means. It's certainly easy to sell tickets to this bloody brawl but don't forget that the rest of the world needs to potentially make some very quick decisions with regards to the future of our planet. This is not a political statement, this is just a potential statement of fact. I urge everyone in science to stop playing games. Fight the good fight. Pay respect to a good fighter. And may the best kung-fu win.

I want to extend my personal thanks to Dr. Loehle for his patience in answering my rather long string of questions.
 

0 0

Printable Version  |  Link to this page

Comments

Prev  1  2  3  4  Next

Comments 51 to 100 out of 186:

  1. In reply to HumanityRules @#27, I didn't mean to imply that the study of paleoclimate is not relevant to our understanding of contemporary climate change. It is important, and geologists have much to contribute in this regard, but we must remain cognizant of both similarities and differences in looking at paleo-analogs. At present, I'm persuaded by Penn State Professor Richard Alley's interpretation that variations in CO2 plays a (the?) predominant role in controlling surface temperature. Similarly, it is not just the right, but the duty of true skeptics to continue to search for alternative explanations for contemporary climate change and to "fine tune" our understanding of the 'biggest control knob(s)'. That said, the presumption that there has to be some other explanation than AGW, because AGW couldn't be true, is what distinguishes denialism from skepticism.
    0 0
  2. CBD: No, there is no attempt in Loehle to consider the spatial distribution of the proxies. Loehle's method is as bare-bones and simple as can be imagined. Loehle's method: 1. Take proxies with published calibrations. Assume the calibration was OK as given, and that the proxy was temperature-sensitive the whole time. Note to PopTech: at least some of the authors of the individual proxies probably calibrated against HadCru, so even Loehle's original work has CRU influence in it. 2. Interpolate low res series to annual basis (hopefully they did this in some reasonable way) 3. Smooth with 29-year moving average 4. Subtract from each series its mean (they didn't use a common baseline period? that seems like a mistake) 5. Take a simple mean There is no attempt to calibrate/validate the overall reconstruction, no attempt to consider the spatial distribution.
    0 0
  3. skywatcher, there actually is about a 0.3C per century difference between the UAH trend and all the other trends. Here are the trends, 1979-present for the various temperature data sets (in degrees C/century): Satellite troposphere: UAH +1.3 RSS +1.6 Surface (land/ocean combined): HADCRU: +1.6 GISSTEMP: +1.6 NOAA NCDC: +1.6 Independent analyses (land/ocean combined): Nick Stokes: +1.7 Clear Climate Code: +1.6 Zeke Hausfather: +1.6 Of course, this is all a bit off-topic for this thread...
    0 0
  4. CoalGeologist writes: That said, the presumption that there has to be some other explanation than AGW, because AGW couldn't be true, is what distinguishes denialism from skepticism. That's very well put. I would just add that skepticism implies critical examination of claims from all sides, whereas denialism is assymetrical in its view (disputing even the most robust claims from one side while credulously accepting nonsense from the other). All scientists should be skeptical (to an appropriate degree, of course).
    0 0
  5. The one thing that the author of this article did wrong was use the 700 papers site. They put papers on there that aren't even skeptical like André E. Viau et al. 2002. I've taken courses with that guy, and read all his papers, there's no way he's a skeptic.
    0 0
  6. PopTech: "UAH trends 0.3C cooler" When discussing trends, you need units appropriate for trends - temperature/time. GISS gives something like 0.16-0.17 C/decade; UAH gives 0.13-0.14 C/decade. How you get "0.3 C" is beyond me. In any case, for the limited purposes here, GISS and CRU are essentially identical. But CRU goes back to 1850 instead of just 1880. Given that Loehle's work only extends to 1935 (1949, really), the extra years of overlap would be helpful in properly grafting on the instrumental record. *** I erred in my description at Part 4; they indeed used a fixed baseline.
    0 0
  7. My bad, Ned and Poptech, I mistook the 0.3C difference in anomaly as being what Poptech referred to, rather than the 0.3C per year difference in the trend (because Poptach referred to a value rather than a rate, and 0.3C is the difference in the anomaly values on the graph that was linked to). As your numbers show Ned, the trend in all measures is still significantly positive, which is the important point.
    0 0
  8. skywatcher: That's 0.3 C/century, not 0.3 C/year, if that's what we're after. Big difference.
    0 0
  9. It's not surprising that all the different surface temperature analyses converge on +1.6 to +1.7C/year, since they're using basically the same data. There are some useful things that can be learned from comparisons among them: * There don't seem to be any significant problems with the code used by GISS or CRU, since other analyses give the exact same result. * The decline in numbers of high-latitude, high-altitude, and rural stations doesn't seem to affect the trend (or, if anything, it leads to a slight underestimate of the warming trend). * The reported surface trend is not an artifact of the "adjustment" process, since the trend is found using both raw and the adjusted data. The very close match between the surface trend and the RSS trend is more interesting, since they are based on completely different data and methods. Occam's razor suggests to me that if RSS and all the surface analyses agree exactly, and UAH is a bit lower, it's more likely that UAH is wrong than that UAH is right and the others happen to coincidentally hit on the same wrong result. Plus, of course, UAH has a history of substantial errors in the past.
    0 0
  10. Ned: Since RSS and UAH are not measuring the surface but an altitude range we might call lower troposphere, one wouldn't necessarily expect an exact match to the surface records. It'll be something similar, though, and should correlate pretty well. But yes, UAH has a shaky history, for whatever that's worth in assessing current discrepancies.
    0 0
  11. Mann's Hockey Stick also has a no-treering (no-dendro) version that yiels pretty much the same results as far back as some 600 a.D. Here, graph b on page 13.
    0 0
  12. Side note: Tree ring dating studies These get mentioned a lot, and I've seen some questions on how this is done. Understand that I'm not a tree ring dating specialist. However, I work with people who date tree rings, fish scale growth rings, etc., using software I write, and have some background as a result. Tree ring growth patterns can be strung together over generations of trees by normalizing growth rates. Early rings are thick (saplings grow fast), while later in their life rings thin out - they're larger, and even a larger mass increase is distributed around a bigger circumference. However, you can take a simple exponential fit to these and normalize the growth rates. You then match patterns of relatively thick or thin rings (good and bad years) to older trees, establishing how their lifetimes overlapped. Repeat as far as you can/as far as you have tree trunks, and you can extend the growth rate data out for centuries. The next step is trying to relate these relative growth rings to local conditions. That's a bit more of a stretch; different trees may have had different local sun/water/fertilizer conditions. But given data about how individual species perform under different conditions of temperature, you can estimate temperatures with sufficient tree data to average other local variations over the area your trees came from. I haven't seen much about correcting growth rates for other large region variations, such as CO2 level; can anyone comment on whether that variable is accounted for in tree ring data? Perhaps that (recent CO2 change) has an effect on the recent divergence of tree ring proxies from the temperature record?
    0 0
  13. Yep that's 0.3C/century difference, not, thank goodness, 0.3C/year! (before anyone quibbles, Ned's done the same thing and I'm sure he means +1.6 to +1.7C/century. Poptech, you're wasting everyone's time here. If you want the data and methods, go get the source data from the national met offices and use the methods outlined in the literature. If you can't/won't do that, then you're not in a position to quibble the data. You can generate an independent serioes from available online data as described here for GISS (gives essentially the same result), but I doubt you're interested in that either.
    0 0
  14. Poptech writes: So all that and still no raw data and methods for CRU. Why the obfuscation? I didn't ask for GISS, UAH or RSS, yet you provide me with what I did not ask for, fascinating. "Obfuscation"? I was trying to be helpful. It's not anyone's job here to "provide you with what you ask for." As far as I know, nobody here works for CRU, so posting demands here is unlikely to be an efficient way to get what you want. Nonetheless, I always try to be helpful, so here is a set of links to the CRUTEMP source code and data. If you have further questions about that, you should probably contact CRU directly.
    0 0
  15. FWIW, here is my perspective from watching the Kung Fu battles from my blimp. Temperature proxy studies in general: Useful as an independent measure of how much humans are affecting climate. Divergence of current patterns from previous patterns in baseline, variance, and rate of change can be estimated. These estimates can be useful for checking estimates derived from the physical properties of GHGs, insolation, changes in albedo, etc. But hey, they are proxies about temperature and don't touch what we know about absorption spectra of gases, Stefan-Boltzman, etc. Basic physics tells us that adding more GHG to the atmosphere, other factors remaining more or less constant, will raise the temperature at the surface; the questions are only by how much and how quickly. (And basic chemistry says that the pH of the oceans will change when CO2 levels change, but that is another topic.) Tree ring studies to determine past temperature: To be honest, these is kind of a 'meh' for me. The reason for this is that the rate of growth of a tree is a complicated function where the slopes for each factor don't always go in the same direction. That is, there are 'sweet spots' for any plant on any factor, a little less or a little more and the rate of growth declines. Last year was excellent temperature-wise for my cedars, but half my trees nearly died because it was too wet. My understanding is that Mann and the others tried to pick trees in locations where the limiting factor to growth was temperature, but climate change is not just temperature; it's also patterns of precipitation. I don't know how you look at a tree ring and tell how much water it got that year, and if the temperature gets above the comfort zone for the tree, you get the same decline in growth as if it were below. I don't know how you tell the difference. Mostly what you can tell from a thick growth ring was that all factors were not too far from the ideal for that species. Bottom line: temperature is a factor in tree growth; so, I'm sure there is a correlation and these studies are useful, but I'm not going to get overly excited about divergences between tree studies or tree studies and temperature records. If I'm missing something, please fill me in.
    0 0
  16. #41 Humanity Rules, thanks for linking to the list for MBH98. I was under the impression that there were more proxy records from ice cores, corals, and other non-tree-ring sources available today. I don't have a list of those handy, though.
    0 0
  17. Poptech: This is a pointless red herring. CRU and GISS match so far as the purposes here go, so it simply doesn't matter for the discussion here. If you want CRU to be as user-friendly as GISS - it simply isn't, at the moment. And it won't be, for some time - in some cases, CRU never even had the raw data; they have sometimes accepted homogenised date from the source countries (NOAA and thus GISS do not). Nor do they seem very organised in knowing which data they're allowed to publicly release. Nor does CRU have a simple computer program like GISS (and soon, NOAA) that reads in a file of raw data and spits out the answers. Some of CRU's homogenisations were done by hand, not computer algorithm. The way CRU has built it is fine for a normal research project. However, it's less optimal for a public resource used by many workers. So it's good that there are parallel efforts like GISS that give the same results anyway. So with the exception of the 1850-1880 period, it simply does not matter whether you use GISS or CRU here. Continuing to harp on it is not constructive in this context. The context is in discussing Loehle, not bookkeeping issues with CRU which are not relevant to Loehle.
    0 0
  18. skywatcher writes: Yep that's 0.3C/century difference, not, thank goodness, 0.3C/year! (before anyone quibbles, Ned's done the same thing and I'm sure he means +1.6 to +1.7C/century. Hahahaha, you're right. I can't believe I did that literally right after carrot eater had corrected you for the same slip-up.
    0 0
  19. I am of mixed feelings as to whether a comment such as Poptech @#70 adds anything of value to a discussion such as this, but finally decided that it's worth including as an example of a logical fallacy variously referred to as "Moving Goalpost" or "Impossible Standards", etc. Despite an extensive discussion of how the HadCRUT temperature data are verified and corroborated by numerous other data sets, a "litmus test" was set forth by which the entire data is to be discarded as "worthless". In empirical sciences (such as geology and climate science, for example) we are frequently obliged to use data sets that are flawed in some manner, inadequately documented, etc. It's very tempting to just throw them away, which can leave us nowhere. The greater value is to use the data to their maximum advantage. This is what all the surface temperature data sets have been obliged to do (e.g. NOAA's GHCN) I have little doubt that the growing trend toward "transparency" in the global climate data will be continue to evolve, in response pressure from skeptics, particularly at the CRU. The challenge is not to fall down the "slippery slope" from skepticism to denialism in the meantime. By the way, if you are really keen on working with raw data, you might find what you are looking for at Rimfrost
    0 0
  20. Ach, "...these _are_ kind..." The timing of the precip in relation to the growth season is also a complicating factor. So, just musing, if there is a general trend across studies where tree growth has declined while temperatures have risen, that could be an indication of either crossing over to the too-warm side for the tree or a general shift in rainfall patterns. Neither interpretation bodes well, or should lend credence to the idea that the divergence is a reason not to be alarmed at the current (and future) state of affairs.
    0 0
  21. In post 5, responding to: http://www.skepticalscience.com/Common-graphical-tricks-and-the-Medieval-Warm-Period.html Brendon fixed the Medieval WArm Period as : "Firstly take notice of what is commonly regarded as the MWP period, a time from AD 950–1250, that's 300 years centered around AD 1100." If that is the case, Loehle is somewhat off in his timing for the MWP. His MWP peaks at 850 then falls of, with a smaller peak about 1250. Most of the other charts seem to get their timing more accurately set.
    0 0
  22. There are also culling events in forests. This matters because trees packed in amongst other trees get less sunlight than trees less densely packed. Foresters will tell you that they can see patterns of rapid growth and slow growth for individual trees based on how closely packed the forest is. It's just more noise that has to be averaged out, but let's play a hypothetical. Suppose there was a drought over a region that killed X% of the trees. Following the drought, the survivors would show decades of higher growth from the lessening of competition. What would that look like from 500 years later when all you have left are the trunks of the survivors? How would you tell the difference between that and a temperature rise over the same region and period? Again, a correlation with temps would remain, but it would be hard to filter out that signal.
    0 0
  23. To get back to the conclusion of the original post (but perhaps a bit off from the details), we have to decide how fast we are going to make changes (if at all). I view it this way - how far from sustainable do I think our current system is now, and how fast do I think attributes that support a long-term quality of life are declining (i.e. various ecosystem services). The past 200 years have seen tremendous losses of habitat, increases in pollution (notably nutrient pollution and those from fossil fuels), and staggering declines in the ranges and populations of countless species. Almost every graph relating to environmental studies is some sort of "hockey stick" demonstrating extremely rapid declines or increases over the last 200 years (human population correlated with most for good reason). There surely are some holes or gaffes in climate science, just like in any science. Do climate change "skeptics" really side with the opinion that the significant, widespread, and rapid changes that we have made to the global carbon cycle over recent years have no significant impact on our climate? An even if they do, don't they agree all of the other direct and well-understood negatives of fossil fuel use demand a rapid change to clean energy? I hope this isn't viewed as too off topic, it is meant in the same spirit as the final paragraphs of the original post. We have decisions to make for ourselves and future generations, don't we have enough data already to move forward?
    0 0
  24. Poptech @50: What is your evidence that the models are "subjective opinions of the scientists," and not objective measures based on sound data?
    0 0
  25. CoalGeologist, I think we've reached the point where there's nowhere left for the goalposts to be moved. I've provided a link to CRU's software and data. GISS makes all their software and data available here. A number of people have run or re-implemented CRU's software (e.g., here) and Clear Climate Code has precisely duplicated GISS's software. Various other people have published their own open-source software for doing the same thing (e.g., here and here and here). All of those give the same trend (+1.6 or +1.7C/century). It's also the same trend as RSS provides, based on a completely different set of data and methods. So here's my question for Poptech: You wanted the code; now, what are you doing with it? Lots of other people are using the CRU code or GISS code or their own code to do interesting investigations, and in the process demolishing one "skeptic" claim after another. For years, Anthony Watts has skated along by showing photos of weather stations and just asserting that these prove there's a problem with the global surface temperature record. But he never did any quantitative tests to see whether his assertions were justified. Thanks to JohnV and Menne and Tamino and Zeke Hausfather and all the others, it's now clear that pretty much all of Watts's claims were over-promised and under-delivered.
    0 0
  26. Just to be clear, I believe Loehle provided me with the Hadley numbers specifically because they matched the 29 year smoothed averages that his data has. Nothing sinister going on with which data is being presented here. I had originally started to use GISS ten year average, which obviously showed a more recent and higher end point. But my intent was not to try to show HOW much warmer now is than the MWP. I'm saying that everyone's paleo climate model ends up with the same hockey stick blade, but this fight seems to be over the shape of each study's handle. I also received a nice email from Dr. Loehle saying that he thought it was a "good post." He also notes that 18 sets is not enough data (which he alludes to at the end of his paper saying future studies need more and better data to refine what he's done) and that the data are hard to get hold of since many people don't archive. I believe the second issue is one that is beginning to be resolved amongst researchers.
    0 0
  27. Re: Ned @85, Perhaps a new skeptic argument is in order: "Scientists won't release the raw data". If nothing else, it would be great as a compendium of raw data and software sources to expand on what Ned listed.
    0 0
  28. Being a general aviation pilot myself I like Mythago's analogy. But I would refine it slightly. What we are facing is called a "box canyon" hazard in aviation. We're flying into a box canyon below the ridge line. As the canyon narrows we eventually lose the capacity to make a 180 and turn out of the canyon. If we choose to climb, well at high elevations our aircraft has a limited climb rate due to thin air. As we travel forward, if the rate the terrain is rising below us is faster than our aircraft's climb rate we... um, have limited and unpleasant options. To mix metaphors a bit, when I look at the hockey blade (never mind the damn stick) I'm more concerned about the box canyon we're flying into because we are distracted with less important issues (i.e., the MWP).
    0 0
  29. @poptech "oamoe, your comparison is misleading as UAH trends 0.3C cooler." UAH and CRU/GISS uses different base periods. Did you notice that? UAH anomalies refer to 1979-1998 base period and CRU refer to 1961-1990 base period. GISS refer to 1951-1980 base period. In 1979-1998 base period GISS anomaly is equal to +0.24, so real mean difference between GISS and UAH is equal to 0.06.
    0 0
  30. GISS/UAH without offset GISS/UAH with offset
    0 0
  31. pdjakow, it's not clear from Poptech's comment whether "0.3C cooler" referred to an offset of 0.3C or a difference in trends of 0.3C/century. As mentioned in other comments above, all the major global temperature indices show a trend of +1.6C/century except for UAH, whose trend is +1.3C/century -- i.e., 0.3C/century cooler than the rest.
    0 0
  32. Chris G, in #75, #80, and #82 - you're absolutely right, local events such as forest density, drought/flood, which side of a hill the tree is on WRT the sun, etc., are all complicating factors in identifying long term growth rates. Personally I am willing to trust tree ring data for short term (couple of year) periods in terms of relative growth, but long term growth studies require _careful_ consideration of these other factors. Tree ring data is useful; IMO it's one datum that can be weighed into the paleo temperature data. But it's by no means overwhelming due to the potential biases, and if it disagrees with 10 other records I would have to vote for the majority.
    0 0
  33. @Ned Spencer play with his numbers more than GISS guys. Maybe this is real difference.
    0 0
  34. robhon: I don't see why you couldn't use GISS, too, just for overlay. You just won't have data at 1850-1880. Loehle didn't, but if you were going to calibrate/validate the entire reconstruction, then you'd probably use CRU. It gives you more of a time span, to divide into calibration and validation intervals.
    0 0
  35. It may be of interest that Huston McCulloch (the co-author of the corrigendum to the original Loehle article) has provided supplementary informations, containing weighted least squares estimates. In the resulting reconstruction (p. 12), the maximum of the medieval warm period is only slightly warmer (perhaps 0.1°C or so) than the end of the curve (1935). I guess it would not stand out within all those spaghetti curves in Figure 3. Supplementary Information
    0 0
  36. An examination of Figure 2: "Loehle 2008 temperature reconstruction with Hadley instrumental record", shows that our current upward temperature "trend" is displayed between the years 1600 to 1990, a period of about 390 years. The temperature anomoly began at about -5.4 and at 1990 was +6.8, a change of +12.2. Clearly, manmade greenhouse gas emissions were a problem long before the Industrial Revolution. Why do we attribute recent warming to manmade greenhouse gases if the warming trend began nearly 400 years ago? Is there any correlation between the graphed temperature anomolies and CO2 increases during this period?
    0 0
  37. A few points about the top article. 1. Loehle's reconstruction is really an attempt at a selective low resolution Northern hemisphere reconstruction. There are nominally three S. hemisphere sites. However one of these is pretty much on the equator and the other two are somewhat dubious as proxy temperature series for the last 2000 years, especially in addressing the relationships between temperatures now and during the MWP: (a) The South Africa speleothem reconstruction of Holmgren et al (1999). These authors have shown that the del-18O (the normal temperature proxy) record in their stalagmite doesn't correlate with temperature. Instead they tested a phenomenological measure (the "greyness" in the stalagmite bands which they consider may relate to temperature) by comparing this ("greyscale") with temperature during a very short near-contemporary period (1981-1995). This proxy hasn't been independently verified against other late 19th-20th century temperature sets, and while it might be a suitable proxy, the evidence to support this is not that strong. (b) The SE Atlantic sediment record of Farmer et al (2005). The dating of this record is not suitable for a comparison of 20th century and Medieval temperatures. This record covers the entire Holocene and back into the last ice age; it's an excellent record for those long periods. However the latest verified (14C) date is 1053 AD with a 400 year uncertainty at 95% uncertainty. Using it in a temperature reconstruction requires making assumptions about the dating that likely have poor validity. Even if one takes the dating at face value, the sediment indicates that the MWP period was cooler than now. 2. This leads to the second problem. As CBDunkerson [21:50 PM on 6 May, 2010] has pointed out, the inclusion of a couple of rather inappropriate S. hemisphere series into a low resolution N. hemisphere reconstruction does not a global paleoreconstruction make! The weighting is horribly skewed. If one really wanted to attempt a global reconstruction with this data (they shouldn't!), they should increase the weighting the S. hemisphere reconstructions (this will have the effect of reducing the apparent global warmth of the Medieval period). 3. It's obvious that if one is interested in assessing Medieval temperatures compared to now (after all that's what Loehle does, as is explict in his abstract), the contemporary temperature record should be included. Rob accordingly does so in his top post. However, there is no very good reason to smooth the direct temperature measurements. The reason that Loehle applied 29 or 30 year smoothing was to remove short term variability ("noise") and to aid fitting disparate data sets onto a common record. However the measured data is already smoothed and doesn't have any of the noise associated with low resolution data sets in the proxy records. Why misrepresent a perfectly good temperature series? The implication of Loehle's approach is that the more that one reduces information content in paleodata, requiring more energetic smoothing to accommodate noisy and disparate data sets, the more one can truncate the high resolution contemporary temperature data. Incidentally, since the Loehle reconstruction is essentially a very low resolution N. hemisphere reconstruction, it would seem appropriate to compare this to the N. hemisphere temperature record. This is currently around 0.4-0.5 oC above the temperatures of Loehle's reconstruction.
    0 0
  38. Alterna #83 "We have decisions to make for ourselves and future generations, don't we have enough data already to move forward? " IMHO, certainly we do, but you are entering into the social psychology/morals area of the situation. The people who are in positions to make decisions are mostly elected officials. Being good at politics and being good at science are pretty independent; so, there aren't very many elected people in high places who really get the problem. In any case, elected officials don't get re-elected if they do things that upset the majority of voters. The average person has a poor understanding of science and statistics, and a desire not to believe that bad things might happen to them. Risk management is typically not so good either, even if they are told the odds. And, like a commons problem, it's not in any individuals best interest to give up the cheapest apparent energy (Fossil fuel costs are sometimes externalized or hidden). The average person is the majority; so, here we are. I believe the whole point to blog sites like this is to spread the word, or to help others to spread it.
    0 0
  39. @daisym #96... I think you have to remember that Loehle 2008 is only one reconstruction out of a dozen or so. His reconstruction is also based on a few data sets, only two of which are southern hemisphere. So, I wouldn't take his chart as the definitive picture of the past 2000 years. If you read his paper this is about what the picture looks like without treering data. Second, I don't think anyone is claiming that the warming since the LIA was in any way anthropogenic. The concerns are over mostly over the warming since the 1950's. That's just the last rise you see on the chart. And remember the data there ends at 1992 so there's a good chance that spike nearly hits the top of my chart for where we are now. Again, it's pieces like the warming in Loehle's chart from the late 1600's to the late 1800's that gives me pause for concern. That would mean that the climate is extremely sensitive to change with natural mechanisms. If that is true then this suggests that we are in the very early phase of what is going to be a very rapid rise in global temperature. Honestly, I'm hoping that Loehle 2008 is overstating temperature swings and Mann is more accurate, not for any political reason but because Mann's chart would suggest that climate is less sensitive and we still have time to deal with this issue.
    0 0
  40. daisym at 06:09 AM on 7 May, 2010 You're a factor of 10 out in your reading of Figure 2 in the top presentation. The temperature rise from the depths of the LIA to the mid 20th century was in the most extreme N. hemisphere reconstrution around 0.6 oC. Since then we've had another 0.6 oC. So the temperature rise is around 1.2 oC (not 12 oC!). Antropogenic enhancement of greenhouse gas concentrations has made a significant contributing to warming even during the period from the LIA to the mid 20th century, although most of this has accrued since the end of the 18th century. So at the end of the 18th century atmospheric [CO2] was around 280 ppm. By 1940 this had reached around 310 ppm. The rise was pretty much all anthropogenic. Within the mid range of climate sensitivities (around 3 oC of global surface warming per doubling of astmospheric [CO2]), this increase of [CO2] is expected to have contributed around 0.44 oC of warming at equilibrium. Since this occurred over a very long period we can have expected to have got perhaps 0.35-0.4 oC of this by 1950. So a large chunk (likely more than half) of the warming from the bottom of the LIA to mid 20th century was anthropogenic. The rest was likely recovery from the anomalously low solar output during the period of the Maunder minimum and high volcanic activity during the period of the LIA...
    0 0
  41. poptech - "Harries has been challenged". No successfully though. Now lets see you explanation for the observed upper stratospheric cooling. Either way, your statement that attribution to CO2 is purely based on models is demonstrably wrong as the link to John's article shows. Also, bashing what you dont like about CRU when its results are practically the same as GISS is irrelevant to the argument at hand. Loehle provided CRU data but for the purposes of the argument GISS is identical. Your objection to the argument on the basis that the instrumental extension is suspect in baseless. Records that meet your requirements give the same result.
    0 0
  42. Looks like Poptech (57) is pulling an Anthony Watts. Need to adjust the base period when making the comparison. http://www.woodfortrees.org/plot/hadcrut3vgl/from:1979/offset:0.09/trend/plot/gistemp/from:1979/trend/plot/uah/from:1979/offset:0.24/trend/plot/rss/from:1979/offset:0.24/trend Pretty good correlation, but UAH is somewhat of an odd one out. Not a surprise, though. Their 1979-1997 trend once erroneously showed cooling. E&E is a poorly-cited journal that can't be considered "peer-reviewed". It's the rough equivalent to self-publishing on a blog if one has a contrarian view, but that's already been covered.
    0 0
  43. HR - oceans can indeed provide a big sink and ocean dynamics coupled with the external forcings could certainly be part of the MCA. Mann and other's think so. I dont understand what you mean about inferring forcing from temperature? Aerosols and solar - the forcing considered are not inferred from temperature. But to the question of whether ocean dynamics are responsible for 20-21 century warming - note the RATE of warming compared to MCA/LIA variations. This would have to represent a very substantial energy transfer in the system which has somehow eluded detection. This is not the way to bet.
    0 0
  44. 3700+ journals. No E&E http://science.thomsonreuters.com/cgi-bin/jrnlst/jlresults.cgi?PC=K "I'm following my political agenda -- a bit, anyway. But isn't that the right of the editor?" Boehmer-Christiansen - lead E&E editor Also, take a look at the rest of their editorial board. Being "peer-reviewed" by like-minded contrarians admittedly following a political agenda is no better than self-publishing on a blog of like-minded contrarians. Pielke Jr.: "...had we known then how that outlet would evolve beyond 1999 we certainly wouldn't have published there. The journal is not carried in the ISI and thus its papers rarely cited." http://blogs.nature.com/climatefeedback/2007/05/should_hurricanes_be_part_of_t.html#comment-86797 The stuff that ends up in E&E is usually verifiably of poor quality.
    0 0
  45. This RealClimate article ellaborates on the subject of how "high" the bar of E&E's peer review is.
    0 0
  46. In other words...Sonja's putting her foot back in her mouth after revealing her political agenda. "Pielke Jr. is not a skeptic, go ask him." Did I say Pielke Jr. was a skeptic? Do you only find a statement worth reading if stated by a skeptic? Note also the Wigley quote (much of which you left out) puts quotes around the word "credible". You might be mistaking the appearance of credibility with the reality. E&E was set up to create the public appearance of credibility. Since you quoted Wigley, from the same link, we can view Wigley's thoughts on another E&E paper, on a similar topic. "So what is their method? I need to read the paper again carefully to check on this, but it seems that they say the MWE [LIA] was warm [cold] if at a particular site there is a 50+ year period that was warm, wet, dry [cold, dry, wet] somewhere in the interval 800-1300 [1300-1900], where warm/cold, wet, dry are defined relative to the 20th century. The problems with this are ..... (1) Natural internally generated variability alone virtually guarantees that these criteria will be met at every site. (2) As Nev Nicholls pointed out, almost any period would be identified as a MWE or LIA by these criteria -- and, as a corollary, their MWE period could equally well have been identified as a LIA (or vice versa) (3) If the identified warm blips in their MWE were are different times for different locations (as they are) then there would be no global-mean signal. (4) The reason for including precip 'data' at all (let alone both wet and dry periods in both the MWE and LIA) is never stated -- and cannot be justified. [I suspect that if they found a wet period in the MWE, for example, they would search for a dry period in the LIA -- allowing both in both the MWE and LIA seems too stupid to be true.] (5) For the uniqueness of the 20th century, item (1) also applies. So, their methods are silly. They seem also to have ignored the fact that what we are searching is a signal in global-mean temperature." Obviously, if Loehle or Soon's work had gone through an objective peer review, it's more likely the fatal errors would have been discovered (some of which Loehle later admitted to), and a better quality argument would have been presented to the public. How could anyone be against that? But as noted in the emails, the purpose of such junk science is political. I disagree with Rob about assuming Loehle's assertions of journal bias are entirely sincere, although assuming good faith is generally a good idea. If there was not an audience for such assertions, they probably wouldn't be made. There are many dozens of journals where good work can be published. Proclaiming systematic conspiracy in every one of them doesn't fly, and reflects poorly on the person making the accusations. Instead, those conducting shoddy work make these arrogant claims as a way to boost their stature to well beyond what is warranted by the quality of their work. It's rather shameful, in my view.
    0 0
  47. The Soon et al. argument appears to engage in the similar silly logic that co2science.org engages in. Brendan noted this in: http://www.skepticalscience.com/Common-graphical-tricks-and-the-Medieval-Warm-Period.html#12894 "What CO2Science are doing is looking for any warm part in each of localised data, then labelling that as the MWP, regardless of the dates involved." This is why multiproxy studies are necessary. Loehle at least appears to make an attempt to get a genuine hemispheric reconstruction. But as RC also noted in their earlier post: "Update (Jan 22): Loehle has issued a correction that fixes the more obvious dating and data treatment issues, but does not change the inappropriate data selection, or the calibration and validation issues. "
    0 0
  48. Poptech: only some of the most glaring (and easiest to fix) issues mentioned by RC there were addressed in the correction. RC points remaining: Dating - I'm not sure that using centennial-resolution proxies here (like Viau)is at all helpful for this purpose. No matter how they tried to interpolate. That said, I think others have gotten published while using such proxies (Moberg, I think?) Fidelity and calibration of individual proxies: Not assessed by Loehle. He's using the proxies as received, and assuming the original authors took care of worrying about such things. Probably not a deal-breaker for getting published in a normal journal; I don't know. Compositing: This is something of a disaster in Loehle's work, I think. Just taking a simple average of all these disparate things and calling it a global record just isn't justified. No assessment of the spatial distribution at all. This is probably the biggest remaining weakness, beyond the choice of proxies. Validation: Loehle didn't.
    0 0
  49. Look, E&E is a questionable journal with questionable peer review, but just because a paper appears there doesn't mean it's automatically bad. I greatly applaud Loehle for trying. Many sceptics say many things about paleoclimate, but so far as I know, he's the only one to step up and try publishing a reconstruction for himself. McIntyre hasn't. The co2science guys just take papers that mention some period of relative warmth at some spot on earth at some point in time over a period of 600 years, and call it MWP. But unlike them, Loehle has actually tried to put it together. I think his effort (after corrections) still comes up short in some serious ways, but it's a start, and apparently an honest one. As more proxies come available that meet whatever standards he set, maybe he'll revisit, and combine the proxies in a more defensible way (I'm worried about both spatial and temporal), and consider calibration/validation.
    0 0
  50. poptech - Hadcrut methodology is published. The entire dataset is not for well publicized reasons which I am sure you are aware of. Since this is immaterial to the debate, why are continuing to bring it up?
    0 0

Prev  1  2  3  4  Next

You need to be logged in to post a comment. Login via the left margin or if you're new, register here.


The Consensus Project Website

THE ESCALATOR

(free to republish)


© Copyright 2024 John Cook
Home | Translations | About Us | Privacy | Contact Us