


 Arguments


Why is 2016 smashing heat records?
Posted on 30 March 2016 by Guest Author
Yet another global heat record has been beaten. It appears January 2016 - the most abnormally hot month in history, according to Nasa - will be comprehensively trounced once official figures come in for February.
Initial satellite measurements, compiled by Eric Holthaus at Slate, put February’s anomaly from the pre-industrial average between 1.15C and 1.4C. The UN Paris climate agreement struck in December seeks to limit warming to 1.5C if possible.
“Even the lower part of that range is extraordinary,” said Will Steffen, an emeritus professor of climate science at Australian National University and a councillor at Australia’s Climate Council.
It appears that on Wednesday, the northern hemisphere even slipped above the milestone 2C average for the first time in recorded history. This is the arbitrary limit above which scientists believe global temperature rise will be “dangerous”.
The Arctic in particular experienced terrific warmth throughout the winter. Temperatures at the north pole approached 0C in late December – 30C to 35C above average.
Mark Serreze, the director of the US National Snow and Ice Data Centre, described the conditions as “absurd”.
“The heat has been unrelenting over the entire season,” he said. “I’ve been studying Arctic climate for 35 years and have never seen anything like this before”.
All this weirdness follows the record-smashing year of 2015, which was 0.9C above the 20th century average. This beat the previous record warmth of 2014 by 0.16C.
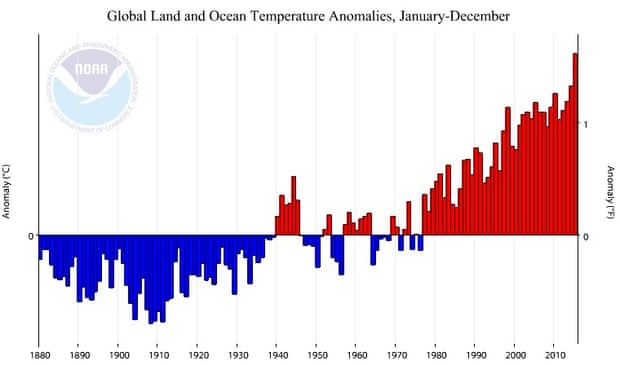
Global land and ocean temperature anomalies, January-December. Photograph: Noaa
These tumbling temperature records are often accompanied in media reports by the caveat that we are experiencing a particularly strong El Niño - perhaps the largest in history. But should El Niño and climate change be given equal billing?
No, according to Professor Michael Mann, the director of Penn State Earth System Science Centre. He said it was possible to look back over the temperature records and assess the impact of an El Niño on global temperatures.
“A number of folks have done this,” he said, “and come to the conclusion it was responsible for less than 0.1C of the anomalous warmth. In other words, we would have set an all-time global temperature record [in 2015] even without any help from El Niño.”
Global surface temperature is the major yardstick used to track how we are changing the climate. It is the average the UN Paris agreement refers to.
But the atmosphere doesn’t stop at the surface. In fact 93% of the extra energy trapped by the greenhouse gases humans have emitted gets sunk into the oceans – just 1% ends up in the atmosphere where temperature is most often and most thoroughly measured. During El Niño, which occurs every three to six years, currents in the Pacific Ocean bring warm water to the surface and heat up the air.
Jeff Knight from the Met Office’s Hadley Centre, said their modelling set the additional heat from a big El Niño, like the current one, at about 0.2C. He said wind patterns in the northern hemisphere had added another 0.1C to recent monthly readings.
“The bottom line is that the contributions of the current El Niño and wind patterns to the very warm conditions globally over the last couple of months are relatively small compared to the anthropogenically driven increase in global temperature since pre-industrial times,” he added.
Steffen said the definitive assessment of this El Niño and its effect on the world’s temperature would only be possible once the event had run its course (it has now peaked and is expected to end in the second quarter of this year). But he agreed that past El Niño cycles could be an appropriate guide for the order of magnitude of the effect.
The picture becomes less clear cut when we talk about monthly records. Even weather trends can have small effects on the monthly average temperature, said Knight. The effect of El Niño traditionally increases as it dies, so Mann believes it may have added more than the “nominal” o.1C during the past three months.
In the Arctic, the effect of El Niño is poorly understood but likely to be weak, said Knight. “Given that the Arctic has been very warm for a number of years, with record low sea ice, it is more likely that the warmth there currently is part of a long-term trend rather than the response to a episodic event like El Niño.”
Steffen says quantifying the relative contributions of El Niño and climate change on a monthly or even annual basis cannot help to answer how fast the world is warming. Only trends over 30 years really matter.
But the pile up of records we have had in the early part of this century are significant. All things being constant, record hot years should occur once every 150 years. Yet 1998, 2005, 2010, 2014 and 2015 have all been record breakers.
A study published in January found that even without last year’s mammoth anomaly such a run was 600 to 130,000 times more likely to have occurred with human interference than without.


The bottom line according to Hansen is that surface temperatures are not necessarily the best indicator!
So what is then? According to Hansen it is the total energy in versus out budget: which includes various unkowns.
So, where do we go from here?
It's risk managament 101 and rather than change billions of dollars of plant the big swingers are going to play pause button politics until they can get the jump on the affirmed data. Oh noes.. what if the new guy starts with a well placed bet!
Divestment wins...
Jim Hansen has said that the best measure of the Earth's energy budget is the heat content of the oceans. That has been measured for about a decade by the Argo 'floats/buoys' project.
See http://skepticalscience.com/Ocean-Warming-has-been-Greatly-Underestimated.html
See http://www.skepticalscience.com/cooling-oceans.htm and
http://www.skepticalscience.com/measuring-ocean-heating-key-to-track-gw.html and
http://www.skepticalscience.com/graphics.php?g=12
Simon,
Is Argo confirming any trends?
According to University of Maine's daily global temperatures on the "Climate Reanalyzer" website, March has definitely blown away February's all-time hottest month in modern Earth history record. Global warming is 93% in the ocean which is why El Nino years are tending to get hotter as the oceans giving back some of that warmth.
There is some evidence that this El Nine might not totally go away but rather make a small comeback after September. This makes is very likely that 2016 will be even warmer than 2015 as projected several months ago by the UK Met. All major global warming gases are at record levels and are still increasing.
Many world governments are still not being honest about their emissions. The IPCC only used a Transient Climate Sensitivity of 1.8C instead of the more scientific estimate of 3.0C+. The Arctic is already starting to release large amounts of methane 70 years ahead of schedule. Arctic sea ice is at a record low and looks very likely to set a record low maximum this year.
We need to do all we can to reduce the scale of the coming catastrophe. It's going to be huge and sooner than you think. Ban new fossil fuel vehicles, new fossil fuel power plants, cattle except in zoos, deforestation for any reason. Pass a global carbon tax of at least $200/ton of CO2 with money returned to the people and to help finance the shift to renewable energy. We are in for a hell of a ride. Billions are certain to die this century.
TomR,
Transient Climate Response is roughly the response to forcing at the present (it's more technical than that*, but this explanation will suffice to make the point). The value is currently around 1.8C as you said.
Equilibrium Climate Sensitivity is the response to forcing after the system has equlibrated to the forcing, which can take several decades. This is the canonical 3C per doubling CO2 you refer to.
Policy makers are interested in short and long term response, which is one reason for the two values. TCR is also a handy metric for testing sensitivity against recent observations (eg, since 1850 or 1900 or more recently). Instrumental record is a little short to test ECS.
* Transient sensitivity is the response of climate system to a doubling of CO2 at the time of doubling, assuming a 1% increase in atmos CO2 concentrations year to year. It ignores feedbacks that will happen after the time the climate system is measured for any change.
Some GCMs are run with a steady starting climate state, and then 2X atmos CO2 is introduced immediately. Model is run to see the change from that large inititating pulse, equilibrating decades later. Equlibrium Climate Sensitivity is deduced from model response after equlibrium is reached. That kind of model can't be used to compare with observations for any given time inside the equilibrating process.
Both sensitivity estimates are useful for different applications.
Tsk, reading that back it's so garbled. I wish I'd been drunk when I wrote it so I'd have some kind of excuse. Now with added clarity...
Transient sensitivity is the response of a modeled climate system to a doubling of CO2 at the time of doubling, with a 1% increase in atmospheric CO2 concentrations year to year. Expressed as the resulting change in global surface temperature, the estimated Transient Climate Response (TCR) value is 1.8 C for a doubling of CO2, at the time of doubling.
Equilibrium Climate Sensitivity is the response to forcing after the system has equlibrated, which can take several decades. A GCM may be be run with a starting climate that is steady, and then the atmospheric CO2 content in the model is doubled instantly. The Equilibrium Climate Sensitivity (ECS) is expressed as the resulting change in surface temperature after the system has equilibrated. This is the canonical 3 C per doubling CO2.
Both sensitivity estimates are useful for different applications. TCR is a more proximate estimate for 'real time' snapshots of climate response to forcing. ECS estimates include the feedbacks that take longer to play out (several decades at least).