Climate Science Glossary

Term Lookup

Enter a term in the search box to find its definition.

Settings

Use the controls in the far right panel to increase or decrease the number of terms automatically displayed (or to completely turn that feature off).

Term Lookup

Settings


All IPCC definitions taken from Climate Change 2007: The Physical Science Basis. Working Group I Contribution to the Fourth Assessment Report of the Intergovernmental Panel on Climate Change, Annex I, Glossary, pp. 941-954. Cambridge University Press.

Home Arguments Software Resources Comments The Consensus Project Translations About Support

Bluesky Facebook LinkedIn Mastodon MeWe

Twitter YouTube RSS Posts RSS Comments Email Subscribe


Climate's changed before
It's the sun
It's not bad
There is no consensus
It's cooling
Models are unreliable
Temp record is unreliable
Animals and plants can adapt
It hasn't warmed since 1998
Antarctica is gaining ice
View All Arguments...


Username
Password
New? Register here
Forgot your password?

Latest Posts

Archives

New temperature reconstruction vindicates ...

Posted on 28 September 2010 by Ned

Guest post by Ned

A new temperature reconstruction has been published in the Swedish journal Geografiska Annaler: Series A, Physical Geography.  The reconstruction (hereafter Ljungqvist 2010) covers the past 2000 years for the middle and high latitudes of the Northern Hemisphere.

This reconstruction includes a number of new proxies that have not been included in previous hemispherical or global temperature reconstructions, and avoids many of the proxies that have been the subject of contention in the past. The results are shown in Figure 1:
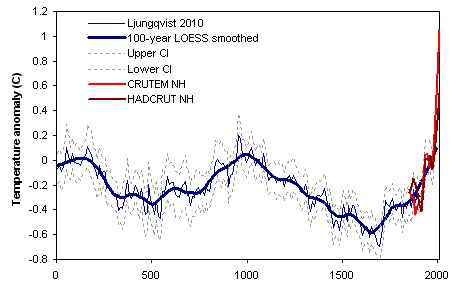
Figure 1.  Extratropical (30-90 N) northern hemisphere temperature reconstruction by Ljungqvist (2010).  Northern hemisphere instrumental temperature records shown for comparison (CRUTEM land only, and HADCRUT land/ocean).

Ljungqvist notes that this reconstruction shows a Roman Warm Period prior to AD 300, followed by a Dark Ages Cold Period (AD 300 to 800), a Medieval Warm Period (AD 800 to 1300), the Little Ice Age (AD 1300 to 1900), and modern warming in the 20th century.  While there has been debate about how "globally consistent" these various warm and cold periods have been, they have long been recognized as prominent features of the extratropical Northern Hemisphere temperature record, so their appearance in Ljungqvist 2010 is not surprising.

Readers may wonder how this new reconstruction compares to previous hemispherical and global temperature reconstructions.  In his conclusion, Ljungqvist (2010) reports that:

"Although partly different data and methods have been used in our reconstruction than in Moberg et al. (2005) and Mann et al. (2008), the result is surprisingly similar. The inclusion of additional records would probably not substantially change the overall picture of the temperature variability."

On the other hand, Craig Loehle claims that Ljungqvist's work vindicates his own previous "global" reconstruction (Loehle and McCulloch 2008, previously discussed elsewhere on this site). Writing on the website Watts Up With That, Loehle claims:

"In this post I demonstrate perhaps a little vindication [...] There is excellent agreement over the past 1100 years [...] My peak temperature occurs about 100 years earlier, but I agree with the new reconstruction [....]  The MWP looks real."

So who's right?  Does Ljungqvist confirm the results of Mann (2008) and Moberg (2005)?  Or do his results agree with Loehle and McCulloch (2008)?  Figure 2 provides a comparison of them all, starting in AD 500 (the earliest date in Mann 2008's global reconstruction), with the northern hemisphere instrumental record shown for comparison.
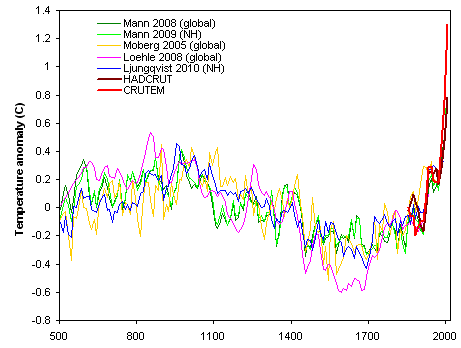
 

Figure 2.  Comparison of northern hemisphere and global temperature reconstructions.  Northern hemisphere instrumental temperature records shown for comparison (CRUTEM land only, and HADCRUT land/ocean).

It's worth noting that all the reconstructions show the Medieval Warm Period, the Little Ice Age, and 20th-century warming (though Loehle 2008 only runs through 1935).  

Loehle's Medieval Warm Period is both warmer and earlier than the rest (and, as noted above, Loehle recognizes that his early peak circa AD 850 is probably incorrect).  Loehle also shows a much colder Little Ice Age.  All of the reconstructions diverge more in the period before AD 800, with Moberg being the coolest, Loehle the warmest, and Mann and Ljungqvist being in the middle of the pack.

When comparing Ljungqvist 2010 to Loehle 2008, it's important to remember that Ljungqvist's reconstruction is for the mid- and high-latitude Northern Hemisphere only, while Loehle's was supposed to be global.  In this light, the presence of relatively extreme temperatures in Loehle's reconstruction during both the Medieval Warm Period and the Little Ice Age ought to be viewed somewhat skeptically.  Whether or not these episodes were truly "global", they were certainly strongest in the Northern Hemisphere, particularly in the North Atlantic region. Ljungqvist 2010 suggests that his own reconstruction may have underestimated the magnitude of Northern Hemisphere cooling during the Little Ice Age, but Loehle's still appears to be an outlier if it is considered as a global reconstruction.

Finally, it's worth noting that comparison to the instrumental record suggests that modern temperatures are significantly warmer than those during the height of the Medieval Warm Period.  Additional projected 21st Century warming will produce a climate unlike anything experienced in the history of human civilization.

Update (29 Sep 2010)

Several people have expressed interest in seeing how the various reconstructions compare to current temperatures (from the instrumental record).  In order to do this, it's important to carefully "center" each reconstruction such that it matches the instrumental record as closely as possible during the period of overlap.

I've taken the three Northern Hemisphere reconstructions (Mann, Moberg, and Ljungqvist) plus Loehle's "global" reconstruction, and carefully matched each one to the same instrumental temperature record (CRUTEM Northern Hemisphere land temperatures).  The results are in Fig. 3:
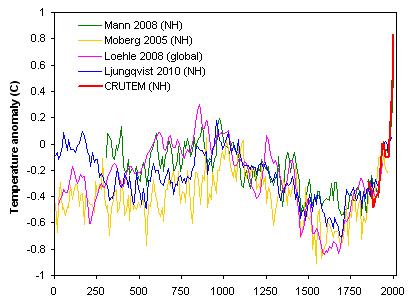
 

Figure 3.  Comparison of temperature reconstructions, re-centered to match CRUTEM NH land record (based on each reconstruction's period of overlap).

Bit of a mess, eh?  To focus on just the Medieval Warm Period and the Little Ice Age, I've pulled out the three warmest decades and three coolest decades in each reconstruction (during the period from AD 500 to 1900).
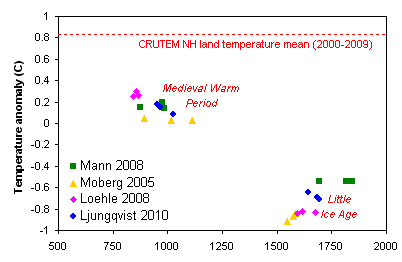
Figure 4.  Warmest decades of the Medieval Warm Period, and coolest decades of the Little Ice Age, after re-centering each reconstruction to match the instrumental temperature record during the period of overlap.

Moberg is a bit on the cool side overall -- which might just mean it was anomalously warm during the calibration period used for centering.  Mann and Ljungqvist agree very closely on the Medieval Warm Period, though Mann's Little Ice Age is not as cold. 

Loehle manages to be both too warm and too early on the Medieval Warm Period and on the cool side during the Little Ice Age.  This difference would not be all that noteworthy, except for the fact that Loehle 2008 is supposed to be a global reconstruction ... and the magnitude of the MWP-LIA difference should almost certainly be smaller for a global reconstruction than for a Northern Hemisphere one.

The other obvious point is that when we compare these to the current instrumental temperature record, the Medieval Warm Period seems to be about 0.7 degrees C cooler than the 2000-2010 mean temperature.  

0 0

Printable Version  |  Link to this page

Comments

Prev  1  2  3  

Comments 101 to 140 out of 140:

  1. @ Ken Lambert, 93 "What does that mean SRJ?? Does it mean no statistically significant warming at all in either time period??" No it means a ten year period is too short a time to see a linear trend in the monthly data - given the size of the trend and the annual variability. To get a statistical significant trend one needs around 14 years of monthly data. See Taminos article "How long". And by the way, the trend for the period 1990-2010 is statistical significant: 0.0206 K/yr +/- 0.0033 K/yr (AR1 corrected) Double the probable error to get 95% confidence interval. "No different from a random walk perhaps??" I think usually when one examines statistical significance of a trend, it is against the alternative of observing that trend in a series of white noise numbers. When using the AR1 corrected probable error, that changes to testing against a series of numbers with a similar AR1 structure. So I guess one could say for 10 years of monthly data we could find as large a trend as I did if we had a series of numbers of the same length with similar AR1. This is off topic for the thread so if you have more questions you need to find an appropiate thread to take the discussion to.
    0 0
  2. Arguments like Ken's always leave me wondering, what's the upshot of X+Y+X+Y... where X and Y are in the same magnitude, X tends to be positive and Y dithers around zero? If I'm interested in knowing the sign of the result in the future, is X more important, or Y?
    0 0
  3. Ken Lambert writes: By definition all the AG forcings were zero in pre-industrial times (set at AD1750 by IPCC AR4). If you plot the AG forcings (heating and cooling) in W/sq.m on the vertical axis and time on the horizontal axis, you will start at (0,0) in AD1750. You're right, the forcing for GHGs in 1750 is 0 ... because we've chosen 1750 as a baseline! It's not because there were no greenhouse gases in the atmosphere in 1750, nor because they were at "equilibrium" in 1750. Likewise, if you choose a baseline of 1750 for solar forcing, then the solar forcing graph will start at 0,0 in 1750. Just like the greenhouse gas forcing graph. Do you really not understand the concept of "baseline", Ken? You are trying to force people to use an imaginary "equilibrium condition of the Earth" as the only acceptable baseline for calculating forcings. But you can't force (pun not intended) the entire scientific world to abide by your idiosyncratic redefinition of terms.
    0 0
  4. Ken #98: "Maybe all those 'scientists' out there who are working on their complex specialties miss the simpler minded basics." I'm afraid I may not be simple minded enough to follow this. "If the Solar forcing curve were to start not at (0,0) but say (0.1W/sq.m, 0) - a slight positive forcing, then the extra area under the curve would be offset positively by 0.1W/sq.m x 260 years x 365 days x 24 hours x 3600 seconds x surface area of Earth; which equals approx 4190E20 Joules." So... you're saying that if there was a 0.1 w/m^2 rounding error in the baseline solar irradiance figure for 1750 then that would act as an ongoing forcing, never reaching radiative equilibrium, for the entire subsequent 260 year period... and thereby explain a large portion of the observed warming? So... from this we should conclude that the MUCH larger radiative forcing from the enhanced greenhouse effect will ALSO continue to accumulate heat, with no slowdown, for at least another 260 years and therefor we can look forward to temperature increases of +6 C or more even without any further fossil fuel emissions.
    0 0
  5. Ken Lambert wrote : "Happy for you to point out the parts of my post #98 which are wrong JMurphy. Where do you want to start?" I see others more capable have already done so. I would like to add the following quote from your post, which is also wrong : Maybe all those 'scientists' out there who are working on their complex specialties miss the simpler minded basics. In fact, I had already pointed that out but you seem to have a blind-spot when your unsubstantiated beliefs are pointed out to you.
    0 0
  6. CBDunkerson makes a good point. Ken's conceptual model of the Earth system would make the climate amazingly sensitive to even a tiny sustained departure from equilibrium. If I understand correctly, he's holding outgoing longwave radiation constant, rather than letting it adjust to changes in atmospheric temperature. An Earth that functioned like that would probably be uninhabitable.
    0 0
  7. In addition to this back-and-forth about climate forcings, earlier in this thread Ken got very interested in the fact that, taking each decade on its own, neither the 1990s nor the 2000s had a statistically significant warming trend. Nor did the 1980s, nor the 1970s. That's right -- if you only look at ten-year periods, none of the past four decades has had statistically significant warming when taken on its own. But over the entire four-decade period, the warming has been very highly significant. The lack of a statistically significant warming trend at decadal time scales does not mean "global warming has stopped", any more than the lack of a statistically significant warming trend at weekly time scales means that "the seasonal cycle has stopped". I've done some simulations, using an underlying quadratic warming trend that matches the past four decades and rises smoothly to a very extreme warming of +6C (above 1970 values) in 2100. I de-trended the last decade's temperature record, and then added it to each future decade, thus giving each decade a similar kind of "noise" superimposed on top of an ever-increasing trend. The first decade where we would see a statistically significant decadal trend is the 2020s. In other words, it's not until 2030 -- nearly halfway through the period of 1970-2100 -- that we would have experienced a decade where there actually was a statistically significant trend within the decade itself. If you use the 1990s as a model for "noise", the 10-year warming trend first becomes significant in the 2010-2019 decade. So we could potentially see this in the 2010s, or it might not be until the 2020s. By the 2030s, pretty much any previous decade's "noise" would show a statistically significant 10-year trend. Thus, even with a strong underlying warming trend, you have to go through the fifth or sixth decade before you are able to detect a statistically significant decadal trend. I think this very nicely disposes of Ken's claims that the non-statistical significance of warming in individual decades is evidence that temperatures have "flattened".
    0 0
  8. There is no point in trying to graft measured temps over the last 100 years to proxies collected over hundreds to thousands of years. The estimated proxy temperatures can't be calibrated with the measured "current" temperatures because none of the measuring points are co-located. None of the proxies are co-located either. We can't even get good solid measurements out of the current measuring network because measurements as little as 5-10km apart can be significantly different. We need much better current data.
    0 0
  9. philc writes: We can't even get good solid measurements out of the current measuring network because measurements as little as 5-10km apart can be significantly different. That doesn't matter, because temperature anomalies are correlated over very large distances (hundreds of km). Nick Stokes showed that you can reconstruct the global temperature trend with as few as 60 stations.
    0 0
  10. @Ken Lambert #98 "If the Solar forcing curve were to start not at (0,0) but say (0.1W/sq.m, 0) - a slight positive forcing" As you appear to want to believe that there was/is more solar forcing than most believe, so that you can attribute some of the observed warming to something else than the inexorable rise in greenhouse gases, then consider that that extra solar forcing added to the expected forcing from increased CO2 plus feedbacks will likely make whatever global warming that's coming to us worse than expected. Do you feel lucky?
    0 0
  11. Ned #108 Regarding statistical significance stuff, this is actually a limitation of the application of central limit theorem to the correlation coefficient. While one can do lots of very interesting things with correlations (with the help of multidimensional geometry, linear algebra, and yes, central limit theorem), by themselves they're a pretty blunt, insensitive instrument and not terribly informative.
    0 0
  12. Ned #104, CBD #105 "You're right, the forcing for GHGs in 1750 is 0 ... because we've chosen 1750 as a baseline! It's not because there were no greenhouse gases in the atmosphere in 1750, nor because they were at "equilibrium" in 1750." Well Ned, if there was zero forcing for GHG's in AD1750, is not the conclusion that the Earth was neither heating or cooling from GHG's? For sure - GHG's are in the AD1750 atmosphere at aro 280ppmv for CO2 etc. but at that long term level the Earth has reached an 'equilibrium'. If there were GHG forcing above or below zero, then the curve for GHG forcings would start at that positive or negative offset above or below the 'equilibrium' baseline. This is unlikely as most of what I have read assumes zero or negligible forcing from GHG in AD1750. Ned #107 CBD #105 NP #111 I am following the methodology of IPCC AR4 Fig 2.4 in looking at each AG radiative forcing. My point is that Solar is not necessarily baselined to zero where the other AG forcings are - and the time integral of these various forcings will sum the total radiative energy applied to the system since AD1750. Climate responses - (1) IR radiative cooling and (2) WV and ice albedo feedback, will have their own curves and the time integral of these will add or subtract energy from the AG and Solar energy applied. At the present (Dr Trenberth's Aug09 paper) these sum to a forcing of minus 0.7W/sq.m (IR: -2.8 and WV & Ice Albedo +2.1). Since the IR cooling is exponential with T^4, this cooling term will rise rapidly so the Earth system will tend to reach an equilibrium as the forcing gap closes. WV and Ice Albedo are not defined by an equation I can find. My point is that since the Earth has warmed a claimed 0.8 degC since 1850, a finite amount of energy has already been absorbed to effect that warming and the proportion of that energy attributable to Solar forcing is underestimated if such forcing was above zero in AD 1750. In that case the energy attributable to CO2GHG forcing must be less, and CO2GHG warming also less than claimed.
    0 0
  13. Ken #113: "Well Ned, if there was zero forcing for GHG's in AD1750, is not the conclusion that the Earth was neither heating or cooling from GHG's?" No. A forcing of zero indicates no CHANGE in temperature... not no temperature. "My point is that since the Earth has warmed a claimed 0.8 degC since 1850, a finite amount of energy has already been absorbed to effect that warming and the proportion of that energy attributable to Solar forcing is underestimated if such forcing was above zero in AD 1750." If we choose the total solar irradiance in 1750 as the baseline then the climate forcing for solar irradiance in 1750 is zero... by definition.
    0 0
  14. Ned #108 We have done this extensively elsewhere - but that 'flattening' wiggle at the end of Albatros' (Post #55)temperature curves for the last 10 years is difficult to ignore. Oh I know that you need 14 years to be 'statistically significant' or whatever, but Jason SLR is also flattening over the last 8 years, and linear temperature trends are probably approximations of a non-linear system in any case. OHC since Argo is certainly not confirming anything but flattening.
    0 0
  15. CBD #114 CBD - "A forcing of zero indicates no CHANGE in temperature... not no temperature." Strictly no CHANGE is energy added or removed. Who is claiming 'no temperature'?? CBD - "If we choose the total solar irradiance in 1750 as the baseline then the climate forcing for solar irradiance in 1750 is zero... by definition." The TSI is AD1750 is not accurately known - so the problem is twofold - what was it then, and what value of TSI was required to get no heating or cooling of the Earth system in the absence of any AG forcings. Or put it this way - if the industrial revolution never happened and the CO2 was still at 280ppmv today with other GHG unchanged - would the Earth have warmed or cooled since AD1750?
    0 0
  16. Ken #116 You'd be better off admitting you got it wrong. If you like you can look at it as an estimated baseline. Still nothing to do with equilibrium. It's a point estimate. By definition the rate of change of a point estimate is zero, because it has precisely 1 dimension. One could run a model to estimate what the climatic response to a constant CO2 concentration since 1750 would be. I would imagine that a reasonable answer would be forthcoming from such a model. You can probably dig around the literature to work out what value that would be if it's of interest to you. However this is still nothing to do with your illogical search for the mythological equilibrium. You have misunderstood how the system is modeled.
    0 0
  17. @KL: "that 'flattening' wiggle at the end of Albatros' (Post #55)temperature curves for the last 10 years is difficult to ignore." That flattening isn't statistically significant. It is not very different from the dip in the mid-80s, or other slight "corrections" of the temp increase (to use a financial term). Cherry-picking time frames in the historical record, one can find many examples of flattening, dips and the like - yet, temperatures have kept going up. About SLRs, it seems you are wrong as well. From the Pew Center on Global Climate Change: "More accurate satellite measurements indicate that global sea level has risen by 1.2 inches over the past decade, about 70% faster than the 20th century average." As far as OHC goes, the Purkey and Johnson study gives a good hint as to where the "missing heat" is hiding (with troubling implications).
    0 0
  18. Hi everyone, The "wiggle" is real, and is just that, a wiggle. Additionally, as has others have quantitatively shown here (and as has Hansen et al. 2010), it is not of statistical significance. The long-term trend remains positive and shows no signs of slowing. Regardless, how did KL fail to notice the other wiggles in the same graphic? What would his conclusion have been concerning AGW had the graph terminated circa 1985 or circa 1995, for example?
    0 0
  19. What would [KL's] conclusion have been concerning AGW had the graph terminated circa 1985 or circa 1995, for example? So many recoveries from which to choose! Every few years, another ray of hope. Truly we live in the best of all possible worlds.
    0 0
  20. KL #115 "We have done this extensively elsewhere - but that 'flattening' wiggle at the end of Albatros' (Post #55)temperature curves for the last 10 years is difficult to ignore." Again you're better off admitting that you've got it wrong. I've dealt with this piece of misinformation that you keep bringing up here and here with a little bit of theoretical background here. Just to be absolutely clear, this shows unambiguously that your claim of flattening has no merit from a scientific perspective.
    0 0
  21. archiesteel #118 kdkd #121 Sea level is flattening with Jason (aro 2.1mm/year): see here for a good graph which agrees with recent data: http://www.skepticalscience.com/Sea-level-rise-the-broader-picture.html BP Post #19 The difference with 1985 is that CO2GHG forcing is reputedly running at 1.7W/sq.m and has been at an increasing level in proportion to the log of CO2 concentration. Is the forcing gap (imbalance) increasing or decreasing? Flattening of Temperature and SLR and OHC would indicate that cooling forcings (IR radiative cooling and Cloud & Direct Albedo) might be closing the gap.
    0 0
  22. KL #122 Presumably you mean one of the graphs presented in this post. Pray tell where you might see a statistically significant change in the rate of sea level change in any of those graphs? Given that I've explained to you how this can be acheived previously (see post #121 for links to the details) and the large effect sizes required to do so in any convincing way, then it should be fairly straightforward for you to determine this once you've located the raw data. However it's pretty easy to see by eyeball that any change in trend over different time periods is not statistically significant. Given this inconvenient truth, you could apologise for wasting our time with this pseudo-scientific subjective by-eyeball approach, and admit that you've been subject to confirmation bias that does not have empirical support.
    0 0
  23. Archisteel #118 "As far as OHC goes, the Purkey and Johnson study gives a good hint as to where the "missing heat" is hiding (with troubling implications)." This is my take on P&J from the 'Billions of Blow-dryers thread which elaborates P & J paper: "Dr Trenberth's TOA imbalance is 0.9W/sq.m of which he can account for about 0.55W/sq.m with wide error bars. Of the 0.35W/sq.m 'missing' the above analysis (0.095) accounts for about 27% - again with wide error bars. A total contribution 0.146mm/yr of SLR is tiny compared with the current trend of 2.1 - 2.5mm/yr." Strangely I am not looking over my shoulder for the P&J missing heat to suddenly king hit the SLR.
    0 0
  24. 9x10^16 Watt-hours here, 9x10^16 Watt-hours there, pretty soon you're talking real SLR.
    0 0
  25. @KL: I'm not particularly interested in your interpretation of the P&J paper. Unless I'm mistaken, they don't claim to have found all of the missing heat, but rather showed heat could be found in such places that are not adequately measured. #122: A "flattening?" You're grasping at straws, here. Even BP agrees that his graphs show a "linear increase." I'm sorry, but your repeated errors and mischaracterizations have pretty much destroyed your credibility on the matter.
    0 0
  26. KL #124 It's extremely frustrating to discuss these matters with you, as you basically ignore the majority of the relevant evidence in order to focus on your preconcevied notion that the so-called sceptic position must be true regardless of the evidence. #122 and #124 are excellent examples of this in action. In particular watch the way that you ignore detailed explanations of why your position is illogical, wrong and based on mischaracterisation of the evidence (see #123 for an example of this). It's a repeating pattern which is why I've been referring to your recent material as 'repetitive rubbish'.
    0 0
  27. archiesteel #126 A reduction in slope of a curve is 'flattening'. Go back and read other threads - the idea that warming might have slowed - 'flattened' is not controversial. BP demonstrated a reduced slope in the SLR curve - almost identical to my 2.0mm/yr number - much reduced from the claimed 3.3mm/year number. It is still a 'linear increase' - but flattened from a steeper slope!! This is very significant when you know how much heat sequestration is involved in a 1mm steric SLR rise. kdkd is heckling from the bleachers because he finds my arguments so threatening to his belief structure.
    0 0
  28. KL #128 "kdkd is heckling from the bleachers because he finds my arguments so threatening to his belief structure." Nope I'm pointing out that your argument is wrong. It's not based on any competent standard of evidence. The more you repeat this nonsense, the clearer it becomes to others that your case is based on the contents of your own confirmation bias rather than anything to do with empirical validity. Go back and look at what it takes to show a statistically significant change in slope over short time periods again. Once you understand this, you'll understand how foolish you've made yourself look by perpetuating this nonsense argument.
    0 0
  29. @KL: "A reduction in slope of a curve is 'flattening'" Especially if you want to suggest that global warming is over, right? It's all in the way one presents things, i.e. glass half-empty vs. glass half-full. The reality is that there have been such reduction of the rate of increase before, and there will continue to be such noise in the complex weather system. What matters are statistically significant trends, and these clearly show a dramatic increase in world temperatures. By the way, you may have missed it, but 2010 is on par to be the hottest year on record. How will you cherry-pick your time periods then? "BP demonstrated a reduced slope in the SLR curve" Barely reduced - not what I'd call a flattening, but then again I'm not pushing an anti-AGW agenda. Overall, the fact remains that sea levels are still rising. "It is still a 'linear increase' - but flattened from a steeper slope!!" "Flattened" suggests no increase, not "increasing less." Of course it doesn't sound as dramatic. "kdkd is heckling from the bleachers because he finds my arguments so threatening to his belief structure." I don't think anyone would ever feel threatened by your arguments. You've demonstrated time and time again how weak those arguments are, and how you ignore valid counter-arguments. From an outsider's point of view, kdkd has a lot more credibility than you on this sugbject. Your use of "belief structure" is also a dead giveaway about your strong bias, which clearly clouds your judgement. Instead of wasting your time exposing your ignorance in these threads, you should honestly try to understand the actual science.
    0 0
  30. Re: Ken Lambert (128)
    "kdkd is heckling from the bleachers because he finds my arguments so threatening to his belief structure."
    Must be a Freudian slip. Surely you meant the word "my" instead of "his". archiesteel, in his closing comments at 130 above, offers some cogent advice worth considering. You are capable of being a valuable resource here, and elsewhere. The Yooper
    0 0
  31. To be fair KL and I have history, and in places other than this one, I have been exceptionally rude to him (and him to me). I won't link to the examples as that would be against the comments policy. Let's just say that "repetitive rubbish" is a more polite version of a particular name which I have called him elsewhere. To Ken's mind my impatience with his repetition is unacceptable. Instead I think he considers that we should accept his argument's validity because he's repeated it so often. It's worth noting that Ken's argument remains unchanged in nearly 18 months, despite a range of people pointing out to him the fatal flaws with his argument with varying degrees of civility.
    0 0
  32. archisteel #130 And I am not really interested in whether or not you are interested in my offerings on these issues. kdkd and I have history elsewhere. Political arguments are not appropriate on this blog, and this is the great value of it. I note archisteel that you are not engaging on the numbers. There is a flattening of SLR, temperatures and probably OHC (although inadequately measured) over the last 10 years. This cannot be ascribed to ENSO, La Nina, PDO, AMO and other circulations and re-distributions of existing heat energy within the Earth system, unless we change our fundamental understanding that these complex circulations are not driven by external forcing imbalance. I have never claimed that CO2GHG do not contribute to increased surface warming by increasing the T1-T2 differential across the atmospheric column. I have claimed that the proportions of AG forcing and Solar forcing are not accurately known and that this is critical to predictions of the 'equilibrium' temperature rise. There is great uncertainty in the WV and ice albedo positive feedback and the cooling effect of cloud albedo. Relatively simple first law thermodynamics and heat transfer analyses can be made to check some of the claims of 'scientists'. Claims like 'hottest year on record' and 'hottest decade on record' are not inconsistent with warming being slowed or flattened or plateauing. If you climb a slope and reach a plateau you will be on the 'highest spot in your particular universe' until you climb down. In fact it will continue to warm until the forcing gap closes and turns negative. Your huffing and puffing will not change the fact that the more accurate measurement has become in recent times - temperature, SLR and OHC by Argo - the flatter the rise in all three.
    0 0
  33. Re: Ken Lambert (133)
    "In fact it will continue to warm until the forcing gap closes and turns negative. Your huffing and puffing will not change the fact that the more accurate measurement has become in recent times - temperature, SLR and OHC by Argo - the flatter the rise in all three."
    In one breath you acknowledge the warming will continue and in the next you point to a not-statistically-significant-and-presumed-significant-because-I-don't-have-any-idea-why quasi-"flattening" of SLR (the short-term nature of which you also point out as being inadequately measured). You do yourself a great disservice by not reading your comments first for logical integrity before posting them. The Yooper
    0 0
  34. I note archisteel that you are not engaging on the numbers. There is a flattening of SLR, temperatures and probably OHC (although inadequately measured) over the last 10 years. Let's make sure we're on the same page here:
    0 0
  35. Yooper #131 Mighty generous of you to suggest: 'You are capable of being a valuable resource here, and elsewhere.' kdkd has made a point of shouting 'bollocks' to just about anything I suggest - because we have a jousting history elsewhere. This is the classic argument by intimidation. He just needs to find a fault in my maths, application of the first law, energy calculations, SLR calculations and a host of other numbers and logical points.
    0 0
  36. In fact it will continue to warm until the forcing gap closes and turns negative. And no-one ever said that warming will continue forever. After all, if we keep incinerating our grandchildren's grandchildren's inheritance those carbon sinks will eventually run out. Then things will change. Just how warm will it get before that turn to the negative? That's what all the concern and the science is about. Everyone knows that we'll have another ice age in a few thousand years' time. Everyone knows that our sun will die and our planet along with it in many millions of years' time. The concern is about life for this and the next half dozen generations of people. Not just life. Do we want to think of people struggling and barely surviving day to day or do we envisage thriving, successful communities? Communities with adequate power supplies and ample food and comfortable shelter and even some carbon fibre technology. Maybe an occasional surfing or skiing holiday for the lucky ones? Science is telling us we need to get our act together to ensure enough variety of carbon resources are left for those who follow us. We've had it easy. We know it will be harder for those who follow, but we have no good reason to make it near impossible for them. And there should be enough to extend our benefits to those who've been unable to share in them so far.
    0 0
  37. DB #135 Have a look at 'Robust Warming of Upper Oceans: http://www.skepticalscience.com/news.php?p=2&t=78&&n=202 BP#6, BP#16, KL#24, BP#30, KL#43 BP#45, BP#72 Conclusion: OHC since full Argo deployment in 2002-3 is pretty flat. Sharp jump prior to 2002 is an artifact of XBT - Argo transition - an offset error.
    0 0
  38. Yooper #134 "You do yourself a great disservice by not reading your comments first for logical integrity before posting them." The point is obvious that warming will continue if there is a forcing gap. If warming is slowing (flattening), then the gap is closing. IR cooling is proportional to T^4 so rises faster than any of the CO2GHG forcings. To keep warming going at the surface you need positive WV feedbacks to rise and add to logarithmic CO2GHG forcing as rapidly as IR cooling so that the insulating (enhanced greenhouse) effect of the atmospheric column keeps increasing the T1-T2 temperature differential.
    0 0
  39. adelady #137 M'lady - if you want all these things as we all do - I suggest you start investing in Geothermal, Nuclear (non-meltdownable of course), Hydro, Solar-thermal and possibly a little wind and PV Solar to warm the cockels.
    0 0
  40. KL writes: He just needs to find a fault in my maths, application of the first law, energy calculations, SLR calculations and a host of other numbers and logical points. Come on, Ken. The problems with this comment have been pointed out again and again. Specifically, you write If the Solar forcing curve were to start not at (0,0) but say (0.1W/sq.m, 0) - a slight positive forcing, then the extra area under the curve would be offset positively by 0.1W/sq.m x 260 years x 365 days x 24 hours x 3600 seconds x surface area of Earth; which equals approx 4190E20 Joules. Your idea here is that there is some unique "equilibrium" solar irradiance, such that any excursion from this value would lead to the Earth accumulating (or shedding) heat continuously at a rate linearly proportional to the magnitude of this excursion. With this model, a slight increase or decrease in TSI would (if sustained long enough) either heat the oceans to boiling, or freeze them solid. Fortunately, the real world doesn't do this. Instead, a small positive solar forcing would lead to an increase in temperature, which in turn leads to an increase in outgoing longwave radiation. At that point, the Earth and Sun are in a new equilibrium, with outgoing and incoming radiation balanced (and a slightly higher temperature for the Earth). At that point, the Earth stops accumulating joules ... unlike in Ken-world, where the unfortunate planet apparently keeps heating up forever. You seem to recognize the existence of the outgoing longwave radiation negative feedback when it comes to CO2 forcings. But your earlier comment includes no such effect for a solar forcing. Perhaps the earlier comment was just a youthful indiscretion? If so, it would help clear things up if you'd just retract it.
    0 0
  41. I already have domestic solar but that's not the issue. The issue is large scale investment in such things, not small isolated individual investment. Even if governments just withheld the $500 billion a year going into antiquated FF industry pockets, that'd be a good start. And I'm not very keen on too much money going into power plants that need cooling water. Too many nuclear and coal plants are already having shutdowns at crucial times for lack of suitable, or any, water. Until we see good 20 year evidence of continual, reliable, non-flooding river flows at potential power plant sites I think nuclear's not a good option. Any generation.
    0 0
  42. Blithe spirits assume that XBT-Argo transition artifacts explain the steep slope in OHC ca ~2002-2004 and that axiomatically this must indicate the heat content caught by the span of the measurements does not exist. This seems to presuppose that XBT was more accurate than Argo as a means of measuring OHC. There are a number of problems with that assumption beyond the simple issue of XBTs being an inferior means of measuring OHC. Most of all, the discontinuity is not found by oceanographers to represent a spurious measurement of OHC not in existence, rather to the extent the temporal change in slope is an error, it appears to signal a defect in our ability prior to Argo to assess OHC. Focusing on the discontinuity is not an argument that OHC is declining, rather it calls attention to an improvement in our ability to measure heat as well as an actual addition to the inventory of heat identified. People whose business it is to know of these things say: The XBT was designed primarily to estimate ocean sound speed for submarine warfare. As XBT data began to be used for more sensitive climate research of the sort discussed here, partly correctable temporal and spatial biases in both XBT temperature and XBT depth were discovered ( Lyman et al ) Not surprisingly, the addition of a new source of OHC data not only was an improvement in accuracy of measurements, it allowed us an independent means of validating measurements from XBT data and thus allowed oceanographers a way to begin fixing problems with XBT data. This has been the topic of fairly intensive effort: In Situ Data Biases and Recent Ocean Heat Content Variability* Identifying and estimating biases between XBT and Argo observations using satellite altimetry Changing Expendable Bathythermograph Fall Rates and Their Impact on Estimates of Thermosteric Sea Level Rise (skeptics should pay close attention to this one) Etc. Regarding Argo, experts as opposed to blog commenters say: The flattening of OHCA curves also occurs around the time (2004) that the Argo array of autonomous profiling floats first achieved near global coverage and became the primary source of OHCA data. The Argo array affords year-round sampling of the temperature and salinity of the ice-free oceans over the 0–2,000-m layer, with a nominal separation of 3u in latitude and longitude.The transition from an ocean temperature record consisting primarily of ship-based XBT data to one dominated by high-quality conductivity–temperature–depth (CTD) instrument data from Argo floats occurred between roughly 2000 and 20059, and marked a revolution in ocean observing. ( Lyman et al ) What's notably absent from that expert commentary on the XBT-Argo transition is any mention of concern about a false assessment of total OHC introduced by the XBT-Argo transition. That is to say, oceanographers are not concerned that the discontinuous jump visible in graphs of OHC is a false addition to our measurement of OHC; the heat content visible at the right end of the graph above is real. It's pretty funny that "skeptics" love to point out this "offset error" when in fact it reinforces the case for a warming ocean.
    0 0
  43. @KL: "And I am not really interested in whether or not you are interested in my offerings on these issues." Sure you are, otherwise you wouldn't have answered. "I note archisteel that you are not engaging on the numbers." I don't need to, others have done it for me, and very convincingly might I add. "There is a flattening of SLR, temperatures and probably OHC (although inadequately measured) over the last 10 years." 10 years is not long enough to make a statistically-significant slope, therefore your argument is invalid. I could just as well argue that the last three years show a dramatically increased warming slope... "This cannot be ascribed to ENSO, La Nina, PDO, AMO and other circulations and re-distributions of existing heat energy within the Earth system" Actually, we can. The PDO entered a cold phase right about that time, and reduced the warming (which continue to rise). "I have never claimed that CO2GHG do not contribute to increased surface warming by increasing the T1-T2 differential across the atmospheric column." You like to wrap your posts in jargon to give yourself more credibility, but the fact of the matter is that someone who understands the science well can also explain it clearly for others. Recourse to highly technical jargon in a layman's discussion usually indicates a desire to obfuscate. "I have claimed that the proportions of AG forcing and Solar forcing are not accurately known and that this is critical to predictions of the 'equilibrium' temperature rise." What's the "equilibrium temperature rise," exactly? "There is great uncertainty in the WV and ice albedo positive feedback and the cooling effect of cloud albedo." There is uncertainty in everything, that's quite a meaningless statement. Get to the point. "Relatively simple first law thermodynamics and heat transfer analyses can be made to check some of the claims of 'scientists'." Scientists in quotes? Right, they're all either idiots or conspirators in your world view, right? I believe conspiracy theories falls into the "Political comment" zone. "Claims like 'hottest year on record' and 'hottest decade on record' are not inconsistent with warming being slowed or flattened or plateauing." ...just as a temporary slowdown or plateau is not inconsistent with warming - especially since the slowdown has all but ended in the past couple of years. "If you climb a slope and reach a plateau you will be on the 'highest spot in your particular universe' until you climb down." That is completely irrelevant. If you're climbing a mountain you get to see whether or not the slope continues ahead of you. Here, you *don't* know if the warming trend will increase or decrease, even though you seem certain it's the later (betraying the bias that clouds your judgement). The fact of the matter is that the *only* indications we current have is that the warming appears to have resumed with a vengeance. "Your huffing and puffing will not change the fact that the more accurate measurement has become in recent times - temperature, SLR and OHC by Argo - the flatter the rise in all three." ...only if *you* get to cherry-pick the time frame, which you have consistently done in these threads. Oh, and I'm not "huffing and puffing." Just like you seem to have a false idea of the current warming trend, you have no idea of my state of mind, and attempts at suggesting I'm being emotional is just another rhetorical trick of the trade. Fortunately, Daniel, Adelady, Ned and Doug have done an excellent job of demolishing your arguments, and I note you haven't been able to come up with convincing counter-arguments to challenge their rebuttal. Don't go "huffing and puffing," now!
    0 0
  44. Hi Ken and the group, Ken, it is not just kdkd who has an issue with your repeated misguided claims made here. Pretty much everyone has patiently and politely shown the err of your ways and misunderstanding of the science and data. Please don't deny that, the evidence is here for everyone to read. In fact, given the circumstances, I'm surprised just how polite and patient most people have been with you. It boils down to this: AGW is not going to manifest itself as a monotonic increase in global temperature (or SL or OHC). The climate system is quite noisy with variability increasing as the time scale decreases from inter-decadal to inter-annual, to intra-annual. That is why climate scientists are required to look at long term trends (20 years plus) to extract statistically significant trends/signals from the noise. Now I am at al loss to explain why you stubbornly refusing to accept that well-established fact. Perhaps it is because you are not familiar enough with the science to grasp these elementary, yet critical concepts? I just don't understand. What I do understand is that your presence on these thread is becoming increasingly disruptive, redundant (i.e., repeating the same fallacious claim) and as such is not conducive to constructive debate. Anyhow, in an effort to get back on topic-- this thread is about paleo reconstructions. May I humbly suggest we take this debate about OHC to the appropriate thread-- not that the misunderstanding surrounding the OHC data have not already been discussed ad nauseum there.
    0 0
    Moderator Response: Excellent point about staying on-topic. As it's largely dedicated to resolving errors versus variability, probably the best place to take further discussion of OHC measurements themselves is the Robust warming of the global upper ocean thread.
  45. @KL: Consider the two following graphs. The first shows the UAH series from January 1979, with trends (to the present day) from that date as well as from 1990, 2000, 2005 and 2007: What we see is an increasing of the slope in the 1990-present day series (blue), a slight decrease in the 2000-present day series (purple - note it is still higher than the 1979-present day trend), a 2005-present day trend that is nearly identical to the overall trends (cyan), and a dramatic increase in the 2007-present day trend (reddish-brown, if my eyes don't deceive me). Now let's look at PDO trends for the same period of time (for clarity's sake I have the data and overall trend start in 1975 - the trend from 1979 overlaps almost perfectly with the 1990 and 2000 ones, making them harder to see): Here we seem to have an overall negative trend in green (who should thus influence temperatures negatively, but clearly not enough to counter the warming). We then have dip in the 1990-present day trend (blue), a further (very slight) decrease in the 2000-present day trend (purple), a strong decrease in the 2005-present trend (cyan) and a moderate upswing in the 2007-present day trend (reddish-brown). Now, I know that shorter trends are not statistically significant, but it does seem as if the very slight slowdowns in the overall warming trend have been affected by the cooling effect of the PDO, though not enough to cancel the overall warming. Given this, how can you argue a) that the warming is showing enough signs of slowing down to warrant predictions of continuing "flattening", and b) that the slowing down was *not* due to the cooling effect of the PDO? To the moderator: I am terribly sorry if this has veered off-topic. If there is a better place to post this rebuttal, please indicate it to me and I'll move it there. I'd ask that you not delete it before I move it, however, as I took some time in carefully (and patiently) responding to Ken's erroneous argument. Also note that Ken argued it's not the PDO, so it doesn't really fit in the "It's the PDO" thread... :-/
    0 0
  46. KL #133 Just to clarify: if you come up with something that has good validity with sound logic and empirical support then I'm happy to accept your argument. However the two main arguments that you repeat constantly are both fatally flawed with poor logic, lack of empirical support and confirmation bias. Yet another example of confirmation bias is that you take my statements on the empirical validity of your work and make the assumption that there's some non-empirical reason that I find your argument lacking. Anyway, as others have said, I'm not sure where this stuff is on-topic where it hasn't already been done to death.
    0 0
  47. Yooper, Ned, Archisteel, Adelady, kdkd et al: It must be bash Ken-world week. Clearly if you visited my posts on other threads - you all might glean that I have some reasonable understanding of the numbers and state of climate play. This is what I said to Yooper on 20SEP: http://www.skepticalscience.com/news.php?p=2&t=56&&n=374#comments Comment #63 "The critical measurement is the TOA imbalance which nets all the heating and cooling forcings. Ref Fig 2.4 of AR4 which gives a total net anthropogenic forcing of +1.6W/sq.m. To this number is then added the climate responses which mainly consist of radiative cooling (from a raised Earth temperature of 0.75 degC as per S-B) of about -2.8W/sq.m and WV and Ice Albedo Feedback of about +2.1 W/sq.m. (Ref Dr Trenberth Fig 4 'Tracking the Earth's global energy) The sum is then +1.6 -2.8 +2.1 = +0.9W/sq.m All the heating and cooling forcings are acting in concert. S-B is emitting IR, Aerosols and clouds are reflecting incoming Solar heat, while CO2GHG are supposedly trapping Solar heat at lower levels (the mechanism is more correctly slowing down the transfer rather than 'trapping' heat) which tends to raise the equilibrium temperature as the analogy of a better insulator increases the T1-T2 temperature difference for a given heat flux transferred. What is certain is that CO2GHG forcing (currently claimed at about 1.6W/sq.m) is logarithmic with CO2 concentration, and S-B radiative cooling is exponential (proportional to T^4). Where these forcings and the others cross is where the forcing imbalance is zeroed and the new equilibrium temperature approached. The CO2GHG theory hangs on the interaction of WV and CO2 in the atmosphere and what will be the surface temperature rise for a unit rise in the IR emitting temperature of the Earth as seen from space." end quote What Ned and archiesteel are trying to claim is that I don't understand climate responses to the AG radiative forcings. The point I am making about Solar forcing and energy over time is that the components of the Radiative forcing (Fig 2.4 IPCC AR4) are separated for analysis and quantification, but they are the INSTANTANEOUS energy flux (power) forcings in W/sq.m circa AD2005. There is a history over time for these forcings going back to the pre-industrial 'zero' date of AD1750. There will be a curve for each and the area under that curve represents the total energy contributed by each. Simultaneously there are the climate response forcings which also have their curves going back wrt time ie: "which mainly consist of radiative cooling (from a raised Earth temperature of 0.75 degC as per S-B) of about -2.8W/sq.m and WV and Ice Albedo Feedback of about +2.1 W/sq.m. (Ref Dr Trenberth Fig 4 'Tracking the Earth's global energy)" Again these are AD2005 numbers for the instantaneous value of the response forcings. Summing ALL the curves should give a combined effect of a composite curve over time, the area under which represents the total of the energy absorbed or lost to the earth system at any point in time since AD1750. Temperature (with appropriate lags) should in theory follow this time integral. Now, where Ned does not 'get it' is that when looking at the Solar forcing COMPONENT of the +1.6W/sq.m of net AG forcings, my contention is that this is underestimated if the Solar forcing of the Earth was not 'zero' in 1750, because all the other AG forcings were 'zero' as far as we know. If CO2GHG forcing was not zero in 1750, the same argument would apply to its area under the forcing curve. It would also be underestimated. If you disagree with the methodology of looking at each COMPONENT AG radiative and Solar forcing and then summing them (and their time history curves), because they in reality all acted in concert together with climate response forcings to produce the net result; then you must disagree with the IPCC method and that of Hansen, Dr Trenberth et al, who explicitly use this method to separate out the components. Without this separation - no theroetical analysis of the relative value of each AG forcing could have been made and all we would know is that the current TOA imbalance (CERES April 2010) is +6.4W/sq.m which would indeed cause us all to fry in hell. A correction back to 0.9W/sq.m would be impossible without the theroetical analysis of the components and their apparent magnitudes.
    0 0
  48. All the Ken-world viewers note this on significance periods: 14 years is better that 10 years is better than 8 years is better than 5 years and 1-2 years is not much good at all.
    0 0
  49. Ken Lambert - I would strongly recommend taking this discussion, and your unsupported theory of unmeasured solar forcing, to the "It's the sun" thread, where it's appropriate. I have placed a reply on that thread.
    0 0
    Moderator Response: Thank you.
  50. @KL (149): then you agree the "flattening" was simply a temporary reduction likely caused by the PDO's cooling effect? "What Ned and archiesteel are trying to claim is that I don't understand climate responses to the AG radiative forcings." It would be hard to tell if you understand it or not since you seem to make a point of posting confusing (and confused) arguments. Of course the forcings (including solar) were not at "zero" in 1750 - the sun was shining, wasn't it? Similarly, there was already CO2 and CH4 in the atmosphere, so the GHG forcing wasn't zero either - but that completely misses the point. The *increase* or *decrease* in the forcings is what counts.
    0 0
    Moderator Response: Please follow KR's excellent example and move all further discussion of whether or not solar irradiance forcing is responsible for modern warming to the thread on Solar activity & climate: is the sun causing global warming?. Thanks.

Prev  1  2  3  

You need to be logged in to post a comment. Login via the left margin or if you're new, register here.


The Consensus Project Website

THE ESCALATOR

(free to republish)


© Copyright 2024 John Cook
Home | Translations | About Us | Privacy | Contact Us