Climate Science Glossary

Term Lookup

Enter a term in the search box to find its definition.

Settings

Use the controls in the far right panel to increase or decrease the number of terms automatically displayed (or to completely turn that feature off).

Term Lookup

Settings


All IPCC definitions taken from Climate Change 2007: The Physical Science Basis. Working Group I Contribution to the Fourth Assessment Report of the Intergovernmental Panel on Climate Change, Annex I, Glossary, pp. 941-954. Cambridge University Press.

Home Arguments Software Resources Comments The Consensus Project Translations About Support

Bluesky Facebook LinkedIn Mastodon MeWe

Twitter YouTube RSS Posts RSS Comments Email Subscribe


Climate's changed before
It's the sun
It's not bad
There is no consensus
It's cooling
Models are unreliable
Temp record is unreliable
Animals and plants can adapt
It hasn't warmed since 1998
Antarctica is gaining ice
View All Arguments...


Username
Password
New? Register here
Forgot your password?

Latest Posts

Archives

Do critics of the hockey stick realise what they're arguing for?

Posted on 19 October 2010 by John Cook

The hockey stick, a reconstruction of temperature over the last 1000 or so years, is a much maligned graph. Critics of the hockey stick insist it underestimates past climate change. In particular, many insist that temperatures during the Medieval Warm Period were warmer than now. The next logical leap is that if past natural climate change is comparable to today, then current climate change must also also natural. The irony of this line of thinking is that if the Medieval Warm Period did turn out to be much warmer than currently thought, this doesn't prove that humans aren't causing global warming. On the contrary, it would mean the danger from man-made global warming is greater than expected.
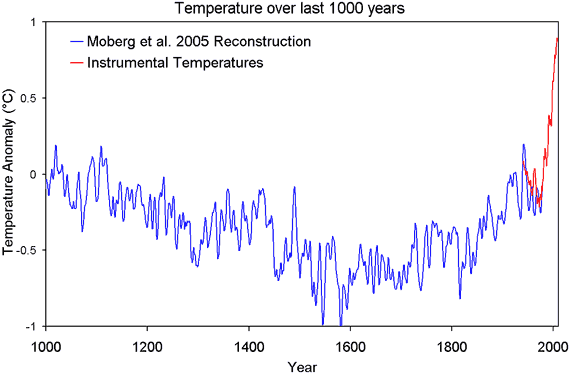

Figure 1: Northern hemisphere temperature reconstruction from Moberg et al 2005 plus instrumental measurements of northern hemisphere land temperature (CRUTemp).

To understand this, you first need to grasp the fact that climate doesn't change by magic. It changes when it's forced to change. When our planet suffers an energy imbalance (eg - the energy imbalance caused by rising CO2), it gains or loses heat. This change in heat is known as a radiative forcing or climate forcing. When our climate experiences a forcing, global temperature changes.

So to understand climate change over the last 1000 years, you need to look at the climate forcing over that time. The overall or net climate forcing is the combined effect of the drivers of climate over this time frame: mainly solar variations, changes in carbon dioxide, volcanic eruptions and aerosols:
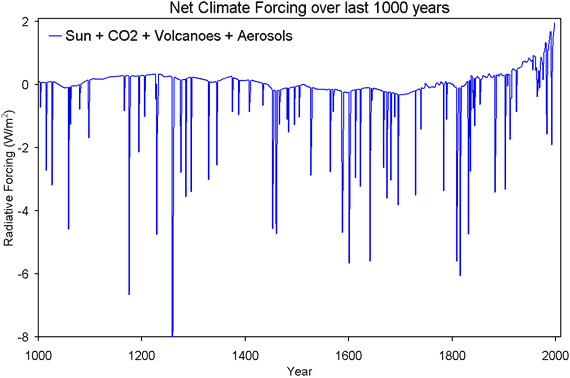
Figure 2: The combined radiative forcing from solar variations, CO2, volcanoes and aerosols (Crowley 2000).

The dramatic spikes are the strong negative forcing from volcanic eruptions. To gain some visual clarity, Figure 3 shows net climate forcing without volcanic eruptions. This gives us a good approximation of net climate forcing as volcanoes for the most part only affect climate for a few years before the sulfate aerosols from the eruption are washed out of the atmosphere.
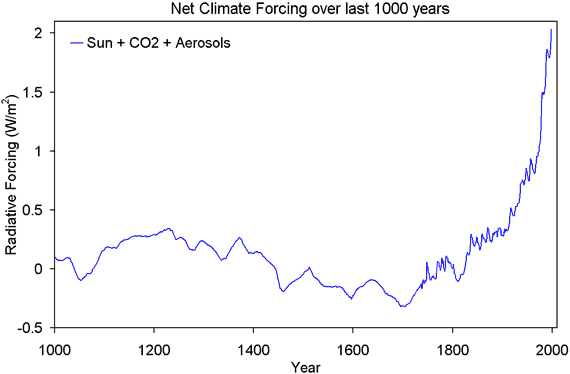
Figure 3: The combined radiative forcing from solar variations, CO2 and aerosols - volcanoes are omitted (Crowley 2000).

The reason we see a hockey stick shape in temperature is because the climate forcing that drives temperature also shows a hockey stick shape. But from this data, we can do a lot more than compare shapes. We can calculate how much global temperature should change when it's subjected to a climate forcing. This information is crucial in enabling us to predict how climate will act in future decades in response to rising greenhouse gases.

The temperature response to a climate forcing is known as climate sensitivity. Technically, climate sensitivity is defined as the change in global temperature if the planet experiences a climate forcing of 3.7 Watts/m2 (which is how much climate forcing you get from a doubling of CO2). The amount of positive feedback in our climate system determines how sensitive our climate is. If there's net negative feedback, the climate sensitivity will be less than 1.2°C. If climate sensitivity is greater than 1.2°C, our planet has net positive feedback. Climate sensitivity can be calculated by using temperature change over the past 750 years along with the change in radiative forcing (Hegerl et al 2006). Doing this yields the following result:
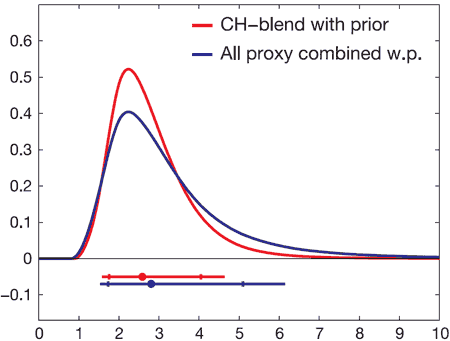

Figure 3: Climate sensitivity from palaeoreconstructions going back 750 years, combined with climate sensitivity calculated from instrumental records. The horizontal bars represent the 5 to 95% range, indicating a climate sensitivity range of 1.5C to 6.2C (Hegerl et al 2006).

When you combine the temperature record over the past millennium with climate forcings, you get a climate sensitivity around 3°C. In other words, net positive feedback. This is consistent with the IPCC climate sensitivity range of 2°C to 4.5°C. Positive feedback is the reason why we expect to see strong warming over the next century in response to the climate forcing from rising CO2.

Can you now see the irony in insisting on a warmer Medieval Warm Period? If for some reason, temperatures over the Medieval Warm Period turn out to be warmer than previously thought, this means climate sensitivity is actually greater than 3°C. The climate response to CO2 forcing will be even greater than expected. So to argue for a warmer Medieval Warm Period is to argue for greater climate sensitivity and greater future warming due to human CO2 emissions.

UPDATE 21 Oct 2010: I've corrected the labelling of Figure 1 from "instrumental temperature measurements of northern hemisphere (HadCRUT)" to "instrumental measurements of northern hemisphere land temperature (CRUTemp)" to clarify that the instrumental data is land temperature, not land and ocean (as the Moberg data is also land only).

0 0

Printable Version  |  Link to this page

Comments

1  2  Next

Comments 1 to 50 out of 84:

  1. It may be of some interest to quote the conclusion of Moberg et al. (2005), whose graph You reproduce: ”We find no evidence for any earlier periods in the last two millennia with warmer conditions than the post-1990 period—in agreement with previous similar studies. The main implication of our study, however, is that natural multicentennial climate variability may be larger than commonly thought, and that much of this variability could result from a response to natural changes in radiative forcings. This does not imply that the global warming in the last few decades has been caused by natural forcing factors alone, as model experiments that use natural-only forcings fail to reproduce this warming. Nevertheless, our findings underscore a need to improve scenarios for future climate change by also including forced natural variability—which could either amplify or attenuate anthropogenic climate change significantly.”
    0 0
  2. Whoa John, you might want to further add that the MWP was local to the northern hemisphere and had little to do with global climate forcing. While as a thought exercise it is an interesting idea that an increased Global MWP would infer greater climate sensitivity, you wouldn't want to inadvertently confuse people about the actual relationship to a Local MWP.
    0 0
  3. I don't think the so-called skeptics are actually bothered about any of this because they hold those two propositions in totally separate compartments in their heads. I.E. the MWP was warmer than today, because, well, just because. That's what they are being told by their blog scientists and that is what they believe. Separate from that, climate sensitivity is lower (almost zero, in fact) because Lindzen says it is, and they believe him above all other scientists. To a so-called skeptic, the above can be held and believed at the same time without contradiction - well, to them, at least.
    0 0
  4. Excellent piece with a clear enough message, I think, even if the explanation behind it is (inevitably) complex. I don't know the answer to this, but if the MWP really was longer and warmer than the climate today, shouldn't it have seen a significantly larger rise in sea level than ours to date? Are there any reliable measures of sea level back then? (Anecdotally, I note that Venice was mainly built between the 12th and 15th Centuries, at sea level. No evidence that it was sitting high in the water during the subsequent little ice age, when Canaletto was endlessly painting it!)
    0 0
  5. John, this is a really clear and well-written post. Just the kind of thing that SkS is known for. Nice work. Philip64's point is a good one. With the MWP being a long, slow rise rather than the steep increase in temperatures from AGW, more of the slow responding components of the climate system should have had time to adjust. That means sea levels, alpine glaciers, alpine/arctic tree lines, etc.
    0 0
  6. Always assuming that you believe anthropogenic climate change as originating *overwhelmingly* with CO2. If some of the uncertainties acknowledged in at least one authoritative source are taken seriously, the picture may be somewhat more complicated and hence close scrutiny of the palaeoclimate record and climate sensitivity and its sources may still be warranted. CO2 is *very* important but it may not be the whole story. I do not buy arguments that suggest that a robust MWP would justify 'business as usual' on an indefinite basis. However, ”The last temptation is the greatest treason/ To do the right deed for the wrong reason.” Pedantry aside, doing the right deed for the wrong reason may cause us to overlook vital elements in planning for an uneratin future. Philip64 @ 4: Interesting that you mention Venice, which has been subsiding because of exploitation of aquifers. Tidal factors seem to be of lesser signhifcance than is commonly supposed.
    0 0
  7. John Cook "Technically, climate sensitivity is defined as the change in global temperature if the planet experiences a climate forcing of 3.7 Watts/m2" Should'nt sensitivity be related in some way to units of time? If something responds slowly, it is described as being less sensitive. If something responds faster, more sensitive, etc.
    0 0
  8. chriscanaris, I'm afraid I'm not following you. The IPCC AR4 section you link to doesn't seem to suggest that CO2 is not the driver of anthropogenic climate change. It merely states the probable range of uncertainty around the best estimate for climate sensitivity, and lists some of the major feedbacks that contribute to climate sensitivity. CO2 is the largest anthropogenic forcing, unless you have something to suggest that everybody's been missing: Anthropogenic and natural radiative forcings (IPCC AR4 Section 2.1) The feedbacks mentioned in the IPCC text you link to are not independent actors. They are in fact the mechanism by which the forcings (shown in John Cook's figs 2 and 3 above) translate into temperatures (shown in JC's fig 1). The point of this thread is that we know pretty well what the forcings have been for the past millennium. If it turned out that the amplitude of the MWP-LIA difference was larger than expected, that would necessarily imply that climate sensitivity is also larger than expected. Nothing in the IPCC section that you cite contradicts this (or even particularly relates to it).
    0 0
  9. RSVP writes: Should'nt sensitivity be related in some way to units of time? Yes, it is, in that ultimately climate sensitivity is the product of all feedbacks each of which has its own time scale. Some are very fast (water vapor), some intermediate (carbon cycle) and some are slower (ice albedo and tundra-taiga albedo). Often CS is referred to in terms of its equilibrium value once all of these feedbacks have taken effect. But the time evolution of global mean temperature from T0 to Teq will be nonlinear.
    0 0
  10. Lars #1 This does not change the sensitivity argument from John's post. If the MWP was even warmer (as "skeptics" like to believe), that means the climate is even more sensitive to those rather mild forcings that occurred then. And this means climate would be more sensitive than expected to those CO2 W/m2 as well. Moberg points out (as far as I understand it) that natural forcings and natural variability seem to be more present than previously thought, and therefore projections should account for them too - as far as we can predict them, of course. But again, this does not change the sensitivy to CO2.
    0 0
  11. John, Roy Spencer in his recent post about the recent Lacis paper has suggested that the past variation in temperature could, in part, be driven by internal mechanisms. for example cyclical changes in the oceans could have an affect on the hydrological cycle and cryosphere thus affecting albedo. This would make the whole process of trying to calculate sensitivity from past climate flawed. It seems like a difficult one to disprove. Also generally on the overall idea you show here, does your analysis depend on the idea that feedbacks are roughly similar depending on the different forcing. Are you saying that if the relatively small changes in TSI have larger affects on surface temperature then this means that doubling Co2 will also have a similar larger affect? The changes in solar irradiance have a complicated affect on different parts of the climate system, take for example the stratospheric effects from UV in the discussion about the Haigh paper and all the possible knock on effects that has. This will be totally absent in forcing from CO2. How can you confidently say that because you deduce great climate sensitivity from solar variance means greater sensitivity from CO2? The same could be said for forcing from volcanos superficially they seem the same by changing the net energy budget but they do it in very different ways that will lead to very different feedback mechanisms. Finally there also seems to be something missing if we accept that solar variance has had a greater effect in pre-industrial times. It must also mean that solar is having a greater affect in industrial times, unless you think solar variance has switched itself off for the past 100years. It must mean that solar is implicated in some of the cyclical features of the 20th century temperature record. The idea that the 1940-1970 'cooling' and recent warming are all about aerosols and CO2 respectively seems flawed. If as Moberg and other say that natural processes can change temp by up to 0.7oC in 5-600years then what's to say some (or much) of the 0.8oC from the past 1500years isn't natural? There seem to be more implications from greater natural variability in the past 1000 years than the one you present (climate sensitivity). (small point Hergel et al is 2006 not 2000)
    0 0
  12. RSVP, just as an exercise, look up the definition of the Watt as a unit of power, eh? Once you've got the notion of a Watt under your belt, you can then begin relating it to mass, specific heat, conversion into sensible versus latent heat, etc.
    0 0
  13. ...the 0.8oC from the past 1500years isn't natural? should read 150 years.
    0 0
  14. Ned @ 8 'Cloud feedbacks remain the largest source of uncertainty.' For example, see: Cloud Feedbacks in the Climate System: A Critical Review (Stephens 2005). Googling 'cloud feedbacks in the climate system' yields 289,000 results - this just happens to be a reference on the first page. I think we can be too quick to dismiss the role of clouds.
    0 0
  15. Ned @ 8 PS: Just take a look at what I presume are the uncertainty bars for CO2 and clouds respectively in your diagram from AR4.
    0 0
  16. Good post - a topic on which I've had a number of debates with irrational skeptics. A minor text quibble - maybe change the opening "The" in the 3rd sentence to "Their" - the logical leap is only logical if you're a skeptic! Alexandre - it does change the sensitivity to CO2, because if the world's climate responded significantly to the ~ +0.3W/sq m of the MWP, it will respond correspondingly more significantly to the >1W/sq m of anthropogenic CO2 forcing. Few parts of the climate system are particular about from where they get their extra W/sq m. Larger natural variability must result in larger climate forcing from anthropogenic CO2. Unless you can argue that the CO2 forcing is a much lower value in W/sq m, then the latter must follow the former. And there is relatively little uncertainty about the CO2 forcing value, as Ned's posted figure shows. RSVP - the Sun has as much impact now as it did in the past, but the forcing is rather small in comparison to that of CO2. The papers linked in this NASA article are well worth a read: CO2: The Thermostat that Controls Earth's Temperature, particularly two new ones, as they are quite relevant to this post.
    0 0
  17. Philip64, You are correct. Sea level was higher than today during the MWP by between 12 and 21 cm. This is because of the prolonged length of the MWP allowed for losses of ice and thermal expansion to occur over a long period of time. Grinsted et al (2010) conclude that if we saw no increase in temperatures from the year 2008 to 2100 we would see a sea level rise greater than during the MWP as the thermal inertia of the oceans and the ice caps catch up. The article I am citing is here: http://www.springerlink.com/content/527178062596k202/
    0 0
  18. chriscanaris - why would clouds operate differently in the present day compared to the past? If clouds are a strong negative feedback, we would see far less natural variation than we do in the palaeoclimatic record, be it last 1000 years, or ice ages. There simply haven't been large enough positive natural forcings to allow clouds to operate as a big negative feedback. You'd end up with a palaeoclimate flatter than a Mann et al (1999 vintage) hockey stick shaft...
    0 0
  19. skywatcher #16 I thought I had said that too on my third paragraph... anyway, if I did not make it clear, I'll rectify it by endorsing what you said now.
    0 0
  20. 18.skywatcher Why would clouds respond the same to CO2 variation in the industrial period as they might have to solar variation in the pre-industrial period? While you can measure the direct affect from increasing levels of CO2 or changes in solar irradiance (assuming accurate measurements) you can't really calculate what the feedback responses are. Maybe I'm wrong but these sorts of calculations that John are describing seem to assume simple fedback mechanisms shared by all forcings.
    0 0
  21. doug_bostrom #12 "RSVP, just as an exercise..." My question was directed to understanding the sensitivity of climate, not climate scientists.
    0 0
  22. RSVP, your question was: "Should'nt sensitivity be related in some way to units of time?" The "Watt" is a measure of power, of energy expressed as a rate, an amount of energy divided by an amount of time, one Joule per second, meaning that sensitivity expressed in Watts is automatically related to units of time.
    0 0
  23. Ned #9 Thanks for the explanation. If I understand correctly, sensitivity has to do with the steady state average global temperature as affected by incremental forcing. Using "sensitivity" in this context is odd when what matters is getting the system under control in time.
    0 0
  24. doug_bostrom There is a big difference between exposing chicken on a spinning skewer to a flame for 1 minute and 1 hour.
    0 0
  25. Just wondering, on your first graph, is CRUTemp NH, but what is exactly this serie? a 12 month mean of CRUTempNH does not rise more than 0.657, according to this: http://woodfortrees.org/plot/hadcrut3vnh/mean:12/from:2000 Even that would be too noisy, but on your figure,it's a noiseless signal, and it goes up to about 0.87-0.88 more or less... Anyway, looking again to the first figure, the recent temperature anom. would be about the same as the drop estimated from around 1480-1550 (eyeballing) without a net forcing and in time period somewhat similar to recent anom, a bit higher. What is the reason for this drop?
    0 0
  26. To be specific. The chart shown is Moberg 2005. The hockey stick that is the central point of controversy is the one by Mann in 1998 that was part of the IPCC report. Moberg shows more temperature variation than Mann does on a consistent basis. Many skeptics consider Moberg to be reliable. Mann is the one that irks them. I personally think Moberg does good work. I have reviewed many of his proxy reconstructions and see no problem with them. Calling a Moberg chart the Hockey Stick is very imprecise.
    0 0
  27. chriscanaris, with all due respect, you're missing the point. It's not that there aren't uncertainties about, e.g., cloud albedo feedbacks or whatever. The statement "The MWP was very warm" implies a certain assumption about those feedbacks. Specifically, it implies that positive feedbacks outweigh negative feedbacks by more than we currently expect ... in which case climate sensitivity will be on the higher side of what we expect. You have to be consistent in your argument here. It's not reasonable to assume a high value for climate sensitivity in order to get a large MWP, while also assuming a low value for climate sensitivity in order to minimize the effect of AGW. HumanityRules, the default assumption should be that cloud feedbacks would respond the same way to a warming atmosphere. If you think that differences in how you warm the atmosphere would be large enough to make significant differences in cloud feedbacks, it's up to you to provide evidence for that.
    0 0
  28. @TIS: "To be specific. The chart shown is Moberg 2005. The hockey stick that is the central point of controversy is the one by Mann in 1998 that was part of the IPCC report." Mann revised his original hockey stick in 2008. Why don't "skeptics" ever talk about that one?
    0 0
  29. Not a complaint, but whenever I here someone say, "the hockey stick", I have to wonder 'Which hockey stick?' Most often, they mean the one from Mann, et al, 1998, and they complain about using tree rings as though the researchers had no idea that there are other things beside temperature which affect tree growth. (Rest assured that they are well aware of the nature of the proxy that they chose.) But that is one study of many, and whether you use tree rings, pollen counts, isotope levels in corals, or other proxies alone or in combination, you still get a hockey stick. Here as a small sample of hockey sticks from other studies. HR, Regarding, "Why would clouds respond the same to CO2 variation in the industrial period as they might have to solar variation in the pre-industrial period?" There will be differences in the pattern of heating, or cooling, depending on the mechanism of the forcing, see the topics on human signature on this site, but, for instance, a collection of water molecules with an opportunity to evaporate does not care whether its energy came in the form of shortwave solar radiation, or longwave emissions from the atmosphere. In the aggregate, you have not presented any reason for things like, in what latitudes the rain bands are, and how much water is locked up in ice sheets, to be determined by things like whether nighttime temperatures are rising more than daytime temperatures. Also, the actual calculations performed, and factors considered, by researchers are exceedingly more complicated than anything presented here; saying that what is here is simplified is telling us what we already know, and doesn't mean that it's wrong. It's like you are trying to obscure the forest with trees.
    0 0
  30. This post sums up perhaps one of the worst skeptic contradictions. They love to say the MWP was hot, and they love to say the climate isn't sensitive. You can't have it both ways. Humanity Rules raised a valid point in #11 that climate sensitivity isn't identical for different forcings. There's a factor called "efficacy" and in fact it's likely that the climate is less sensitive to changes in solar irradiance than changes in atmospheric greenhouse gases. I discussed this in the Advanced 'climate sensitivity is low' rebuttal. But the bottom line is that the efficacies of different forcings aren't wildly different, so if you're arguing for a hot MWP, you are arguing for a high climate sensitivity, including to CO2.
    0 0
  31. RSVP, Maybe this will help you with the time scale question. Oh, look, there is a link to this site near the bottom of the first page where this topic has been covered before, and you were part of the debate.
    0 0
  32. The Inconvenient Skeptic wrote : "Calling a Moberg chart the Hockey Stick is very imprecise." Not really, especially if you look at the original for the complete 2000 year period. I look at it this way : the original Mann 98/99 hockey-stick was brand new and had a pretty straight handle. Since then, it has appeared from just about every consequent study using all sorts of proxies and so is a little bit older, over-used, over-familiar and (in every respect) a bit battered - so that its handle is now less straight and even. It's still going strong, though, and still recognisably a hockey-stick, especially with that steep upward blade at the end.
    0 0
  33. chriscanaris: I think we can be too quick to dismiss the role of clouds. This sounds reasonable, until one starts wondering who "we" are, and what "dismiss" and "too quick" actually mean (especially in the context of this post). Are you claiming that climate scientists have dismissed the role of clouds? Prematurely, no less? If so, I'd love to see the evidence that informs this opinion. An explanation of how this accusation relates to preindustrial warming would also be helpful. As for "uncertainty," the point that it doesn't inherently support a "skeptical" or inactivist stance apparently can't be made often enough. Frankly, comments like this one strike me as similar to what Elizabeth Kubler-Ross called "bargaining."
    0 0
  34. JMurphy... re: TIS re: Moberg's hockey stick... We might say that Moberg is playing field hockey. Mann was definitely a straight ice player in 1998, but had clearly broadened his venue by 2003. People get WAY too caught up on Mann 1998. That was 12 years ago. Science has moved on. But, as John has pointed out here, we should all hope that Mann 1998 is more accurate and that there is less sensitivity to CO2.
    0 0
  35. Chris G #31 ""...you were part of the debate." Someone has to hold the line.
    0 0
  36. Alexandre - no problem, sorry if I misinterpreted what you said. RSVP - dana1981 has of course answered your query far better than I could. I see little reason why the largest feedback in the system should operate in a substantially different way when responding to shortwave energy as compared to longwave energy, and as dana1981 suggests, the W/sq m may be a little more effective rather than less effective. I wonder if the albedo feedback is perhaps more influenced by the longewave downward radiation of GHGs (in that this form of radiation is present worldwide and at night, therefore maybe more ever-present to melt snow and ice than shortwave radiation? But I don't know the values involved there so that is just speculation on my part!
    0 0
  37. As I understand it, the key issue with the original Manne "Hockey Stick" was that he relied on a single, geographically limited, Northern Hemisphere Tree species as his temperature proxy. Of course, we now know that dendrochronology-even across multiple species-is not the best proxy for climate, given that drought can be as much a cause of small tree-ring size as the cold. His peers rightly attacked his methods &-as was noted-he has since revised his methodology to incorporate a number of other proxies. Of course, at least half a dozen paleo-climatologists (like Moberg) have also produced their own proxy-based climate studies-covering anything from 600 to over 2000 years. Although none of these studies show a *true* hockey stick, they do all show climate variation within a relatively narrow band-& over multi-centennial time frames-up until the 2nd half of last century. Still, nice to see the skeptics prefer to fight battles that are more than 10 years old. Maybe they're the only ones that they think they can win?
    0 0
  38. Ned @ 27: 'It's not reasonable to assume a high value for climate sensitivity in order to get a large MWP, while also assuming a low value for climate sensitivity in order to minimize the effect of AGW.' With respect, Ned, I'm not making any assumptions. I'm simply looking at the range of possibilities which flow from the AR4. On one scenario, clouds may exert a negative feedback greater than the positive feedback of CO2. Is this so? At this stage, we can only guess. However, the assumption that our current modelling satisfactorily incorporates clouds (and to a much lesser extent aerosols) is just that - an assumption. Phila @ 33: I'm not into bargaining (and by implication, denial). I'm getting weary of repeating that I believe rising CO2 very likely heralds warming and that our society should aim to decarbonise. I do however like consistency in the presentation of the science whether it comes from an AGW or 'sceptical' perspective.
    0 0
  39. chirscanaris #38 Three questions: 1. What evidence do you have to date that the negative feedback effects are substantial? 2. If the answer to question 1 is that you do have substantial evidence, is this sufficient negative feedback to keep us out of trouble in the future? 3. If the answer to q 2 is no, do you have evidence that the negative feedbacks will increase in the future. You see conjecture alone, or selectively reading the lower range of error bars (*cough Ken Lambert cough*) won't cut it.
    0 0
  40. 30.dana1981 I think you can have it both ways as long as you don't take a very simplistic approach to climate forcings, feedbacks and variability. What seems to lie behind these ideas is that feedbacks are associated with the temperature change induced by these forcings rather than any other factors. For example CO2 traps more energy increasing temp. This increase in temp causes an increase in water vapour which traps more energy and amplifies the warming. Is solar variance (and other forcings) simplified in this way? Because is strikes me there are many ways solar variance might cause changes in the system (feedbacks) that go beyond the simple feedback caused by an increase in temp, through physiochemical processes for example. Can somebody answer this for me. Do we know for sure all the feedbacks associated with increased CO2? Do we know all the feedbacks associated with changes in solar irradiance? Do we know all the feedbacks associated with volcanos? If the answer is no then we can't actually say that an increase in climate sensitivity to solar variation infers an increase in sensitivity to CO2. That seems the basic argument behind the ideas John is presenting and it seems flawed to me.
    0 0
  41. kdkd @ 39 1) See AR4 and literature review as per original post 2) No, However, the same applies to the thesis advanced in the post. 3) No. Again, the same applies to the thesis advanced in the post. Supposition permeates the entire field and we need to acknowledge this if we want to be credible.
    0 0
  42. chriscanaris - I'm not sure that it is an assumption that current models satisfactorily model clouds. Climate sensitivity is an equilibrium value and it has been derived repeatedly using multiple sources of data (not modeling information, actual data) over multiple time periods. The results do vary, but they all have similar ranges that overlap. Given the time scales involved and the fact that climate sensitivity is an equilibrium value, it's probably reasonable to say that climate models likely model clouds sufficiently for equilibrium conditions, given that climate models independently derive ranges for climate sensitivity that are roughly similar (and that overlap) with the empirically-derived values. The question is whether clouds are modeled well enough for periods of rapid transitions. In mathematical parlance, how much do the clouds change the slope of the differential equation in time from the base level of the climate sensitivity? Will they increase or decrease the slope, and by how much?
    0 0
  43. chriscanaris #41 It seems to me that you need to expand on what you mean by your answer to questions 2 and 3, in order to attempt to show that you're making a valid claim. At the moment your answer is an assertion, and is not backed by evidence.
    0 0
  44. angliss @ 42: Your point about modelling in relations to period of rapid transition valid. However, as I understand it, the uncertainties extend well beyond this issue. From the abstract of the Stephens 2005 paper: '...What emerges is the importance of being clear about the definition of the system. It is shown how different assumptions about the system produce very different conclusions about the magnitude and sign of feedbacks. Much more diligence is called for in terms of defining the system and justifying assumptions. In principle, there is also neither any theoretical basis to justify the system that defines feedbacks in terms of global–time-mean changes in surface temperature nor is there any compelling empirical evidence to do so. The lack of maturity of feedback analysis methods also suggests that progress in understanding climate feedback will require development of alternative methods of analysis. It has been argued that, in view of the complex nature of the climate system, and the cumbersome problems encountered in diagnosing feedbacks, understanding cloud feedback will be gleaned neither from observations nor proved from simple theoretical argument alone. The blueprint for progress must follow a more arduous path that requires a carefully orchestrated and systematic combination of model and observations. Models provide the tool for diagnosing processes and quantifying feedbacks while observations provide the essential test of the model’s credibility in representing these processes. While GCM climate and NWP models represent the most complete description of all the interactions between the processes that presumably establish the main cloud feedbacks, the weak link in the use of these models lies in the cloud parameterization imbedded in them. Aspects of these parameterizations remain worrisome, containing levels of empiricism and assumptions that are hard to evaluate with current global observations. Clearly observationally based methods for evaluating cloud parameterizations are an important element in the road map to progress.'
    0 0
  45. kdk @ 43: See the excerpt from the Stephens 2005 abstract as above. I think this deals with your questions (2) & (3). If you want to scrutinise the paper itself, there's no paywall :-).
    0 0
  46. chriscanaris #45 Without wading through the detail of the Stephens 2005 paper, it doesn't seem to be offering any information on the order of cloud feedbacks relative to other climate forcings. As a result the paper quite rightly does not offer strong conclusions about the sign and magnitude of climate sensitivity itself, but defers this to other literature. From looking at the paper, it does not offer any justification of the strong claims that you are trying to make.
    0 0
  47. kdkd: The whole point of the paper is that there is a lot we don't know and a lot we need to find out. Recognising the limitations of our knowledge is the sine qua non for progress in science. AR4 however does provide an estimate of cloud and aerosol feedbacks relative to other forcings including an estimate of uncertainties for both cloud, aerosol, and CO2 forcings. While I don't regard AR4 as the Holy Grail of climate science (there is no such thing in any science), I think it's a reasonable starting point.
    0 0
  48. An excellent article, John. Confronting skeptics (who won’t listen) and the general public (who may listen) with the logical consequences of skeptics’ claims is potentially an effective alternate line of rebuttal. I don’t think you need to complicate the article by discussing the evidence for a global or local MWP. The global temperature reconstructions in Ned’s article posted on 28 Sep 2010 are broadly in line with the reconstruction you have used here, so your argument still holds. The climate sensitivity to a particular greenhouse gas (CO2, CH4 or whatever) is the temperature rise resulting from a doubling in concentration of that greenhouse gas. The value of the radiative forcing corresponding to the doubling is not part of the definition. Your wording: Technically, climate sensitivity is defined as the change in global temperature if the planet experiences a climate forcing of 3.7 Watts/m2 (which is how much climate forcing you get from a doubling of CO2). Suggested alternate wording: Technically, climate sensitivity is defined as the rise in average global temperature resulting from a doubling of atmospheric CO2. (The added radiative forcing from such a doubling is 3.7 Watts/m2.) The text “then current climate change must also also natural” should read ““then current climate change must also be natural”.
    0 0
  49. Chris #47 For prudence, one should take the midpoint of a value between error bars for your estimated parameter value, unless there's good evidence to suggest that the error bars are somehow wrong. In which case the error bars should be revised to be narrower. Unless there's assessment of greater uncertainty. As a good guess, one should take ±1SD of the error bars as being 66% likely and ±2sd as being 95% likely, with ±3 SD as being 99.8% likely. Attempting to draw strong conclusions by assuming that the true value is between -3 and -2 SD (approx. 17% likely = (99.8-66/2) ) is a fools errand. This appears to be what you're doing. The paper you referred to was merely indicating that the current estimate of the size of the error bars is very wide, which is an entirely different proposition.
    0 0
  50. chriscanaris: I'm not into bargaining (and by implication, denial). I'm getting weary of repeating that I believe rising CO2 very likely heralds warming and that our society should aim to decarbonise. Bargaining doesn't imply denial, as I see it. It implies a preliminary acceptance of a situation, coupled with an unwillingness to face the full implications of that situation. My impression is that you keep saying, in effect, "maybe things won't be all that bad," without offering much in the way of a cogent defense for that position. Again, uncertainty in itself does not provide rational grounds for optimism. Furthermore, I suspect that the scientists who are counseling immediate action actually have a far better grasp of the relevant uncertainties than dilettantes like you or me. Recognizing what we don't know is important, granted. But recognizing what we do know is important, too. Waiting for the science to get "better" is a pretty irresponsible gamble, IMO, especially given that the plausibility of AGW being much less serious than we think seems to rise in inverse proportion to one's actual expertise.
    0 0

1  2  Next

You need to be logged in to post a comment. Login via the left margin or if you're new, register here.


The Consensus Project Website

THE ESCALATOR

(free to republish)


© Copyright 2024 John Cook
Home | Translations | About Us | Privacy | Contact Us