Climate Science Glossary

Term Lookup

Enter a term in the search box to find its definition.

Settings

Use the controls in the far right panel to increase or decrease the number of terms automatically displayed (or to completely turn that feature off).

Term Lookup

Settings


All IPCC definitions taken from Climate Change 2007: The Physical Science Basis. Working Group I Contribution to the Fourth Assessment Report of the Intergovernmental Panel on Climate Change, Annex I, Glossary, pp. 941-954. Cambridge University Press.

Home Arguments Software Resources Comments The Consensus Project Translations About Support

Bluesky Facebook LinkedIn Mastodon MeWe

Twitter YouTube RSS Posts RSS Comments Email Subscribe


Climate's changed before
It's the sun
It's not bad
There is no consensus
It's cooling
Models are unreliable
Temp record is unreliable
Animals and plants can adapt
It hasn't warmed since 1998
Antarctica is gaining ice
View All Arguments...


Username
Password
New? Register here
Forgot your password?

Latest Posts

Archives

Ten temperature records in a single graphic

Posted on 26 January 2011 by John Cook

Last week in Monckton Myth #2, Robert Way published an intriguing graph 'All Method Temperature Index'. The graph plots the average of ten different global temperature datasets:

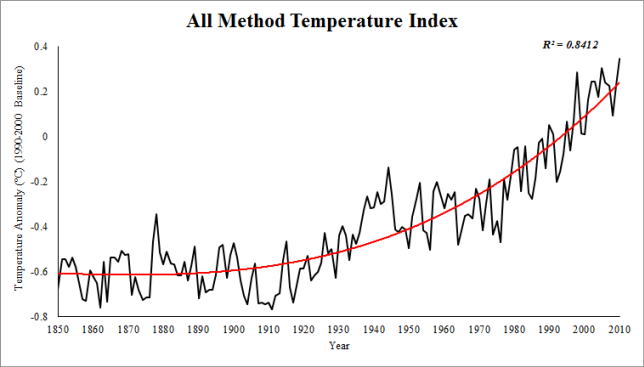
Figure 1: All Method Temperature Index (AMTI). 1990-2000 Baseline.

To create this graph, Robert had to track down a number of different temperature series. There were your classic "rock star" datasets - NASA GISS, NOAA and HadCRUT. The other favourites, although not going back as far as the thermometer records, are the satellite records UAH and RSS.

But another great addition are a number of other "reanalysis products". These are datasets that use a wide range of sources to reconstruct temperature. This includes thermometers, radiosondes, satellites, buoys and ship measurements. This way, they're able to create temperature records covering the entire globe, even Arctic regions that other datasets such as UAH, RSS and HadCRUT fail to cover. This is important because the Arctic is warming faster than the rest of the planet. To omit the Arctic is to underestimate the global warming trend.

Robert has also plotted a graph of all ten temperature records in a single graph, a vivid reminder that many independent lines of evidence all tell us the same thing. I've added it to our steadily growing Climate Graphics resource:
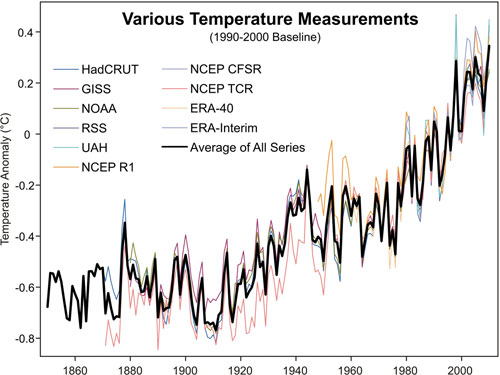
As with all our climate graphics, this is under a Climate Commons license so you're free to use this elsewhere. And the graph is available in a number of formats including an Excel Spreadsheet which contains all of Robert's methodology including the ten datasets and his graph from Monckton Myth #2. I'm very happy about this as I've been wanting to get hold of the European reanalysis data for while but have been too lazy busy to process the data myself :-)

0 0

Printable Version  |  Link to this page

Comments

Prev  1  2  

Comments 51 to 65 out of 65:

  1. #45: "until "abnormal" is quantified, the question cannot be answered" Interesting. Pirate can state categorically that we are within historical norms for temperature and then turn right around to declare that 'abnormal' isn't known. So how can being within norms have any meaning? Oops, I'm forgetting that logic need not apply.
    0 0
  2. # 34 Robert Way I have looked a little into the japanese data (JMA). The problem is that the data one can download are gridded. To make a global average it must be area weighted. Which is step 4 in the methods of JMA My attempt in Scilab is here: Averaging JMA data
    0 0
  3. # 53 I should add that my attempt is not working properly. There is something wrong with my way of area weighting.
    0 0
  4. @46 apiratelooksat50 As someone who has taught middle school Earth Science, I find your comment a bit hard to believe. However, if true I would imagine that their AGW skepticism originated from sources other than a science class.
    0 0
  5. Pirate: In the last interglacials the sea level was up to 6 meters higher than it is now. That would put Miami and 5 million other people under water in Florida alone, not to mention hundreds of millions elsewhere. If that is normal for you OK but where I live that is abnormal. I call anything over what existed in the last 2000 years abnormal and we are well over that now. I teach AP Chemistry and I notice that studetns usually agree with whatever teacher is in the room. What you hear from them reflects what they think you want to hear.
    0 0
  6. Once again Pirate seems under the delusion that scientific fact is determined by a "democratic vote". Unless those 28 out of 30 students can then go on to *prove* what the driver of climate change is (other than CO2, CH4, NO2 & CFC's), then what they *believe* is responsible is totally irrelevant-whether they're accepted into College or not. If all that was required was what the *majority* of people believe, then the US would have to abandon the Theory of Evolution too.
    0 0
  7. Looking again at the graph the moderator put on my comment #5. I am being serious here. We have temperature records for the last 150 years or so tagged onto the end of a string of data taken from core samples and such. If the same technique of research/analysis was done on the last 150 years, would there be a different recording on the end of this graph?
    0 0
  8. Well, HuggyPop has taken a beating already, but... "My mind asks if it is the last few percentages that heat quicker,..." 'If' is key here. In fact, rate of energy loss is proportional to the 4th power of the temperature. So, given some constant rate of additional energy inflow, there will be a more rapid rise in temperature rate immediately after the additional energy source is added than there will be from that point forward. A graph of temperature curve would show a decreasing slope over time; that is exactly the opposite of what every global temperature record reveals, which is an increasing slope over time. It doesn't really matter what the forcing is; the only way you can get an increasing slope over time is if you increase the forcing faster than the body can reach an equilibrium. To use Huggy's analogy, the only way to keep a graph with an increasing slope is if you start the recording of the pot's temperature and then gradually crank up the juice. So, other than GHGs, what factor affecting the thermodynamic equilibrium of the planet has been increasing over the last ~150 years?
    0 0
  9. apiratelooksat50 - if your best science students are that clueless as to evaluating scientific evidence then your country, wherever it is, has some really serious problems facing the future beside AGW.
    0 0
    Moderator Response: [muoncounter] The latest NAEP Science test results help explain the problem: One percent of fourth-graders, 2 percent of eighth-graders, and 1 percent of twelfth-graders performed at the Advanced level. Those 8th graders in 2009 are today's HS students. And this is still off-topic. John, perhaps a thread on science education might be of interest?
  10. HuggyPopsBear, why do you imagine that we should abandon incredibly accurate instrumental/satellite temperature readings and, instead, rely on proxy records that cannot, by definition, be as accurate ?
    0 0
  11. #56 Marcus, :-) You know, in certain circles, the majority of the people believe that an object twirled in an arc and then released will continue to travel in an arc, just a bigger one, rather than a straight line. It would be a funny world to live in if the laws of physics changed with whatever the majority happened to believe at the time.
    0 0
  12. Robert @34, Good point. Yes, the RATPAC-A sites don't provide comprehensive coverage (only 85 sites). The sounding data do avoid problems associated with the UHI if one uses those data measured above the planetary boundary layer (say 700 mb and up). Here is a map of the coverage: [sourced here; more information here]. One would have to choose a level or layer. It seems that NCDC uses the 850-300 mb layer.
    0 0
  13. JMurphy #60 I know I am not the all knowing one here scientifically, but the comment is a little ignorant to say the least. Read the question I posed again and see if you come up with a different conclusion. I am not advocating that one should abandon the instruments of the day and the last 150 years, out of interest I am asking what would the graph look like if the same techniques were applied to the last 400,000 years to the last 150. If similar patterns arose as prior to instruments, then surely that data run alongside modern calculation would change the chart for the whole 400,000 years and probably give surprising reading.
    0 0
  14. I'll bet you'll like the interactive graph here Huggy.
    0 0
  15. Would using the same ice cores, bore holes, tree rings match the current temperature record going back 130 years? If it did then there is no question it would be right. I feel it would put to sleep alot of skepticism holded by the skeptics.
    0 0
  16. Re: HuggyPopsBear (63) Color me confused, HPB, but I still don't understand your question. Obviously, if we could magically extend the reach of modern instrumentation backwards in time to bring into fine focus various periods in history and keep their context relative to modern times, we would do so. The various proxy reconstructions are what we have. If you are unsure as to the reliabilities of the reconstruction techniques, try the IPCC AR4 for summaries of the various methodologies used. Or try the Search function in the upper left corner of every Skeptical Science page to see what posts are here on whatever topic interests you. Or you can go through the SkS arguments by taxonomy. Your choice. You seem to imply something funky is going on with modern "techniques". I'm a little slow today (unlike yesterday when I was slow-er), so please spell it out for me: What exactly do you mean? Looking at all the data we have, we are now at a temperature point equivalent to that in the Holocene Optimum: With yet more warming in the Business-As-Usual (BAU) pipeline: The Yooper
    0 0
  17. @65 Matthew Are these ice core, bore hole and tree ring techniques not based and calibrated on the past 150 years of accurate data? So by definition they will match. As a scientific endeavour it would be meaningless.
    0 0
  18. Sphaerica at 47 Did you not read my post? Their teacher buys in to the AGW hypothesis. And, he is the most titled educator in the department. Today was the first time I've ever had contact with any of them in 4 years of their schooling. I teach different Jr. and Sr. level courses. These are bright, educated, college scholarship worthy students. How dare you accuse anyone of "misteaching or misleading" just because they don't agree with you? Their primary teacher over their high school career is in your camp!
    0 0
  19. Ahhh, Pirate, you still haven't clued into the fact that Science is *not* a Democracy. Either your opinions are backed by the Scientific Evidence, or they're *not*. How many people agree with you-even if they are bright, college bound types-is really besides the point if those same people can't provide *proof* for why they agree with you! Of course, the "oh, but look at all these people who agree with me" anecdotal "evidence" is a fairly typical ploy on the part of the Skeptics. In the absence of *scientific evidence*, just run around saying that all of these bright, collage bound types agree with your opinion-so that must make you *right*. Newsflash, it *doesn't*!!!
    0 0
  20. @65 apiratelooksat50 Why should the opinions of some HS students (no matter how smart) matter? I certainly would not be interested in their opinions on subjects in my field of expertise. Not until they showed them to be more than opinion anyway.
    0 0
  21. A Pirate said... Of the 30 students in this room, 28 of them are already accepted to college and half of them are going on scholarships. Not one single student supports the AGW theory. They think human activities have effect on the climate and contribute to temperature changes, but they do not think CO2 is the driver. Let's see.... those here who accept AGW can cite the world's leading scientists (including Nobel Laureates and National Academy members), *all* of the world's leading research laboratories and universities (ranging from Lawrence-Livermore National Laboratory, to the Scripps Institution of Oceanography, to the Max Planck Institute, to CalTech, the University of California, MIT, Harvard U., Oxford, etc., etc., as well as every single professional scientific association of any stature on this planet. And who does a vocal skeptic here have to cite? High-school students??? HIGH-SCHOOL STUDENTS???? (sorry for the caps-lock action here.) apiratelooksat50, is that all you've got???
    0 0
  22. Hmm, apiratelooksat50@68: Reminds me of when my niece was little. You could ask her if she wanted vegemite or peanut butter (but you had to say, "mite or butter?"). If you asked "mite or butter?", she would answer "butter", but if you asked "butter or mite?", she would answer "mite". Anyway, if you have that class again, why not get them to read this website for a while, and then go and read WUWT, then have a discussion led by someone who understands climate science. After that their opinion might mean a bit more.
    0 0
  23. apiratelooksat50 #68 Then here is a proposition. Conduct some in depth polling with this class to find out 'why' they don't accept AGW and bring the results back here. Is it a lack of knowledge that they have based an opinion on? Detailed knowledge that they have based an opinion on? Are the views based on an evaluation of the data or their opinions about who is saying it? Are their opinions influenced by their outlook on life. What are the demographics of this group? Religious orientations, economic background etc. Get something more than anecdotal and then we can discuss it.
    0 0
  24. I would really like to know what school pirate is at. But in any case, I wouldn't trust the opinions of a few (American) teenagers! In fact I wouldn't trust my own beliefs as a teenager. I believed Eric Von Danikens extraterrestrial ideas when I was a teenager. There are a lot of things I believed then or which drove my imagination, that were in retrospect complete garbage. I think Marcus has made the definitive comment regarding pirate and his students. Science isn't a democracy, whether students believe something different, eg. creationism, it doesn't have any relevance to scientific truth and reality. I guess some of the problem is political correctness, all beliefs are accepted, even if the subject has nothing to do with 'belief'.
    0 0
  25. @Daniel Bailey “Looking at all the data we have, we are now at a temperature point equivalent to that in the Holocene Optimum ...” There are no regional data (not combining "apples with oranges"), indicating that current temperatures are in any way for the Holocene a record. Quite the opposite. Also in the Arctic. (Marsz 2009, page 62 - figure - ryc.1.) “Of 140 sites across the western Arctic, there is clear evidence for warmer-than-present conditions at 120 sites. At 16 sites where quantitative estimates have been obtained, local HTM temperatures were on average 1.6±0.8 °C higher than present.” “Along the Arctic Coastal Plain in Alaska, there are indications of summer temperatures 2–3C warmer than present.” Wiki: “Since there is no scientific consensus on how to reconstruct global temperature variations during the Holocene, the average shown here should be understood as only a rough, quasi-global approximation to the temperature history of the Holocene. In particular, higher resolution data and better spatial coverage could signicantly alter the apparent long-term behavior (see below for further caveats).[...]” Previous attempts to create global Holocene temperature reconstructions are inconsistent with the fundamental principles applicable to the statistics (excessive variance and too large range of standard deviation).
    0 0
  26. HuggyPopsBear, as well as the other suggestions given, why don't you look at this RealClimate page for further information.
    0 0
  27. I teach AP CHemistry in an American High School. The students will often respond to a teacher with what they think the teacher wants to hear. The students would know Pirate feels strongly that AGW is not correct so they will not argue with him in class. If their regular teaher was present they would likely support AGW. The split of students is generally the same as the general public. If all of them are against AGW you must have influenced them by your questioning. In order to find out what the students really feel you have to get to know them for a long time. Even then some will say what they think you want to hear.
    0 0
  28. Arkadiusz @75, Not so fast. From NOAA, "In summary, the mid-Holocene, roughly 6,000 years ago, was generally warmer than today, but only in summer and only in the northern hemisphere. More over, we clearly know the cause of this natural warming, and know without doubt that this proven "astronomical" climate forcing mechanism cannot be responsible for the warming over the last 100 years." Also, look at this (and that 2004 data point can be moved from +0.48 K to +0.63 K for 2010): [Source: here] Regarding the Arctic: Miller et al. (2010, QSR): "Solar energy reached a summer maximum (9% higher than at present) 223c.gif ¨11 ka ago and has been decreasing since then, primarily in response to the precession of the equinoxes. The extra energy elevated early Holocene summer temperatures throughout the Arctic 1–3 °C above 20th century averages, enough to completely melt many small glaciers throughout the Arctic, although the Greenland Ice Sheet was only slightly smaller than at present." Jakobsson et al. (2010, QSR): "The combined sea ice data suggest that the seasonal Arctic sea ice cover was strongly reduced during most of the early Holocene and there appear to have been periods of ice free summers in the central Arctic Ocean." Also from Polyak et al. (2010, QSR): "The current reduction in Arctic ice cover started in the late 19th century, consistent with the rapidly warming climate, and became very pronounced over the last three decades. This ice loss appears to be unmatched over at least the last few thousand years and unexplainable by any of the known natural variabilities." So in the early Holocene, when temperatures were likely 1-3 K above 20th Century values, the Arctic may have been ice free during the summer. Now consider that The Arctic has already warmed by 1-2 K relative to temperatures in the early to mid 20th century, and recently has been warming at almost three times the global rate (about 0.5 K per decade since 1979). These data suggest that the Arctic is already very close to temperatures experienced there in the early Holocene, and will very likely exceed them around circa 2040. That is also when we will likely see the Arctic briefly ice free in the summer, although it is not impossible that the Arctic could be largely ice free before then. By 2100 warming of annual temperatures by +5 K predicted by the IPCC for the Arctic (range 3-8 K). Our current emissions path (SRES A2) suggests a warming of almost +6 K with respect to early 20th century temperatures, way above anything seen over the Arctic during the Holocene.
    0 0
  29. @Pirate: "How dare you accuse anyone of "misteaching or misleading" just because they don't agree with you?" Well, if they disagree with the current state of Climate Science without any evidence to support their position while in a science class, I think it's safe to say they have in fact been mistaught. Of course, it is also entirely possible they agree with you because you are an authority figure to them, and you apparently do not accept AGW theory. Like someone already remarked, they are likely to be telling you what you want to hear. In any case, anecdotal evidence offered online is worthless. We have no way of knowing you're telling the truth, after all. I suggest you stick to science and not try to bring such appeals to popularity. Anyway, I think if we were to poll young people on AGW theory we'd find they are more likely to accept it than the general population.
    0 0
  30. #68: "bright, educated, college scholarship worthy students" As there is no content in either HS Chemistry or Physics that deals with climate change (even the thermo taught in Physics stops with Carnot cycles), this is neither an issue of 'bright students' having an educated opinion nor one of 'misteaching'. My bet is on parental viewpoint - I recall pirate mentioned the southeastern US - that is politically biased or otherwise non-scientific. Of course, if the same group of students also believes that there is no gravity in space, that would shout 'misteaching'. The experiment that Glenn proposes in #73 would include giving such bright students, who have the pressure of college admits behind them, the opportunity to research the AGW question. Two weeks with groups tackling different pieces of the subject and presenting their results to the class could produce some interesting results.
    0 0
  31. My purpose of posting the comment about the AP Physics students was not to imply any scientific basis to discredit AGW, but to show that public perception of AGW is very different than what you may think. If the AGW hypothesis does bear fruit, and there are true negative effects that might possibly be addressed by proactive reduction of CO2 emissions, then these are the people that must be convinced. They are our future leaders. As far as my influencing these students with my viewpoints, trust me it did not happen. This was the one and only time I've had any contact with them. I simply showed them the graphs and articles from this site (yes, SKS only!) and asked their opinions. It wasn't until the end of the period that I voiced my thoughts. Glenn @ 73 - You make some good points and if we can carve some time out of their curriculum, I will do just that. Here is a link to a survey my Environmental Science students are conducting as a project. They followed a guide in their textbook while developing this survey to minimize any bias. Other than supplying computer access, I was hands-off. Click here to take survey
    0 0
    Moderator Response: [Daniel Bailey] You should learn a better differentiation between a hypothesis and a theory. It might also be a good idea to have your students read this as well.
  32. Ed Davies at 00:03 AM on 27 January, 2011 @caerbanog #7, are the extra readings the ones differentiated by the "duplicate" field or just the "modifier"? I have to admit that I couldn't understand the description of the duplicate field so my own version of this just ignores it and uses the last data value for each station, but it does take the modifier as part of the station identification. I think that the duplicate number refers to duplicated time-series -- i.e. data with id #'s that vary by only the duplicate number should be identical (or nearly so). Not really clear as to why it's there (but haven't really investigated it). My new procedure simply merges all temperature data associated with a given WMO # (sans modifier and duplicate number) into a single time-series. Since I'm just doing straightforward averages in the merging process, the presence of duplicates will have no impact on my results. After I compute merged temperature time-series (one per WMO id), I then proceed with the anomaly calculations. The new results aren't all that different from the old results, but there is a visibly smaller difference between the "raw" vs. "adjusted" results in the early 20th Century with the corrected approach. If you plot out NASA's "Northern Hemisphere" and "Northern Latitudes" temperature results (data available at: http://data.giss.nasa.gov/gistemp/tabledata/ZonAnn.Ts+dSST.txt), you will find that the "dumb average" approach (with WMO stations merged first) produces a post-1970 warming rate that lands in-between NASA's NH and NL warming rates (which certainly makes sense, intuitively).
    0 0
  33. DB @ 66, Where did you get the second graph in this comment? It is not the same one labeled Figure 16 in the original paper.
    0 0
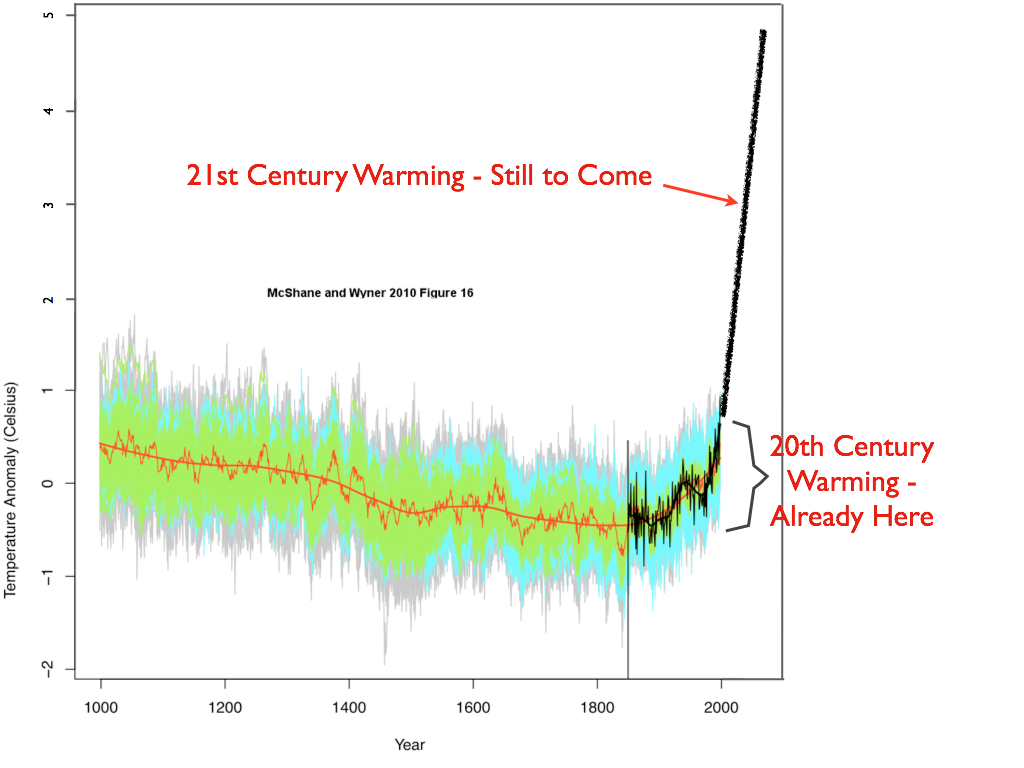
    Moderator Response: [Daniel Bailey] Pardon for the delay in responding; been a little preoccupied with life, the universe and everything. Inre the graph from #66, I intentionally used the "Skeptic's" darling, the McShane and Wyner graph, adapted by Wag here. See also here, here and here for supporting discussion and sources.
  34. Pirate: Your survey on line provides data that shows historic prehuman climate change and then asks if humans are causing current climate change. That biases the result. If you provided DB's second graph you sould get a completely different result. The deniers current theme is that climate change is normal and we cannot do anything about it. They used to say climate change was not happening, but that has been proven wrong. Additionally you ask if people will pay to reduce CO2. People always say they do not want to pay for changes. It is not clear that renewable energy will be more expensive than fossil fuels once the fossil fuel subsidies are removed. Certainly in 100 years fossil fuels will be more expensive- they will be used up. Students know what your opinions are even if you do not state them. Their friends have your class. Your position was clear from your first post here on SS. The framing of the on line survey is an example of your position. I only needed to read one question to see the point of the survey. Many students are concerned about climate change. Whether or not enough are interested is still to be determined. Right now it looks grim in the USA. My skeptical student tell me that they will not change their position until their house is flooded. It is not enough if Australia (or Texas) is hit.
    0 0
  35. Pirate, "I simply showed them the graphs and articles from this site (yes, SKS only!) and asked their opinions." Which graphics exactly (links please) and what did you say about them? Thanks.
    0 0
  36. From the McShane and Wyner paper that DB pulled the graphs from @ 66. Abstract: We find that the proxies do not predict temperature significantly better than random series generated independently of temperature. Furthermore, various model specifications that perform similarly at predicting temperature produce extremely different historical backcasts. Finally, the proxies seem unable to forecast the high levels of and sharp run-up in temperature in the 1990s either in-sample or from contiguous holdout blocks, thus casting doubt on their ability to predict such phenomena if in fact they occurred several hundred years ago. This is the graph as it appears in the paper.
    0 0
    Moderator Response: [Daniel Bailey] The graph I used came from here.
  37. Alb @85, They went all over the site, but mainly concentrated on the two threads concerning CO2 lagging temperatures, and the natural cycles that were posted here within the last few weeks.
    0 0
  38. Sweet @ 84, Their survey, not mine, was again based on guidance from their textbook. The textbook actually supports your premise of AGW. Pre-human climate change is what it is. It happened and there is no denying it. Providing DB's second graph based on projections would surely bias the results. 60% of the respondees were willing to pay extra for renewable energy to reduce CO2 emissions. Fossil fuel based energy is cheaper and more reliable currently and for some projected time. Other than nuclear, some work is still required to effectively use alternative energy on a large scale. (FWIW, I like alternative energy where applicable.)
    0 0
  39. I wonder, if these repondents were polled on it ahead of time, if they would say that they will agree to pay to rectify a pathetic financial fiasco generated by careless banking practices? mmmmm... Well, that is off topic and I expect will be deleted but it would be as skillfull a survey question as the ones included in that little poll concocted by pirate. How about a question like this: 3 different oncologists tell you that you have cancer and it's likely to be malignant. Another oncologist, retired 10 years ago and holding a quirky reputation tells you yeah, you might have it, but it'll probably go away and if not it's a good thing anyway. Would you still seek treatment and be ready to pay for it? I wonder, has anyone estimated the price of fossil fuels if they were to completely loose all forms of susbidies?
    0 0
  40. Pirate @88, "The textbook actually supports your premise of AGW." You have got to be kidding..."premise"? AGW is a theory, or as the national academy of sciences is on the record saying, "fact". Sorry, but you are displaying your inability to objectively present the facts about climate science and AGW Pirate.
    0 0
  41. #88: "Pre-human climate change is what it is. It happened and there is no denying it." No one denies that. However, there is no causal connection between climate change on the geologic (presumably what you call 'pre-human') time scale and the climate change here and now. That's what you're missing; or do you actually believe that unrelated events have exactly the same cause? See Climate's changed before or CO2s been higher in the past and take further 'pre-human' commentary there.
    0 0
  42. Apirate @89, You seem to have elected to completely miss the point about DB's post....no? M&M 2010 has already been questioned widely by real climate scientists, and the analysis has been found to fall short. You can read all about it here at the journal. I suspect Dan provided that particular graphic to appease contrarians b/c it was generated by "skeptics". Regardless, it seems that you are seeing only what you want to see. Here is a much better reconstruction for the last 2000 years, not 1000 as M&M10 did, by Ljungqvist (2010): And here is another Hockey Stick published only days ago: There are enough Hockey Sticks out there to equip a couple of NHL teams.
    0 0
    Moderator Response: [Daniel Bailey] Pardon for the delay in responding; been a little preoccupied with life. Inre the graph from #66, I intentionally used the "Skeptic's" darling, the McShane and Wyner graph, adapted by Wag here. See also here, here and here for supporting discussion and sources.
  43. Pre-human forest fires are what they are. They happened and there is no denying them. To some, that obviously means something...
    0 0
  44. Pirate: The pre human climate changes you have referenced are certainly true. They show that with the current forcings (not including BAU increases) we can expect all of southern Florida and most of Bangladesh to be under water in the future. I defined that as abnormal. You have not defined what is abnormal for you. How about if you add this question to your poll: Can the people from Bangladesh come and live in your city when theirs is underwater from CO2 pollution? Would you pay more for electricity if it kept the Bangladeshis in Bangladesh? You would get different responses. When millions of pepople become climate refugees (like has already happened in Pakistan) that is a recipe for disaster and war. That is abnormal weather for me.
    0 0
  45. @ michael sweet (94) The world will reel under the logistics of supporting millions of climate refugees. When those millions become tens of millions, borders will collapse. If those tens of millions become hundreds, civilization collapses as well. The US military has many planning scenarios already in place for that eventuality. Pray they go unneeded. The Yooper
    0 0
  46. #95 Daniel They may not be as prepared as everyone thinks. See here
    0 0
  47. @ 96 Thanks, Ron. Saw that some time back. The scenarios are always being reworked, being "living" documents. The Joint Chiefs have scenarios for almost any eventuality (including a "Chicxulub"-scale impactor). What is probably lacking is the political will of their masters to let loose their leashes... The Yooper
    0 0
  48. I think they are waiting for global warming to manifest itself as a physical being Daniel. Then they can dust off the Buffalo Rifles and kill it. After all if you can't see it, hear it, touch it, or smell it -- then it doesn't exist. Right? Nope -- wrong again!
    0 0
    Moderator Response: [Daniel Bailey] Nothing to see here, no extra CO2, nada. Like ze Spanish Inquisition, nothing to see.
  49. I know I'm off topic. Sorry. The part that gets me the most is when people like James Inhofe make statements to the effect that CO2 is a colourless, odourless, non-toxic gas. That should be a great comfort to any submariner. Just think of the money that could be saved by removing all those CO2 scrubbers from subs. Nothing could be finer than to suffocate in an oxygen rich environment (contaminated with say <4%? CO2).
    0 0
  50. Good point, JMurphy. The "Skeptic" logic-if it can be called that-is akin to saying that: as forest fires can occur naturally, then no human can ever be responsible for forest fires. That is, of course, a total logical fallacy-whether applied to climate change or possible arson ;).
    0 0

Prev  1  2  

You need to be logged in to post a comment. Login via the left margin or if you're new, register here.


The Consensus Project Website

THE ESCALATOR

(free to republish)


© Copyright 2024 John Cook
Home | Translations | About Us | Privacy | Contact Us