Climate Science Glossary

Term Lookup

Enter a term in the search box to find its definition.

Settings

Use the controls in the far right panel to increase or decrease the number of terms automatically displayed (or to completely turn that feature off).

Term Lookup

Settings


All IPCC definitions taken from Climate Change 2007: The Physical Science Basis. Working Group I Contribution to the Fourth Assessment Report of the Intergovernmental Panel on Climate Change, Annex I, Glossary, pp. 941-954. Cambridge University Press.

Home Arguments Software Resources Comments The Consensus Project Translations About Support

Bluesky Facebook LinkedIn Mastodon MeWe

Twitter YouTube RSS Posts RSS Comments Email Subscribe


Climate's changed before
It's the sun
It's not bad
There is no consensus
It's cooling
Models are unreliable
Temp record is unreliable
Animals and plants can adapt
It hasn't warmed since 1998
Antarctica is gaining ice
View All Arguments...


Username
Password
New? Register here
Forgot your password?

Latest Posts

Archives

The e-mail 'scandal' travesty in misquoting Trenberth on

Posted on 10 April 2011 by villabolo

"The fact is that we can't account for the lack of warming at the moment and it is a travesty that we can't." -Kevin Trenberth

Trenberth's statement was quoted completely out of context by those who orchestrated the fake 'Climategate' scandal. The statement is distorted to mean that there is no global warming. That is not the case.

Trenberth's job is to track exactly how much energy is reaching us from the sun, and how much of that warming has been absorbed by the air, land, oceans, and melting ice. He also calculates how much is reflected or radiated from each of these places. The more global warming there is, the more energy is absorbed by all these places.

Therefore, Trenberth was talking about where some of the warmth has gone, not that there is a lack of warmth. The illustration below shows what the situation is. Please note the lack of information from the deep oceans.
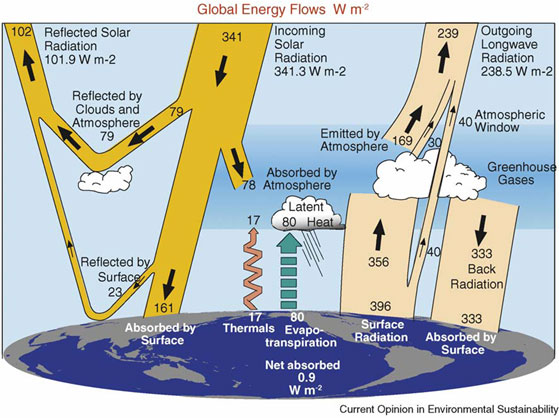
Figure 1. The global annual mean Earth’s energy budget for the March 2000–May 2004 period in W/m2. The broad arrows indicate the schematic flow of energy in proportion to their importance. From Trenberth et al.a

The situation can be easily explained by the following analogy.

Suppose you are an accountant for a major corporation which grossed 1 billion dollars last year, then increased to 1.1 billion dollars this year. This would be a 100 million dollar increase from the previous year. Your job is to find out where and how all the money was spent. You take into account every detail such as salaries, benefits, purchases, etc.. Ideally, your goal as an accountant is to account for every dollar spent or left over as profit. Realistically you can be off by a small amount without worry.

Imagine, however, that 5% (55 million dollars) is unaccounted for. That would be serious. You know that the company has been making more money but where did it go? Was it due to waste or mismanagement of company resources? Is there someone stealing the money?

Suppose now, that the accountant sends an e-mail saying, "I cannot account for the missing money and it's a shame."

Now imagine a person who wants to defame the company. He hacks into the e-mail and quotes the accountant out of context by claiming that the company is actually not making more money.

When Trenberth said, "...we can't account for the lack of warming..." he meant the same thing as that accountant. Just substitute the word "warmth" for "money".

He could not accurately determine the Earth's complete global energy budget because the instruments we have to measure the ocean's warming only go down to 2 kilometers (little over 1 mile) and oceans can be several thousand meters deeper than that. Because of that, we will not be able to account for all the energy absorbed by the oceans until we place measuring instruments deeper than they are now. However, our measurements of how much energy from global warming is flowing through our atmosphere, land, and melting ice, are well known.

a. Trenberth KE, Fasullo JT, Kiehl J; Earth's global energy budget. Bulletin of American Meteorological Society 2009, 90:311-323.

0 0

Printable Version  |  Link to this page

Comments

Prev  1  2  3  

Comments 101 to 103 out of 103:

  1. There are several 6 year periods where the OHC decreased while undoubtely it increased overall. This obvious fact (along with others similar) is the basis of Trenberth question. It's a subtle question though, which apparently many can't grasp.
    0 0
  2. 100#logicman : AFAICS, the paper deals with uncertainties in the pre-2000 warming, not with the leveling off in the last decade. Of course natural noise can superimpose to long term trend and give for some time an apparent absence of warming - I guess that's what Dr Trenberth is really thinking. But it also means that the same natural noise could also have contributed positively in the past years, and that the "real" trend was after all lower than what we thought. A noise can obviously go in both directions. So in any case, that's an information that models must take into account.
    0 0
  3. @Gilles #97
    yes multiplying 1 W/m2 by the surface of the Earth and the number of seconds in one year gives something like 10^20 J/year - and so? what does it change ?
    No, it doesn't. Unless you are considering 1234 x 1020 or 0.00001234 x 10²⁰ to be valid answers, what wouldn't surprise me. But common sense says you didn't bother -or perhaps you couldn't- make a simple calculation. Next time, in order to fool people, say "order of magnitude" instead of "something like". I meant and continue to mean it looks like you don't have any idea about what Trenberth was speaking about in the current topic -that famous email-. Your "dance with numbers" kind of confirm it. The "travesty" comes from a specific 'dialogue' conducted by mail and some contemporary works.
    0 0
  4. @Gilles #99 Please, set aside pompous phrases as "as a function on time" and don't distort information. The figure you placed in #99 is clearly identified as OHC700 in Levitus, Antonov, Boyer et al. Maybe if you dig a bit more and actually read the papers and figures you'd be able to find what the 'travesty' is indeed. Maybe when you reach your comment 1000 you'll realize that a) 75% of the oceans are outside what you cited, b) the travesty has to do with that, and c)your intentional double standard is more than obvious.
    0 0
  5. well Alec, I think I still can do simple arithmetic computation 1 W/m2 * 4 * Pi*(6,4e6)^2*365*86400 = 1,62 E22 J/yr = 162 E20 J/yr. Now the figures given here are : Land: 2 x 10^20 joules per year Arctic sea Ice: 1 x 10^20 joules per year Ice sheets: 1.4 x 10^20 joules per year Total land ice: between 2 to 3 x 10^20 joules per year Ocean: between 20 to 95 x 10^20 joules per year Sun: 16 x 10^20 joules per year (eg - the sun has been cooling from 2004 to 2008) they're all of the order of magnitude of 10^20, meaning a few % of the last result except for the ocean that can reach almost 10^22. We are speaking of one part of the 0.9W/m2 missing -meaning some 10^21 J/yr missing. This means that oceans represent the main part of heat sinks on the Earth, all the other components being negligible. That's exactly what I meant here, at the very first post of this thread : " the atmosphere stores only a tiny amount of energy" and later here " The sentence should have read: "Our measurements of how much energy goes into the atmosphere, land, and melting ice are accurately known, however."" Oh, yes, sure ! I know it accurately. On average , it's zero." Well zero is a little bit rhetorical - I should have said a few percent of the total. The heat storage takes place essentially in the oceans, all the other components are negligible. Again, what is your point ?
    0 0
  6. Alec#104. Again , what are you're arguing? that energy must be conserved? of course it must ! did I deny that ? I said that when Trenberth said that they couldn't explain the lack of warming, he meant that there was a lack of warming, and that he couldn't explain it. Again, it's extremely simple : he said what he meant. Now you're saying : oh but other people have suggested that it could be due to heat storage in the deep ocean - well of course this is a *possible* explanation. But to my knowledge, there isn't precise measurements of the heat content of deep oceans. So it is only one of the possible explanation - another obvious one being that the global imbalance used is wrong. You seem to mix up suggestions with explanations. ( -Snip- )
    0 0
    Moderator Response: [DB] Cease with making things personal. You are simply incorrect, yet incapable of admitting so. Most would regard that flaw as a failing.
  7. Sorry, DB, but I don't see where I've been incorrect. I'm only answering Alec's remarks directed to me.
    0 0
  8. Gilles#99: "the leveling off since 2004 and perfectly visible - and continuing. " Yes, just as visible as the 'leveling off' was in 1960, 1970, 1984, 1987, 1993, 1997 and 2001. And yet the overall trend from 1970-2010 is persistently up. #102: "Of course natural noise can superimpose to long term trend and give for some time an apparent absence of warming - ... A noise can obviously go in both directions." In this case, it appears the noise is the 'leveling off.' You seem unusually sensitive to this particular noise; so much so that you cannot see the signal?
    0 0
  9. @Gilles #105 At last! You're in track now. Just some clarifications: - "this means X what's exactly what I meant here" only means "I'm saying it twice", not that the conclusion is right. - You present part of the body of your argumentation again: one hand there, one leg that way ... - You continue to mix up OHC with the total ocean heat content. If you don't get it yet, you're simply echoing the set of data that seem to fit. It may sound good for uneducated people -and unfortunately the world is full of uneducated people-, but it's obvious that you are taking heat content of a layer for a period and saying "it's cooling" without bothering to explain why the same layer warmed during the previous decade at a rate above the 25 to 90 you quoted and without bothering to explain what happened with that 75% of the oceans outside that layer and ...no, not yet. Keep it going. I suppose that if you make one or two more of your comments you can get it your way: I or another person will explain you what the travesty is without you having to do an effort to understand it.
    0 0
  10. Gilles #105 Your numbers are right Gilles. Dr Trenberth's number for a global imbalance of 0.9W/sq.m is 145E20 Joules/year. The only place this heat can be stored (over 90%) is in the oceans. Therefore the rise in OHC must be the integral of the net forcing (the area under the forcing curve) between time T1 and T2. Check out this thread: http://www.skepticalscience.com/news.php?p=2&t=78&&n=202 BP does a pretty good job of explaining why the 'step jump' in OHC in the 2001-3 period is an artefact of the XBT-Argo transition. So not only do we not have an increase in OHC content 2004-present, we might have had little for the 17 years 1993-2010 shown on the charts.
    0 0
  11. @logicman #100 Both, paper and graphic refer to the same ocean layer, not to the whole oceans. As an interesting exercise for students, take some typical ocean temperature profile, for instance, this, and estimate how much you have to move it downwards -repeating the same temperature in the surface- to hide 1023J throughly distributed. You will be surprised by the answer.
    0 0
  12. @Ken Lambert #110 Interesting, but no. There are a lot of problems in that argumentation -and in your conclusion-, for instance the down-dwelling being restricted by BP's ukase to polar iceshelves borders. The matter here is quitting the fallacy of the 0-700m layer being "the oceans" and repeating the same analysis for 0-300m layer, 0-500m layer and 0-1000m layer. You also can present the 0-700m layer analysis by sublayers of 100m. Once that done -and it has being done- just observe if all layers follow a similar trend or there are a lot of heat relocations -to avoid the term "transfer"-. The technique of the bullsphere 2.0 has been so far a lidocaine one: just pounding on the outer layer for 2004-2008, trying to keep the previous +10 years in shadows and 75% of the ocean dark as it is, and then, once the anaesthetic effect is obtained, add some wishful thinking disguised as a conclusion, for instance "So not only ..., we might have had little for the 17 years 1993-2010 shown on the charts." Really!? Ah! "we might"! the everlasting use of a modal auxiliary verb as an epistemological resource.
    0 0
  13. Alec Cowan #112 Happy to engage you on any of the numbers rather than the bullsphere Alec. Trenberth was highlighting the fact that in Aug09 when his now famous paper was published - he could not account for more than about 60% of the warming imbalance which was postulated by Hansen in 2005 (0.9W/sq.m) Since then; Knox and Douglas published a paper in Aug10 which showed that 2003-08 data for OHC content was flat or slightly negative (cooling)for the top 700m and *deep ocean* of approx +0.09W/sq.m (Purkey & Johnson). The paper cites five Argo studies for 0-700m OHC by Willis, Loehle, Pielke, Knox & Douglas show **negative** OHC change, while von Schukmann (0-2000m) is the outlier showing +0.77W/sq.m. I would like know if the Knox & Douglas paper has been contradicted or its findings overturned by more recent studies. If not, then Trenberth's lack of warming is still with us, and in fact has gone from finding 60% of Hansen's 0.9W/sq.m to finding almost **none** of it.
    0 0
  14. @Ken Lambert #113 Be so gracious of providing the links. About Purkey & Johnson, do they (and you) mean this? [Which is one of many works showing warming in abyssal waters and in southernmost basins]. Most of published works go that way, but I'm waiting for Gilles to completely explain/expose himself on this subject prior to provide the links and comment the conclusions. I suppose, as your appear to be commenting this in a knowledgeable manner, that you have downloaded and installed the interface to Argos data to do your own checks. How did it go? Also, when you checked Hansen's 0.9W/m2 against the black body, what ΔT did you get? What conclusions did you reach? And the supposedly cooling oceans and sea level variation, what conclusion did you get from your reality check? It speaks volumes about a person whether he or she did that or didn't. This kind of forums or comment sections are plenty of polemicists amateurs, would-be dialecticians and assorted dilettanti. One would better think it twice before asserting that salmons disprove that rivers flow from mountains to seas.
    0 0
  15. "Most of published works go that way, but I'm waiting for Gilles to completely explain/expose himself on this subject prior to provide the links and comment the conclusions." I thought the thread was about the interpretation of Dr Trenberth's quote, I think I have already answered : In my opinion, he just meant what he said: there is a lack of warming and it's a travesty we can't explain it. "Also, when you checked Hansen's 0.9W/m2 against the black body, what ΔT did you get?" The blackbody at which temperature ?
    0 0
  16. Alec Cowan #114 "I suppose, as your appear to be commenting this in a knowledgeable manner, that you have downloaded and installed the interface to Argos data to do your own checks." Do I detect the curled lip of the academic who is laughing on the other side of his face Alec?? The Knox and Douglas paper is here: http://www.pas.rochester.edu/~douglass/papers/Knox_Douglass_KD_IJG_InPress.pdf When I have worked out how to tap into the rivers of gold flowing into paid research on climate science - I will do my own Argo analyses. And by the way, Dr Trenberth calculated the increase in radiative feedback in Fig 4 of his famous paper here: http://www.cgd.ucar.edu/cas/Trenberth/trenberth.papers/EnergyDiagnostics09final2.pdf His number is -2.8W/sq.m. He explains this on page 23 thus: Dr Trenberth: "However, the observed surface warming [2] of 0.75 degC if added to the radiative equilibrium temperature of the planet would result in a compensating increase in longwave radiation of 2.8 W m2 (Figure 4) (although this does not translate into OLR)" My simple calculation of the S-B relation with an OLR of about 240 W/sq.m and final emitting temperature of 255degK is like this: (255/254.25)^4 x 240 = 242.84. Increase in OLR = 2.84W/sq.m. for an increase in overall emitting temp of 0.75 degC. This is remarkably close to Dr Trenberth's 2.8W/sq.m increase in longwave radiation which suggests that the surface temp increase since pre-industrial times of 0.75 degC (at around 288 degK) is very close the the increased emitting temperature of the planet at around 255 degK. The doubling of CO2 theory requires an approx 3 degC rise at the surface for a 1 degC rise in emitting temperature which equates to a 3.7W/sq.m increase in OLR. One wonders why the current emitting temp increase is not significantly less than 0.75 deg surface increase if the enhanced CO2GHG effect is already causing an extra insulating effect in the atmosphere. This is a good question for Dr Trenberth, unless you have an answer to share with us.
    0 0
  17. @Gilles #115
    I thought the thread was about the interpretation of Dr Trenberth's quote, I think I have already answered : In my opinion, he just meant what he said: there is a lack of warming and it's a travesty we can't explain it.
    You do know he didn't (by the way, I call your technique "back to square one"): 1st)Your interpretation coincides with that of the "climategate mysticism", that is, phase 1: some words out of context are taken away and presented as a conspiratorial theory; phase 2: the person behind the words make clear he/she didn't mean it that way; phase 3: the people behind phase 1 try to cast shadows on 2, insist on 1, and suggest that 1+2 is like O.J. saying "I didn't do it", trying to promote the public associating the target with something reported at 6PM News. There are many techniques that are useful with ignorant folks in a laundrymat context ("If the dude didn't mean it, why didn't he sue the people pointing a finger to him? Eh!?) --- Iterate. In case the debate goes badly for your position, return to the last place you feel in control and on solid ground, that is, phase 1 (...back to square one...). 2nd) Why did you put almost a third of this thread's comments? Can you summarize the main points of what you have said so far?
    The blackbody at which temperature ?
    Really!? That is pretty obvious, there is a range of pertinent ones and the implications will not change. But I proposed that to Ken Lambert who appears to be knowledgeable. But I can make it easier for you: If some year's imbalance is, say, 0.9W/m2and the planet warms, will be next year the imbalance the same ceteris paribus.
    0 0
  18. @Ken #116 (This is a partial reply. I'll follow it later)
    Do I detect the curled lip of the academic who is laughing on the other side of his face Alec?? ... When I have worked out how to tap into the rivers of gold flowing into paid research on climate science - I will do my own Argo analyses.
    Your detector is broken: I meant and still mean it. Many people, including I, have downloaded it and used it -in my case, in a third-wordly five years old computer- and nobody is getting paid for it. In fact, it takes much less time to scout the databases and learn a lot than commenting repetedly and fruitlessly in blogs. I have to practise my English and the heat of the debate promotes me thinking in English, what's your excuse?
    My simple calculation of the S-B relation with an OLR of about 240 W/sq.m and final emitting temperature of 255degK is like this: (255/254.25)^4 x 240 = 242.84. Increase in OLR = 2.84W/sq.m. for an increase in overall emitting temp of 0.75 degC. This is remarkably close to Dr Trenberth's 2.8W/sq.m increase in longwave radiation which suggests that the surface temp increase since pre-industrial times of 0.75 degC (at around 288 degK) is very close the the increased emitting temperature of the planet at around 255 degK.
    We're still talking about Earth, aren't we? Please, confirm that and your 255°K. Imagine the surprise of 15 degrees Celsius plus 240 watts per sq. meter becoming 255 degrees Kelvin and then being "remarkably close" to something slightly pertinent to the subject.
    0 0
  19. "1st)Your interpretation coincides with that of the "climategate mysticism", that is, phase 1: some words out of context are taken away and presented as a conspiratorial theory" sorry, but the words seem perfectly in the context - Trenberth was talking of the lack of warming of oceans and curiously, he said "The fact is that we can't account for the lack of warming" - I don't see out of which context it could be ? "; phase 2: the person behind the words make clear he/she didn't mean it that way; " he didn't say that IMHO. He said that it didn"t think that it meant that global warming has stopped - but nevertheless, he really said that there was a lack of warming in the observations - that required an explanation. I really don't see what worries you : there are obvious problematic observations (the lack of warming of the known heat sinks), and we need to find another explanation. That's a very current situation in science, so I don't see why you are so reluctant to understand that
    0 0
    Response:

    [DB] Still oh-so-wrong.  Cue Dr. Trenberth himself:

    In my case, one cherry-picked email quote has gone viral and at last check it was featured in over 107,000 items (in Google). Here is the quote: "The fact is that we can't account for the lack of warming at the moment and it is a travesty that we can't." It is amazing to see this particular quote lambasted so often. It stems from a paper I published this year bemoaning our inability to effectively monitor the energy flows associated with short-term climate variability. It is quite clear from the paper that I was not questioning the link between anthropogenic greenhouse gas emissions and warming, or even suggesting that recent temperatures are unusual in the context of short-term natural variability.

    The paper on this is available here:

    Trenberth, K. E., 2009: An imperative for climate change planning: tracking Earth's global energy. Current Opinion in Environmental Sustainability, 1, 19-27, doi:10.1016/j.cosust.2009.06.001.

    This paper tracks the effects of the changing Sun, how much heat went into the land, ocean, melting Arctic sea ice, melting Greenland and Antarctica, and changes in clouds, along with changes in greenhouse gases. We can track this well for 1993 to 2003, but not for 2004 to 2008. It does NOT mean that global warming is not happening, on the contrary, it suggests that we simply can't fully explain why 2008 was as cool as it was, but with an implication that warming will come back, as it has. A major La Niña was underway in 2008, since June 2009 we have gone into an El Niño and the highest sea surface temperatures on record have been recorded in July 2009.

  20. Gilles... You really need to look no further than the two sentences that follow in the actual email in order to understand what Trenberth was talking about: "The fact is that we can't account for the lack of warming at the moment and it is a travesty that we can't. The CERES data published in the August BAMS 09 supplement on 2008 shows there should be even more warming: but the data are surely wrong. Our observing system is inadequate." [My emphasis.]
    0 0
  21. @Gilles #119 You are just repeating the technique with some variations. You simply repeat the quote of phase 1 in shortened version ("The fact is that we can't account for the lack of warming") but preceded by your "Trenberth was talking of the lack of warming of oceans and curiously, he said " what is quite a fabrication. Why don't you quote the whole e-mail? You are just playing with language: you play with "oceans" trying to suggest it was the whole oceans, you play with "the observations" trying to suggest "all observations". What tops it all is your "problematic observations" and "we need to find another explanation". The first one suggest there are observed values that are "problematic" because the observer doesn't like what she observes. That's the way you work, not the observer. The second one, instead of looking for the missed values, it suggests a theoretical substitution is needed. You simply carve each word and try to get the most of your disinformation techniques. When you start quoting the original e-mail we'll be able to start analyzing what he said.
    0 0
  22. Rob #120 Quite right Rob, your quote is in context. Dr Trenberth is lamenting the fact that "Our observing system is inadequate" to support and explain the AGW theory and that this state of affairs is a 'Travesty'. This is the classic 'its there but we can't measure it' argument, which Gillies and I would probably agree turns the scientific method on its head. Theory follows observation - is confirmed or modified by more observation - and made robust by successful prediction confirmed by more observation. Which of our AGW scientisis predicted a flattening or zeroing of OHC increase with broader and more accurate observation by Argo analysis? And which scientist came up with the idea that you can 'correct' a raw observation of 6.4W/sq.m by a reduction factor of 5.5W/sq.m and still call it evidence of a warming imbalance??
    0 0
  23. @Gilles #123 What's next? An e-mail with Trenberth telling John Calvin where is Miguel Servet hiding? Trenberth saying "no where close", was he eating "a whole nother apple"? Trenberth quoting his own e-mails ("Hi Tom >blah >blah >blah >Kevin"). Trenberth using the word "travesty" one each fifty words. Trenberth loving exclamation marks and speaking in an emotional way like he's part of Jersey Shore's cast. Trenberth saying "we will never be able" to do something. Don't worry, I would be the first to complain if your message were deleted, as it clearly depicts yours, not Trenberth's.
    0 0
  24. [complaint about moderation snipped] did, or didn't Dr Kevin Trenberth write these sentences in reply to Tom Wigley : [hacked private email snipped] [complaint about moderation snipped]
    0 0
    Moderator Response: [Dikran Marsupial] Republishing stolen private emails is not acceptable. Prof. Trenberth has gone on record clarifying what he meant by that email; I think he knows what he meant by what he wrote rather better than you do. If you don't already know this, it is common for emails to be written in haste, using ambiguous terms that the sender knows the intended reader will understand from wider context (e.g. previous discussions they have had). You are not the intended reader, and are not in a position to reliably interpret the content of the email, nor am I, nor is anyone else. Trenberth on the other hand is, so please limit yourself to his intentionally published comments and the science. Complaints about moderation also tend to get deleted (after reading), so don't mix them up with what is intended to be substantive comment or the substantive comment will be deleted along with it. If you want to discuss that sort of thing, there are other places where it is on-topic; but not here, thank you.
  25. @Ken Lambert #122 It looks you go where you see an opportunity of profit. Nothing better for you that taking a quotation ("Our observing system is inadequate") and without having to state which exact "observing system" it is, and only once that's clearly done, state what's the level of "adequacy" Trenberth had in mind, ... no, instead of doing what is reasonable and right, you attach your "...to support and explain the AGW theory and that this state of affairs is a 'Travesty'." to feed your favourite horse: the observing system and the level of adequacy are univocally those that must explain and support AGW and the whole "state of affairs" being a travesty, a sort of pompous 'o tempora o mores' indirectly suggesting -by using a careful wording- it being sort of a confession made by Trenberth and no what it really is, in essence your personal baseless opinion. Following that, you add a crafty mix of epistemology taken form K-12 propedeutics of science, complacency for you and your kin, and an attempt to taxonomize 'something is rotten in the state of Denmark'. The rest are your numbers, which you won't reply if contested. You still have to answer for your calculations in #116. You wouldn't answer to the obvious bait I placed in front of you, because to do so you had to admit that you were changing the black body temperature of Earth. What did you have in mind? Tunning up the Sun? Moving the Planet 2 million kilometers closer to the Sun? Growing Earth's diameter? You simply came back again to the sole ground you are proficient: rhetorics. You will find a thousand ways to say the same and make it look like there are thousand lines of evidence which point to the same conclusion. But, that's why we are here, aren't we? And this will continue. In the end, no single message will be important, but the whole thread will reveal the a clear repetitive pattern. Don't think vehemence means lack of patience.
    0 0
  26. "You wouldn't answer to the obvious bait I placed in front of you, because to do so you had to admit that you were changing the black body temperature of Earth." Alec and Ken, there is nothing like "THE" blackbody temperature of the Earth - it's simply not an isothermal sphere. If you ask if it is possible to change the average temperature of the Earth without changing its energy content, or the opposite, the answer is without doubt yes - and I can demonstrate it on request. It's enough to change the latitude repartition. And if you ask if the latitude repartition has changed, the answer is again yes.
    0 0
  27. Alec Cowan #125 "The rest are your numbers, which you won't reply if contested. You still have to answer for your calculations in #116. You wouldn't answer to the obvious bait I placed in front of you, because to do so you had to admit that you were changing the black body temperature of Earth. What did you have in mind? Tunning up the Sun? Moving the Planet 2 million kilometers closer to the Sun? Growing Earth's diameter?" Alec my reply was deleted by Moderators. You have to be quick and online to see my replies these days. Offer your own calculation instead of 'baiting' us with your commentary.
    0 0
    Moderator Response:

    [DB] As you well know, comments constructed to adhere to the Comments Policy which are also on-topic are never deleted. In any case, your deleted reply to Alec is here:

    Ken Lambert at 12:29 PM on 16 April 2011

    Alec Cowan #118

    "We're still talking about Earth, aren't we? Please, confirm that and your 255°K. Imagine the surprise of 15 degrees Celsius plus 240 watts per sq. meter becoming 255 degrees Kelvin and then being "remarkably close" to something slightly pertinent to the subject."

    I assume you are taking the mickey here Alec. Respond with something showing some understanding of the numbers or take your 5 year old computer and go home.

  28. @Ken #127 [Thanks DB for letting me know] Do your own calculation on an incremental basis for that 0.9w/m2. This is a reality check for common people, not the substitution of lines of research. You'll get some value along 0.25 to 0.3°C -what is like telling that a grown human is 1 to 2 meters high, bad for being a witness in a trial but good information for an Andromedan-. You can do another reality check by supposing that those, say, 0.3°C will be obtained once and only the 0-100m layer in the oceans has warmed 0.3°C. Suppose a linear process, forget the ice melting, the lands, the atmosphere and 97% of all the ocean, and even suppose that such imbalance will only disappear once the temperature has raise 0.3°C. How many years do you need? 0.03-0.3-3-30-300-3000? Repeat the calculation considering all the oceans. How many years do you need. Start to sensitize the calculation, including continents warming quicker than oceans, more clouds modifying albedo and a lot "details" that are still major contributors to the real situation. What do you obtain? About the programs you need to be payed to download and use for free, here I'm showing some images I got from there (low taste colouring is courtesy of the programming team): My home is 'about' the letter A. One of the problems I proposed is taking those three images for the same month and making a rough estimate of the variation in heat content from one year to the next considering the profile to be the constant from 38 to 42° of latitude (there are more than 2 x 10¹⁶ tons of water in that slice). Try yourself and you will be surprised by the results. [The problem of moving downwards the temperature profile goes along with this problem and both have a lot to do with the 'travesty', a legitimate concern expressed by Trenberth and many many more]
    0 0
  29. Alec Cowan #128 Suggest you read through the contributions of BP and KL and others from this thread, rather than my repeating complex arguments: http://www.skepticalscience.com/Climate-cherry-pickers-cooling-oceans.html Note particularly the issue of a 'gold standard' of tethered buoys all over the planet as a comparison for Argo. The issue is that Argo coverage is far better than XBT or prior methods and as full deployment has proceeded and problems rectified, the heat content increase has flattened, zeroed or (in the top 700m) cooled. viz. the Knox & Douglas paper referenced earlier.
    0 0
  30. @Ken #129 uhu? I don't think so. The fact is it looks that the new treasure hunt is getting a paper that states a cooling-warming of the oceans from any 4 or 5 years in a row within the last decade that states an average from -2 to 1.6W/m2 in 0.05 increments. It's just a matter of time -and a research of academical resources including those outside public access WWW- that you'll find the paper with the value of your choice. The Knox & Douglas paper was why I suggested -to others- the exercise in #128 -the exercise predates the paper-. I have to thank you for that paper because it's now in my database for critical thinking in Statistics. Take a look to figure 1 there and tell me what you see. Neither BP nor you contributed one of many papers revealing a heat gain in deep oceans for recent years, specifically in southernmost basins. Why? Is some cherry-paper picking out there? Some kind of "editorialized" line of evidence? The papers I was referring in a previous comment are related to the travesty as Trenberth meant it. The papers you picked are related to the a supposedly independent line of evidence "confirming" the 'climategate' paraphernalia. The matter continue to be "the travesty", as that's the topic of this post and these comments. I suppose people interested in that already discussed the real cooling parts -there are those, I've been discussing about that since 2007- of the supposedly cooling trend and what causes it, all within the other post you listed.
    0 0
  31. Alec Cowan #130 "Why? Is some cherry-paper picking out there? Some kind of "editorialized" line of evidence? The papers I was referring in a previous comment are related to the travesty as Trenberth meant it. The papers you picked are related to the a supposedly independent line of evidence "confirming" the 'climategate' paraphernalia." The Knox and Douglas paper was published in Aug10 which showed that 2003-08 data for OHC content was flat or slightly negative (cooling)for the top 700m and *deep ocean* of approx +0.09W/sq.m (Purkey & Johnson). The paper cites five Argo studies for 0-700m OHC by Willis, Loehle, Pielke, Knox & Douglas show **negative** OHC change, while von Schukmann (0-2000m) is the outlier showing +0.77W/sq.m. I note that K&D quoted Willis (a private communication) as a reference in the Aug10 paper. This is pretty recent information. I would like know if the Knox & Douglas paper has been contradicted or its findings overturned by more recent studies. BTW all these numbers quoted in the above papers are 'global'. You can highlight parts of the oceans which are heating or cooling, but what counts about 'global' warming are 'global' numbers.
    0 0
  32. @Ken #131 You're just repeating yourself, Ken. Why don't you quote exactly every part of Knox & Douglas where they state clearly that the ocean layer is other than 0-700 metres regarding figure 1 and their calculations using those 4 methods? Do that and we'll continue to talk because it looks like you "want" for it to be "the oceans". It looks to me like you see Ocean Heat Content and a flat or slightly negative trend line together and feel a heartbeat rush "That's it!". Read it again, carefully. Then we can move to the others studies and later come back to the cooling periods -the real ones-. That's where the travesty is. Should I conclude that you see Knox & Douglas' figure 1 and have nothing to comment?
    0 0
  33. @Ken #131 I forgot. Why have you supposed that the figure in #128 was the only one? Did you want that a group of teenagers evaluated the whole planet? The whole oceans were covered by different groups. Those teenagers understood it, why don't you? There is also another exercise covering different months of a year. Every slice had its own tremendous variability and you can see that in Figure 1 and in the Argo site how all of them amount to a variable total. That is what I'm asking you to comment from figure 1 and by those means that you show a comprehension on the subject.
    0 0
  34. Alec Cowan #133 Alec, stop being coy and tell us all what is wrong with the K&D paper.
    0 0
  35. @Ken #134 Call me coy or paint me purple, but firstly you have to substantiate your assertion about Knox & Douglas using other than 0-700m layer in figure 1 and all 4 methods. How come you can quote some conclusion without giving the scope of that conclusion. For God's sake Ken, it's a 2-page paper with almost all mathematics stripped from it!! I'm telling you again, Knox & Douglas use 0-700m layer and refer papers dealing with not always the same layer. You are telling otherwise and you refuse to substantiate it just by reading the paper and copypasting what applicable to identify some piece of information. C'mon! Do you think that by labeling something OHC or Argo that matter is settled? C'mon, Ken! Don't insist with that '*deep ocean*' (what are those **** symbols? some kind of magic spell?) unless you can give direct evidence from the paper or compare its figures with Argo's site or other papers. I think you are worried because Knox & Douglas' goes very roughly on the same way Trenberth did when he talked of the "travesty" and your argumentation backfired.
    0 0
  36. Alec Cowan #135 Calm down Alec, the spray is amusing but fools no-one with the hyperbole and 'For God's sake don't you know that??' crude attempts at argument by intimidation. Just point out exactly the errors made in the K&D paper and where the numbers are wrong.
    0 0
  37. @Ken #136 Quit spamming, Ken! You simply cannot find K&D saying their own figures are for any deeper than 0-700m. If you could, you simply have showed it and pointed a finger at me. The fact that you didn't but you still have time for playing ping-pong here is self explanatory.
    0 0
  38. Alec Cowan #137 Spamming? What a bizzare allegation. "You simply cannot find K&D saying their own figures are for any deeper than 0-700m." Why would K&D need to quote only their 'own' figures for ocean depths other than 0-700m? The K&D paper summarises research by major major OHC content researchers including Willis, Lyman, von Schukmann, Wijffels, Purkey & Johnson et al....not just K&D. It quotes a positive warming in the deep oceans from a paper by Purkey & Johnson which can be found here: http://www.pmel.noaa.gov/people/gjohnson/gcj_3w.pdf Relevant quote from the abstract of the P&J paper: **The three southernmost basins show a strong statistically significant abyssal warming trend, with that warming signal weakening to the north in the central Pacific, western Atlantic, and eastern Indian Oceans. Eastern Atlantic and western Indian Ocean basins show statistically insignificant abyssal cooling trends. Excepting the Arctic Ocean and Nordic seas, the rate of abyssal (below 4000 m) global ocean heat content change in the 1990s and 2000s is equivalent to a heat flux of 0.027 (+/-.009) W m-2 applied over the entire surface of the earth. Deep (1000–4000 m) warming south of the Subantarctic Front of the Antarctic Circumpolar Current adds 0.068 (+/-.062) W m-2.** 0.027 + 0.068 = 0.095W/sq.m (my addition). So the overall conclusion of cooling or flat in the top 700m and slight warming in the deep oceans - none of it anywhere near the postulated 0.9W/sq.m global imbalance by the likes of Hansen is only contradicted by the von Schukmann 0-2000m result of +0.77W/sq.m which is the outlier in the group. The steep bumps in the von Schukmann chart indicate impossible rates of heat transfer over time as pointed out by BP in an earlier thread and the step jump in the 1993-2008 Lyman result of +0.64W/sq.m is also impossible if satellite precision (not absolute accuracy) is to be believed. Month to month and year on year TOA satellite data show that the step jump in OHC of 2001-2003 did not happen, which makes a linear trend fit of +0.64W/sq.m also impossible for 1993-2008 Lyman chart. So for now, K & D is out there to be refuted by later or more extensive OHC analyses, not rants and name calling from the bleachers.
    0 0
  39. "Trenberth's statement was used completely out of context by those behind the fake 'Climategate' scandal". Here is the full context of Trenberth's statement, just for reference. [private email snipped - if you really want to read them, they are easily available elsewhere]
    0 0
    Moderator Response: [Dikran Marsupial] Please do not post other peoples stolen private emails. The text of the email does not provide full context, the full context would include all of the conversations between all parties that meant Trenberth would be understood by his friends and colleagues without having to spell it out in formal scientific terms. Emails are often written in a hurry, rely on the reader's existing knowledge and often contain humour (yes scientists often have a sense of humour). The use of hyperbole and irony as humour is quite common for example. Stick to published comments please.
  40. @Berényi Péter #139 (although it'll probably be deleted and this one will become #139 because it "supposedly" ""publishes"" or """reveals""" stolen material -don't worry, there's some kind of crime there anyway-) Really BP? Let me see: Trenberth becomes chatty with a bunch of colleagues and comment why a swallow does make a summer in a laundrymat chatterbox style, then provides a link to a published paper as if it is a novelty and add "(A PDF of the published version can be obtained from the author.)" provided the link do give us a pdf. Then he said his famous mouthful. Later he involves in some speculations about PDO. And finally he shows he bought the car in Back to the Future by linking in October 12 2009 some ppt made in April 7 2011. What else?
    0 0
  41. BP... I just don't see how you guys can continually read that email and miss the two lines that follow it: " The CERES data published in the August BAMS 09 supplement on 2008 shows there should be even more warming: but the data are surely wrong. Our observing system is inadequate." Trenberth's papers say the same thing. Our observing systems are inadequate. They're not picking up all the warming. Trenberth has repeatedly stated that this is what he was talking about.
    0 0
  42. @Ken #138 I love when they play bonneteau -follow the bee, follow the lady, three-card trick, whatever it is called in your turf-. So let me summarize your post: 1)You cannnot present any evidence that Knox & Douglass' (double s) figures are any deeper than 0-700m because, in your own words,"Why would K&D need to quote only their 'own' figures for ocean depths other than 0-700m?", followed by a change of subject. Let's see it again in the way you wrote it:
    "You simply cannot find K&D saying their own figures are for any deeper than 0-700m." Why would K&D need to quote only their 'own' figures for ocean depths other than 0-700m?
    Your change of subject includes assorted content that is a hint that indeed you browsed the paper once more and tried to find what I asked but you couldn't. Regarding the part of your message I quoted, we say "y mi tía tenía una bicicleta" ("and my aunt used to have a bicycle"), the popular render of a non sequitur combined with the obvious { - snip -} evasion in the answer. 2)You played "where's the queen?" or "where's the little ball" with a couple of papers and by adding many many words like a snowstorm -or a snow job- you pretend there's something there that has indicial value What you said boils to 0-700m layer from Knox & Douglass for 2003-2008 (when the bottom is warming) and your appreciation of it cooling, plus some data from +4000m for 1990-2000 (when the surface is warming) from another paper, plus another chunk of data for 1000-4000m around the Pole with -no period declared, why you'd bother to-, and with this half cooked Frankenstein's monster you pretend to get some kind of a trend that, wait!, it confirm what you have been saying so far. Here your { - snip - } technique of chatting and chatting and chatting couldn't hide that the time span doesn't match, the sources are cherry picked and 700-1000m layer is set aside and 1000-4000m is set aside for 90-95% of the oceans. { - snip - } You may call yourself to silence now or you may use the technique of the manipulator and select isolated phrases of my message to try to make some fuzz of it and attempt to dilute the consequences of your blunder.
    0 0
    Moderator Response: [mc] Less invective, more science.
  43. #140 Alec Cowan at 02:00 AM on 20 April, 2011 And finally he shows he bought the car in Back to the Future by linking in October 12 2009 some ppt made in April 7 2011. Not really. Just does not know how to use proper revision control (which is a general problem with climate data maintenance). Some older versions are available here.
    0 0
  44. Alec Cowan #142 Your { - snip -} I have not. You don't even need K & D to show that nothing much in the way of OHC increase has been measured since the full deployment of Argo circa 2003-4. Lyman's 2010 chart "Robust Warming of the Upper Oceans" is pretty flat without the step jump of 2001-03 - so the +0.64W/sq,m trend is illusory. Robust it is not. Prior to that, XBT and other methods were woefully inadequate - so much so as to be pretty useless. With heat moving about in the oceans, to get a measure of increase, a snapshot of the whole ocean at time T1 must be compared with a similar snapshot at time T2. The gold standard in my opinion would be a tethered buoy system which measures the same 'tile ' of ocean as every other tile at the same instant in time, with wide coverage. The roughly 3500 Argo buoys move about, and no doubt coagulate with currents, so one could see that the same buoy might not measure the same tile, and indeed the same tile might not be measured at all if a buoy moves out and another does not replace it. Even with 3500 buoys, I calculated roughly 1 buoy for every 100,000 sq.km of ocean which is a 320 x 320km box of ocean for 1 temperature measurement traverse. For sure the greater deployment of numbers would improve the accuracy of Argo measurement, however I have not seen how well it approaches the 'gold standard'. Some food for thought Alec - please feel free to offer some actual numbers sometime rather than your souffle of hyperbolic cant.
    0 0
    Moderator Response: [mc] less invective, more science.
  45. @Berényi Péter #140 So we are sure now, because of your intervention, that the supposed Trenberth's mail that you posted -now deleted- was false in one content at the very least. Sure, the famous e-mail starts with "Hi all" in your version, "Hi (say Johny)" in Gilles' and so on. In your version Trenberth announces a paper of his and provide a link -with the absurd text I already commented- instead of doing what any of us do regarding a pdf, that is to attach it to the e-mail which is the educated way to do it. Also in your version he makes a specif reflexion and points to the actual version of a ppt made for the public without even bothering in pointing which slide contains the information he's commenting, as if he has no access to graphics and information -neither his addressees- in a way he should rely in the time and availability of figures in the web -yet without bothering to point to the proper content-. Also your version doesn't contain the same as Gilles' does neither both contains the words quoted by Rob Honeycutt. So which one is The Email? We are to trust the (thief/terrorist/hacker/pranker/superhero choose your word and it'd probably change the trustworthiness of his or her, wouldn't it?) who got it and the gentlemanly conduct of everyone in the chain that ends with you or Gilles? Why doesn't coincide the content is both are equally gentlemanly? Must it be "the other one"? Or are we to trust what Trenberth says the email is. Oh, yeah! the superhero got it right and now Trenberth continue to be to part of some kind of cover-up. Is that your theory?
    0 0
  46. @Ken #144 "You don't even need..." Are you changing course yet again? So you are abandoning your previous mishapped argumentation (look #138 and previous posts from Ken Lambert) and now you have decided to play with Ocean Heat Content as if it is Total Ocean Heat Content and not 0-700m's. That is back to square one on your part because that was what you were saying on the very beginning -though you fully understand it just now-. So it takes us back to what "the travesty" in Trenberth's meaning might really be: aerial and spatial measurements with some error margins give us an accumulation of heat that we can partially account in different places with not discordant error margins. We have an important difference and some equally important parts of the system that can contain that difference have wider error margins or are monitored in a more sporadic or uncertain fashion. We can't account by the moment for the planetary energy budget in the way we should -nearly real time, coherent error margin-. That is a travesty. I'm going to translate it for you in an everyday's fashion: Johnny: I though I had 1,000$ in different places and I only found $600 and I can't find the key to access the place where I know there's more money Pseudo-skeptic: Johnny is lying, he has no money and they told me that in fact he has gambling debts. So the current post -and its comments- is all about what Johnny said. All your toing and froing is to prove that he has no money or he has gambling debts as a part of a wide group that behaves that way. You've failed so far in doing so.
    0 0
  47. Alec Cowan #145,146 Not a number or reference to any new OHC research in either of you posts Alec. I can only assume that you don't have any facts to argue and are engaged on a rambling randon walk through the topic.
    0 0
  48. Typo "random walk"
    0 0
  49. #145 Alec Cowan at 23:34 PM on 20 April, 2011 So which one is The Email? As it is not allowed to publish "other peoples stolen private emails" at this site, that question will not be discussed here. I do not think "private email" is a proper characterization of correspondence between government employees (or scholars working on government grants) during office hours using their work email addresses, but ( -Snip- ) Anyway, the thread including Trenberth's travesty was started by Narasimha D. Rao, PhD Candidate at Emmett Interdisciplinary Program in Environment and Resources (E-IPER), Stanford University, student of the late prof. Stephen H. Schneider, who denounced Paul Hudson, BBCs reporter on climate change to his mentor on Sunday, October 11, 2009 at 18:25:53 UTC in an email for publishing the article titled What happened to global warming? at the BBC site on Friday, 9 October 2009 15:22 UTC. Prof. Schneider elected to forward the message on Monday, 12 October 2009 at 22:32 UTC (14:32 local time) to the Team, encouraging them to "straighten this out" in an op-ed response. What follows is the discussion of this question by various Team members including Distinguished Senior Scientist Dr. Kevin Trenberth. That's the context.
    0 0
    Moderator Response: [DB] Moderation complaints snipped.
  50. @Ken #147 Yeah, Ken! We get it. No need for #148. You are not replying to my #145 as you put there. Regarding #146, change your attitude of trying to bring everything to a King Arthur's set and do either these thing: Please yourself in NOAA's site and Argo. Use the search features in this site to find the many posts and arguments where (total) ocean heat content is dealt. You'll find a lot of figures there. Once selected the proper place, start there a debate about "figures" and invite me to provide there. You don't even need to say it because I'd found it in the recent comments section. Be aware that by doing so you'd loose [erratum in next comment: "lose"] the shield that provides you here the fact of being off-topic so many would reply your comments there, not just me. And that's the crux regarding the tale of comments here (and the second "thing"): It looks like you still don't realize the topic of this post and its comment section: The e-mail 'scandal' travesty in misquoting Trenberth on "the lack of warming" which relates to what Trenberth's said and doesn't relate to each instance that can be labeled as a "the lack of warming" and that you can pull out of the hat, no matter it is verbatim, fully figure dependent or whatever. You may say that the planet's atmosphere, hydrosphere and 5 outer metres of the lithosphere have lost some 1022Joules of heat from February 2010 to August 2010, and I'll happily agree that you are lastly being reasonable, but would you be on-topic. I'm afraid not. There's no clearer way to state that you haven't got the topic yet than reading my #146 (The paragraph starting with "So it takes us back to what "the travesty" in Trenberth's meaning might really be...") and reading your reply in #147 calling it all "...don't have any facts to argue and are engaged on a rambling randon walk through the topic". That speaks volumes. Read my next reply to another participant who is much more on-topic.
    0 0

Prev  1  2  3  

You need to be logged in to post a comment. Login via the left margin or if you're new, register here.


The Consensus Project Website

THE ESCALATOR

(free to republish)


© Copyright 2024 John Cook
Home | Translations | About Us | Privacy | Contact Us