Climate Science Glossary

Term Lookup

Enter a term in the search box to find its definition.

Settings

Use the controls in the far right panel to increase or decrease the number of terms automatically displayed (or to completely turn that feature off).

Term Lookup

Settings


All IPCC definitions taken from Climate Change 2007: The Physical Science Basis. Working Group I Contribution to the Fourth Assessment Report of the Intergovernmental Panel on Climate Change, Annex I, Glossary, pp. 941-954. Cambridge University Press.

Home Arguments Software Resources Comments The Consensus Project Translations About Support

Twitter Facebook YouTube Mastodon MeWe

RSS Posts RSS Comments Email Subscribe


Climate's changed before
It's the sun
It's not bad
There is no consensus
It's cooling
Models are unreliable
Temp record is unreliable
Animals and plants can adapt
It hasn't warmed since 1998
Antarctica is gaining ice
View All Arguments...


Username
Password
New? Register here
Forgot your password?

Latest Posts

Archives

How would a Solar Grand Minimum affect global warming?

Posted on 16 June 2011 by John Cook

Solar physicists have issued a prediction that the sun may be entering a period of unusually low activity called a grand minimum. This has climate skeptics speculating that solar 'hibernation' may be our get-out-of-jail-free card, cancelling out any global warming from our CO2 emissions. However, peer-reviewed research has examined this very scenario, "On the effect of a new grand minimum of solar activity on the future climate on Earth" (Feulner & Rahmstorf 2010). What they found was even if the sun fell into a grand minimum, global temperature would be diminished by no more than 0.3°C. The sun is not our get-out-of-jail-free card.


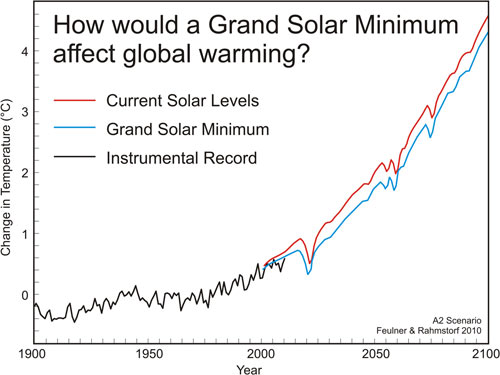
Figure 1: Global mean temperature anomalies 1900 to 2100 relative to the period 1961 to 1990 for the A2 scenario. The red line represents temperature change for current solar levels, the blue line represents temperature change at Maunder Minimum levels. Observed temperatures from NASA GISS until 2010 are also shown (black line) (Feulner 2010).

Feulner 2010 simulates what would happen if the sun fell to Maunder Minimum levels in the 21st Century. To include the effect of greenhouse gas emissions, they assume either A1B or A2 scenarios (IPCC TAR). A1B is a more optimistic scenario where carbon dioxide emissions continue to rise in the early 21st Century, stabilise mid-century then fall in the latter-21st Century. A2 is somewhat more pessimistic, projecting carbon dioxide emissions to continue growing throughout the 21st Century. Unfortunately, the latest data on CO2 emissions indicates we're tracking towards the worst case scenario.

Two methods are used to determine how low total solar irradiance (TSI) fell during the Maunder Minimum. Ice core measurements of beryllium indicate a less variable TSI while modelling from solar magnetic flux show a greater decrease in TSI during the Maunder Minimum. In Feulner 2010, both solar reconstructions are used as shown in Figure 2 below. The magenta lines are for the A2 emission scenario, the red line for the A1B scenario.

The important feature is the comparison between the solid line (with no solar change) to the dotted and dashed lines (the two Maunder Minimum scenarios). Just to be conservative (James Hansen was right!), in Figure 1 above, I used the version with more solar variability in order to show the option where the solar minimum has the greatest effect.


Figure 2: Global mean temperature anomalies 1900 to 2100 relative to the period 1961 to 1990 for the A1B (red lines) and A2 (magenta lines) scenarios and for three different solar forcings corresponding to a typical 11-year cycle (solid line) and to a new Grand Minimum with solar irradiance corresponding to recent reconstructions of Maunder-minimum irradiance (dashed line) and a lower irradiance (dotted line), respectively. Observed temperatures from NASA GISS until 2009 are also shown (blue line) (
Feulner 2010).

For both the A1B and A2 emission scenario, the effect of a Maunder Minimum on global temperature is minimal. The most likely impact of a Maunder Minimum by 2100 would be a decrease in global temperature of 0.1°C with a maximum reduction of warming by 0.3°C. Compare this to global warming between 3.7°C (A1B scenario) to 4.5°C (A2 scenario).

Update 16 June: I've added the Figure 1 Grand Solar Minimum graphic to our list of high-rez graphics, free to use on other websites.

Update 17 June: Many thanks to DaneelOlivaw who created a Spanish version of Figure 1 (note - one of these days, I'll reprogram the Climate Graphics resource so it'll be possible to add translations).

0 0

Printable Version  |  Link to this page

Comments

1  2  3  Next

Comments 1 to 50 out of 101:

  1. Interesting paper (on french web site). I was wondering what the downward blip was and it is apparently one or more volcanoes which can coincide with solar minima (reference was made to this paper http://www.mpimet.mpg.de/fileadmin/staff/claussenmartin/publications/bauer_al_1000_grl_03.pdf)
    0 0
    Response: The downward blips over the 21st Century are volcanic eruptions randomly distributed (matching similar eruptions in the 20th Century). This was necessary to avoid artificial drift of the model from an unnatural lack of volcanic forcing.
  2. The flaw in the Fuelner paper is that he is concentrating on TSI, rather than the other items that the sun provides that affect climate. From Earth Shine, it is known that the albedo of earth has increased as of late. Global cloud cover has increased by approx 4%, and the jet streams have moved markedly south in the NH for this time of year. Dr. Svelsgaard will be having a paper published in the near future that shows the variation in TSI to be extremely small in the past 1,000 years. So, now that we know that TSI is relatively constant, it is very apparant that the other forces from the sun require careful scrutiny and study. Early results from CERN are showing that Dr. Svensmark is correct about gamma rays and clouds. Earth shine would seem to confirm this.
    0 0
  3. Curious why John thinks that the solar minimum (if it were to occur) would have such a slight effect on temperatures, when NASA (and others) have shown a much higher temperature decrease during the Maunder minimum.
    0 0
    Response:

    [DB] Where was the anthopogenic CO2 spike comparable to that of the modern era during the Maunder Minimum?

  4. Eric the Red: wasn't there also a period of extended volcanic activity concomitant with the Maunder Minimum? I cannot remember that detail, but for some reason I think I've heard that somewhere. Anyways, John is referencing the conclusions of Feulner 2010, so it's not like this is his own out-of-thin-air guess. Also, the link to Feulner 2010 needs a subscription to AGU, which I'm assuming a lot of us don't have. This link works (don't know how to hyperlink here): http://www.pik-potsdam.de/~stefan/Publications/Journals/feulner_rahmstorf_2010.pdf
    0 0
    Response:

    [DB] Hot-linked URL (hyperlinking tips here).

  5. Eric the Red, to not leave my statement so vague, Robock 1979 and the more recent Crowley 2000 concluded that increased volcanism had an impact as well.
    0 0
  6. The forcing in CO2 by 2020 is easily going to swamp any relatively small changes in the TSI, that was obviously not the case during the LIA when CO2 was near 280 ppm and volcanism was also unusually high. And people keep desperately hanging onto yet another extremely tenuous solar-related affects such as GCR (more about them here). The GCR argument is also a red herring. Heck the 'skeptic' tactic seems to be to throw as much stuff out there and hope that something might just stick. I don't understand why the skeptics are so excited about this, this finding is nothing new really, solar scientists expected that this solar cycle would be relatively quiet and that the downward trend ay continue, and now the "skeptics" are feigning surprise and excitement, because this after allis the silver bullet that will mean we can continue with BAU...umm, no. Also, by proclaiming an impending ice age as several 'skeptic' outlets have done, they are really painting themselves into a corner and setting themselves up for a fail, because the long-term warming will almost certainly continue, and their ridiculous claims of impending global cooling or an ice age will look incredibly stupid come 2020. Also, in 2010 global temperature records tied for the record highs despite the prolonged solar minimum and a developing record strength La Nina....again, solar is only a bit player compared to GHG forcing. Note also that the TSI and global SAT have been diverging the last 50 years or so. [Source: SkS] As for EarthShine data, SkS has also discussed that here. I would like a peer-reviewed reference to support the claim that global cloud cover has increased by 4%.
    0 0
  7. Alex C @4, you are correct about the volcanic forcing. You may want to check out Hegerl et al 2006 for more details. They show a total solar forcing for the Maunder Minimum of around -0.25 W/m^2, corresponding to a 0.2 degree C decline in temperatures after feedbacks, and with a larger volcanic forcing.
    0 0
  8. Further to my @7, Hegerl et al also show an approximately 0.25 W/m^2 increase in solar forcing in the current "Grand Maximum". This is consistent with the change in insolation shown in the graph Albatross presents. Therefore the total difference in forcing between a Grand Maximum and a Grand Minimum is just 0.5 W/m^2 or 0.4 degrees C at equilibrium, and closer to 0.25 degrees as a transient increase. To put that into perspective, that is half of the total increase in radiative forcing from anthropogenic GHG emissions between 1979 and 2009. So, in rough terms, a decline from a Grand Solar Maximum to a Grand Solar Minimum would merely delay temperature increases due AGW by around 15 years, assuming the rate of increase in GHG emissions remains constant.
    0 0
  9. I find a solar minimum to be very frightening, if the end result is to delay scaling back CO2 emissions (by further masking the effects of CO2), and if that solar minimum lasts for less than one thousand years (which means we'll emit way more than we should have and otherwise would have, but ultimately the level of warming will be the same, once the sun wakes up and the CO2 is still there, patiently waiting).
    0 0
  10. Adding to what Sphaerica posted, if a potential solar minimum is used as an excuse to keep on emitting CO2, we'll get bigger and bigger problems with ocean acidification - global warming's evil twin.
    0 0
  11. Kudos to John Cook for promptly addressing this issue so promptly!
    0 0
  12. I didn't think the Maunder Minimum lasted 100 years, I thought it was only for around 70 years. How much is known from earlier centuries about solar minima? Now if we got an increase in volcanic activity at the same time that could be very bad for future generations. The initial emissions would presumably mask warming further and the extra CO2 would add to later warming, plus people might be inclined to delay the shift from fossil fuels. End up with a big shock at some stage. BTW - kudos to you, John, for getting this up so quickly. There is a lot of rubbish being posted around the traps and your article explains things very clearly.
    0 0
  13. "The flaw in the Fuelner paper is that he is concentrating on TSI, rather than the other items that the sun provides that affect climate." The only problem is that the various unicorn hypotheses have no known physics behind them. "From Earth Shine, it is known that the albedo of earth has increased as of late. Global cloud cover has increased by approx 4%, and the jet streams have moved markedly south in the NH for this time of year." Yes, La Niña, [-snip-] happens. Gosh. "Dr. Svelsgaard will be having a paper published in the near future that shows the variation in TSI to be extremely small in the past 1,000 years." Which is totally congruent with the mainstream POV that a solar minimum will have a small effect compared to CO2 forcing. "So, now that we know that TSI is relatively constant, it is very apparant that the other forces from the sun require careful scrutiny and study." Or maybe the engineers who build CO2 lasers know what they're doing (not surprising, since they work, after all). "Early results from CERN are showing that Dr. Svensmar" Early results from CERN showed chamber surface pollution of results, and nothing from CERN has shouted "climate science is a fraud!". The CERN researchers are still struggling to show any result that might be relevant, even in a minimal way. Meaning it's a bit to early to stare at our CO2 lasers going ... "need to throw you away, you don't really work!!!!"
    0 0
  14. Mod, thanks. I just noticed that the paper says the same. The paper also acknowledges that TSI is perhaps an oversimplification. They seem to think that solar spectrum changes manifest more as short term factors in solar cycles (which then balances out) than as an effect that would be prominent in a deep minimum. They don't mention solar magnetic except as a proxy for TSI. My view is spectral effects are a complete unknown and magnetic effects are only barely understood. Neither translates to a forcing of any consequence in a simple GCM. People like Lockwood (e.g. http://www.eiscat.rl.ac.uk/Members/mike/publications/pdfs/2010/267_Woollings_2010GL044601.pdf) show the effect as weather pattern changes like blocking, not forcing changes. Certainly the blocking in the recent past has shown to lead to localized Arctic warming and associated warming feedbacks. But there may be more dramatic weather pattern effects with a deeper minimum that may cause cooling or, more likely, change the sensitivity to CO2 doubling. If nature decides to run that experiment, it will interact in interesting ways (for weather forecasters) with CO2 warming and associated moisture.
    0 0
  15. Albatross #6 Temperature should be roughly proportional to energy added to the system - which is the time integral of TSI. You should show curve of the integral of TSI wrt time in comparison with temperature. If TSI of 1365.5 is your baseline then the TSI-time integral will be roughly linear upward - roughly matching your temperature curve.
    0 0
  16. Sphaerica, I would agree with your statement that it would be frightening if a grand solar minimum resulted in a large temperature decrease masking a less large temperature increase from CO2. Temperatures were particularly depressed in the U.S. and Europe during the Maunder. http://earthobservatory.nasa.gov/IOTD/view.php?id=7122 If a grand minumium occurred, and it was insignificant, then the role of the sun would be largely removed as a climate driver. The following paper does a nice job of comparing solar activity to different temperature reconstructions (Mann and Moberg). From a purely scientific viewpoint, another grand minimum would present an excellent opportunity for solar-related climate research. http://www.acrim.com/Reference%20Files/Scafetta%20&%20West_Phenomenological%20reconstructions%20..since%201600.pdf
    0 0
  17. Ken Lambert "Temperature should be roughly proportional to energy added to the system - which is the time integral of TSI. You should show curve of the integral of TSI wrt time in comparison with temperature. If TSI of 1365.5 is your baseline then the TSI-time integral will be roughly linear upward - roughly matching your temperature curve. " Minus, of course, the integral of TOA radiation to space. Otherwise the pure integral of TSI would result in a surface temperature cooking us millions (billions) of years ago. The increasing difference between TSI and temperature trends indicates that TOA radiation has decreased in relation to temperature, increasing energy accumulation/temperature, which would be the effect of GHG's. Your insistence on treating the climate as a single variable system (TSI), without considering other forcing changes, continues to lead you astray.
    0 0
  18. Why does Mr. Cook keep pushing the (Feulner & Rahmstorf 2010) paper as some sort of silver bullet, non-refutable proof that an extended period of unusually low solar activity would cause a decrease in global temperature of no more than 0.3 C? I have made several posts demonstrating the weak assumptions and speculative conclusions that this paper reports. And the links to the original paper are still not working, Feulner & Rahmstorf 2010. The paper assumes a minimal response to reduced solar irradiance (0.025 C), an enhanced response to CO2 doubling of 3.4 C (from A. Levermann, private communication, 2010). Plug these assumptions into the CLIMBER-3a model, and the model results support the assumptions. This result is a faulty form of reasoning that assumes the conclusions in the premises, i.e., circulus in probando. The conclusions here are speculative, not even close to being a silver bullet. The argument is still wide open, the effects of an extended period of unusually low solar activity on subsequent global temperatures. And Mr. Cook seems intent on continuing to push the PMOD solar data when the LASP data shows a better representation of TSI. The TIM instrument has measured a lower and more accurate TSI (1360.8) for solar min than PMOD and the LASP historical TSI reconstructions show no decrease in TSI levels over the last three solar cycles (21-23). But cycle 24 is indeed unusual and time will be the best laboratory to study the impacts on climate.
    0 0
  19. Where can I find a plot of TSI over a geological timeframe?
    0 0
  20. The latest findings about the causes of solor storms.... "Scientists Prove Existence of ‘Magnetic Ropes’ that Cause Solar Storms" ScienceBlog, June 15, 2011
    0 0
  21. thepoodlebites: I just downloaded the annual data from your link and applied a linear fit to the data from the minimum which started cycle 21 to the minimum that ended cycle 23 - there is a very weak decrease in overall TSI during this interval (-0.001452 W/m^2/year). From eyeballing it, it does not seem like it is as much of a drop as shown in the PMOD data, but there is still a slight decrease. I'm going to go have a look-through how I can add in graphics here to give you the figure...
    0 0
  22. Arkadiusz Semczyszak - It is well worth considering the relative scale of the forcings. TSI changes for a long term minimum will be on the order of about -0.25 to -0.5 W/m^2; this is equivalent in scale to about 15 years of GHG accumulation. Forcing changes due to greenhouse gas accumulation for a doubling of CO2 are 3.7 W/m^2. Considering our continuing emission of greenhouse gases, a prolonged minimum will only delay global warming by about 15-20 years. And we will have to deal with "...the duration of the forcing with potentially larger effects for longer lasting or repeated forcings.”, as you put it.
    0 0
  23. thepoodlebites: Hm, well I uploaded the graph (Excel) in question to Flickr, it's here for viewing.
    0 0
  24. Badger #20 - see Solar Hockey Stick
    0 0
  25. thepoodlebites, The paper also assumes a direct response to total solar irradiance, which does not result in a large temperature response. The other papers show a much larger response, and the temperature record seems to agree with those. Overall, Cook seems to be using a temperature response which is definitely on the low side.
    0 0
  26. Everyone, just hold your horses. This is about a predicted decrease in sun spot activity, now even that prediction has come under critique by a respected solar scientist, Dr. Biesecker here and here, and at least one other solar scientist. I suggest that John update the main post to reflect this. Also of note, Dr. Beisicker asks "One question I have for myself is whether in fact plage regions, which are bright, continued to occur, even during Maunder Minimum? There would have been no way to observe them and if they do occur, then we would still have a solar irradiance cycle." The abhorrent behaviour shown by "skeptics" over this issue the last day or two is sadly typical behavior for "skeptics" (and those in denial about AGW), pouncing on every tenuous and sometimes even hypothetical straw which might suggest that we can continue to dumping GHGs in to the atmosphere, and anything, or that we might be facing imminent cooling. Got to keep that cooling meme going.
    0 0
  27. Poodle, You allege, "I have made several posts demonstrating the weak assumptions and speculative conclusions that this paper reports." If you are so confident in your results then, please instead of lamenting on a science site, work up your analysis, write it up and then submit it to a reputable journal peer-review to challenge Feulner and Rahmstorf. At that point, should it get published, scientists will pay serious attention. Until then you are just an anonymous person posting on the web you claims to have it all figured out and why the experts are wrong, and trust me, there are many people making those claims, on every scientific field, not just solar science. It would help your case if you at least cited some reputable scientific literature to back up your case. The fact that you are reticent to do so, leads me to think that rather than being interested in understanding and advancing the science you role here it rather to argue for the sake of arguing, or to obfuscate or to fabricate debate, or perhaps all three. And ironically, the one and only silver bullet being flown here is the hypothetical silver bullet and favourite contrarian and "skeptic" argument that AGW is because of "The Sun", or GCRs or internal climate variability, or leprechauns, whatever 'silver bullet' de jour happens to be on the menu.
    0 0
  28. KR @17, Thanks.
    0 0
  29. Ken (#15) - I think you're missing something, or you're not being particularly clear. TSI already includes time in the definition, given that it's a measurement of power (W/m2), not energy. Power is energy integrated over time (1 J/s = 1 W). The thermal properties of heat capacity and thermal conductance (resistance) define how power relates directly to temperature in conductively cooled/heated systems, and there is no further integration of power over time. Similarly, in radiatively cooled/heated systems, P=σT^4, where σ (Stefan-Boltzman constant) has units of W/m^2·K^4. Again, no integration time, again because power already includes integration. Albatros' image is just fine.
    0 0
  30. Also see Joe Romm's blog post on this topic.
    0 0
  31. @Albatross #7: Kudos on your repsonse to Poodle. BTW, Joe Romm is now using the word "disinformer" rather than "denier." Perhaps we should follow suite?
    0 0
  32. And enter into the fray, a delightful and invective-filled rant by denier of AGW, Mr. Lorne Gunter at the infamous National Post newspaper. This is how "skeptical" journalists, with agendas, continue to massacre the science. "Skeptics" must be proud to have ideologues and disinformers like Gunter on their side...
    0 0
  33. Albatross@32 WOW. The lack of understanding represented in that article is staggering. Disinformer is an extremely accurate descriptor.
    0 0
  34. 16, Eric the Red,
    If a grand minumium occurred, and it was insignificant, then the role of the sun would be largely removed as a climate driver.
    I'm not sure what you mean by that. The sun is clearly a climate driver... it's the energy input into the system, so notable variations in solar output will always have some effect. In a system without us mucking up CO2 levels, it would be the main and possibly only normal short term climate factor. But CO2 is going to overwhelm the sun as a climate driver in coming centuries. And there has been no impact by the sun on recent temperature increases. We don't need a solar minimum with rising temperatures to prove this. It's been proven already. [See the #2 denier argument, It's the Sun by clicking that link, or following the cute little denial thermometer at the top right of every SkS page.] My sole point is that the effect of a minimum in even marginally slowing climate change would have a very bad effect on human nature, allowing people to deny and delay even longer, while there would be no long term savings from such a minimum, because it would inevitably come to an end before all of the added CO2 has fallen out of the atmosphere.
    0 0
  35. [Oops, the denial thermometer is at the top left of every Sks page]
    0 0
  36. In the comments Leif Svalgaard (#2, #13) and GCR are mentioned a couple of times (#6, #27). I came across some interesting remarks of Svalsgaard regarding the GCR theory. He does not seem to have a high opinion of this theory. http://tinyurl.com/3ss3ux2 : "Cosmic rays have not changed their trend since at least 1952 while temperatures have. The albedo [clouds] the past 10 years has not varied with the comic ray flux. So, in general, it looks to me that there is little support for the theory." On http://tinyurl.com/44bhy7z : " So, for me, there is precious little observational evidence for the GCR theory."
    0 0
  37. Interesting to see how this story is being played out by the denial media spin machine. Apparently Lorne Gunter and Solomon (another denier of AGW) are a duo. Not to be outdone Solomon has written this garbage (note the headline)-- and they get paid to do this folks. Fortunately, Peter Sinclair has this piece. Note what the actual authors of the study say: "...contrary to some media reports, this does not mean a new Ice Age is coming, Frank Hill of the National Solar Observatory said in a telephone interview. “We have not predicted a Little Ice Age,” Hill said, speaking from an astronomical meeting in New Mexico. “We have predicted something going on with the Sun.”" Is your head spinning yet? Mine sure is.
    0 0
  38. And on a better note, the BBC has done a well-written, well-balanced piece Good to see.
    0 0
  39. John, I've made a spanish version of that graph. It may be of use: http://i.imgur.com/bBa4T.jpg
    0 0
    Response: Cool, have updated the post linking to it. Thanks!
  40. Angliss #29 "Power is energy integrated over time (1 J/s = 1 W)." Sorry Angliss - you have got that back to front. Energy is Power integrated over time. Hence my point that we should look at the ""Excess"" TSI above the baseline of say 1365.5 integrated over time to get the energy available to warm the Earth system. KR #17 Of course we are talking of TSI 'differences' here KR. The outgoing OLR will rise with S-B to restore equilibrium. The point is that a constant elevated TSI above an 'equilibrium' value will equate to a linearly increasing amount of energy as measured by the area under the forcing curve.
    0 0
  41. Ken Lambert #40, But what would that tell us? The energy available and the energy that actually accumulates are different matters, and if you want to argue that increased solar output is at all responsible for the temperature increase we have seen over the past few decades, then you must show both that the difference between the power-in and power-out curves is increasing with time, and that the power-in curve integrates to be a power above the temperature trend (as a power-out curve that decreases with time will also lead to an increasing integral difference).
    0 0
  42. Adelady @38, Thanks for that link. Better, but not persuasive enough IMHO. The comment thread is depressing, D-K and conspiracy central, although some brave souls are standing up for the science.
    0 0
  43. Ken Lambert @40, an elevated TSI over a specific rate will only result in increasing accumulated energy if there is no elevation of the OLR to compensate. As an increased surface temperature will increase OLR all else being equal, simply integrating albedo adjusted TSI less a constant will not even approximate to the increase in heat energy in the Earth's climate system. That is, it will not do so unless some other factor is decreasing OLR relative to surface temperature at an appropriate rate. Would you care to make a suggestion as to what that other factor might be?
    0 0
  44. Ken Lambert - "The point is that a constant elevated TSI above an 'equilibrium' value will equate to a linearly increasing amount of energy as measured by the area under the forcing curve." Certainly, if the sun were constantly rising in TSI, perhaps on it's way to a red giant status, that would be true. It is not - why is this relevant to a discussion of a finite drop in TSI in a Grand Minimum? A step rise in TSI (all other things remaining equal) will cause a rise in temperature and hence TOA radiation until the imbalance is addressed - at which point there is no continuing change in temperature or energy in the climate system, as it has reached a new equilibrium. The data shown in the graph Albatross posted clearly demonstrates that something other than TSI is in play, due to the divergence of the TSI and temperature trends - and that something else is primarily GHG's. As Tom Curtis pointed out, your statements in this regard are far more topical on the Solar activity & climate: is the sun causing global warming or It's the sun threads.
    0 0
  45. KR #44 "A step rise in TSI (all other things remaining equal) will cause a rise in temperature and hence TOA radiation until the imbalance is addressed - at which point there is no continuing change in temperature or energy in the climate system, as it has reached a new equilibrium." Which also applies to the sum of the other radiative forcings causing temperature rise in the climate system. You still are not grasping the fact that if the TSI rises and remains at an elevated level - not necessarily 'rising in TSI' - then the extra energy added is the area under the forcing curve above the starting level. "The data shown in the graph Albatross posted clearly demonstrates that something other than TSI is in play, due to the divergence of the TSI and temperature trends - and that something else is primarily GHG's." No it does not. The integral wrt time of the TSI above the start level will be a rising curve roughly tracking the temperature curve.
    0 0
  46. Ken Lambert wrote: "Which also applies to the sum of the other radiative forcings causing temperature rise in the climate system." yes, radiative forcing due to CO2 is rising. If it were merely raised from its pre-industrial level and then held constant, that would also mean "the extra energy added is the area under the forcing curve above the starting level", but it wouldn't cause temperatures to continually rise would it? CO2 radiative forcing is no different from solar forcing in that respect.
    0 0
  47. 45, Ken, Too much hand waving. Do (and present) the math, explain your reasoning in detail, and demonstrate your point (as Feulner & Rahmstorf have done). Without that, it's all conjecture and opinion. It's you claiming that Feulner & Rahmstorf are wrong, and you're right, without actually doing anything to demonstrate that you have anything of serious substance beyond a strong opinion that says they're wrong and you're right.
    0 0
  48. I blogged about this at Science Blog: Please stop by and add your voice. Scientifically yours, "Dr. Fred" Bortz
    0 0
  49. Ken #40: I rechecked my Physics 101 text, and it appears that I got the order of definition incorrect as you pointed out.
    0 0
  50. Nice blog Fred. I am glad to see that you have considered several avenues that could result from a solar minimum.
    0 0

1  2  3  Next

You need to be logged in to post a comment. Login via the left margin or if you're new, register here.


The Consensus Project Website

THE ESCALATOR

(free to republish)


© Copyright 2024 John Cook
Home | Translations | About Us | Privacy | Contact Us