


 Arguments


2016 SkS Weekly News Roundup #35
Posted on 27 August 2016 by John Hartz
A chronological listing of the news articles posted on the Skeptical Science Facebook page during the past week.
Sun Aug 21, 2016
- 91,000 Electric Cars Sold In Europe In 1st Half Of 2016 by James Ayre, Clean Technica, Aug 20, 2016
- No-name storm dumped three times as much rain in Louisiana as Hurricane Katrina by Jason Samenow, Capital Weather Gang, Washington Post, Aug 19, 2016
- As Louisiana floods rage, Republicans are blocking modest climate action, Op-ed by Raúl M Grijalva, Guardian, Aug 19, 2016
- Inuit fear they will be overwhelmed as ‘extinction tourism’ descends on Arctic by Robin McKie, Observer/Guardian, Aug 20, 2016
- Britain is only just beginning to exploit its vast resources of offshore wind by Simon Watson, The Conversation UK, Aug 18, 2016
- English Village Becomes Climate Leader by Quietly Cleaning Up Its Own Patch by Tatiana Schlossberg, New York Times, Aug 21, 2016
- Naive empiricism and what theory suggests about errors in observed global warming by Victor Venema, Variable Variability, Aug 21, 2016
- Arctic sea ice is vanishing far faster than anyone thought possible by Robert Ferris, CNBC, Aug 19, 2016
Mon Aug 22, 2016
- Searching for Climate Signals in an Epic Flood by Hunter Cutting, Nexus Media, Aug 19, 2016
- Trump’s Anti-Science Campaign by Lawrence M Krause, The New Yorker, Aug 21, 2016
- Antarctic Krill Habitat Could Decline By 2100 Due To Climate Change by Elaine Hannah, Science World Report, Aug 17, 2016
- Law firm calls out Soco and Cairn over climate risk reporting by Pilita Clark, Financial Times, Aug 22, 2016
- ‘Climate change is water change’ — why the Colorado River system is headed for major trouble by Chelsea Harvey, Energy & Environment, Washington Post, Aug 19, 2016
- Historical documents reveal Arctic sea ice is disappearing at record speed by Dana Nuccitelli, Climate Consensus-the 97%, Guardian, Aug 22, 2016
- A widening, 80 mile crack is threatening of Antarctica’s biggest ice shelves by Chris Mooney, Energy & Environment, Washington Post, Aug 22, 2016
Tue Aug 23, 2016
- Trump’s Climate Proposals = “Existential Threat To This Planet,” Michael Mann States by Steve Hanley, Clean Technica, Aug 22, 2016
- In Streak of Extreme Storms, What’s the Role of Warming? by Andrea Thompson, Climate Central, Aug 22, 2016
- Climate change will mean the end of national parks as we know them by Oliver Milman, Guardian, Aug 22, 2016
- Al Gore begs climate change activists not to vote third party: ‘Look carefully at the consequences by Sarah K Burris, Raw Story, Aug 22, 2016
- Report Shows Whopping $8.8 Trillion Climate Tab Being Left for Next Generation by Lauren McCauly, Common Dreams, Aug 22, 2016
- A big question complicating the climate debate: Are current policies only benefiting the rich? by Liam Dillon, Los Angles Times, Aug 22, 2016
- Coal Lobbying Groups Losing Members as Industry Tumbles by Zahra Hirji, InsideClimate News, Aug 23, 2016
- Keeping global warming to 1.5C, not 2C, will make a crucial difference to Australia, report says by James Whitmore & Michael Hopkin, The Conversation AU, Aug 23, 2016
Wed Aug 24, 2016
- New Membrane Could Save $2 Billion a Year for U.S. Industries by Umair Irfan, ClimateWire/Scientific American, Aug 23, 2016
- America’s First Offshore Wind Farm May Power Up a New Industry by Justin Gillis, New York Times, Aug 22, 2016
- It's hard to talk about climate change. This storytelling project wants to make it easier. by Lauren Katz, Energy & Environment, Vox, Aug 22, 2016
- Climate change will create new ecosystems, so let’s help plants move by Ari Hoffmann, The Conversation AU, Aug 23, 2016
- Maps Show Humans’ Growing Impact on the Planet by Betsy Mason, National Geographic, Aug 23, 2016
- Governor declares emergency in 20 Washington counties hit by wildfires by Nicholas K Geranios, AP/Seattle Times, Aug 23, 2016
- Global warming and the race for the White House by David Shukman, BBC News, Aug 24, 2016
- Human-caused climate change has been happening for a lot longer than we thought, scientists say by Chelsea Harvey, Energy & Environment, Washington Post, Aug 24, 2016
Thu Aug 25, 2016
- Global warming: Good for big whales by Adam Popescu, Alaska Daily News, Aug 23, 2016
- California's climate change law clears a big hurdle after lobbyists crank up pressure by Chris Megerian, Melanie Mason & Liam Dillon, Los Angeles Times, Aug 24, 2016
- What will it take for us to pay attention to climate change?, Op-ed by Bob Beale, The Science Show, ABC, Aug 24, 2016
- Changing opinions on climate change, from a CNN meteorologist by Chad Myers, CNN, Aug 24, 2016
- China and US to ratify landmark Paris climate deal ahead of G20 summit, sources reveal by Li Jing, South China Morning Post, Aug 25, 2016
- Global warming is melting the Greenland Ice Sheet, fast by John Abraham, Climate Consensus-the 97%, Guardian, Aug 25, 2016
- Katharine Hayhoe on Climate and our Choices by Peter Sinclair, Climate Crock of the Week, Aug 24, 2016
- China Turns to Free Markets to Tame Fossil-Fuel Pollution, Bloomberg News, Aug 21, 2106
Fri Aug 26, 2016
- Native Americans encouraged as judge delays North Dakota pipeline ruling by Oliver Milman, Guardian, Aug 25, 2016
- Going out for ice cream: a first date with the Pacific Decadal Oscillation by Tom Di Liberto, NOAA Climate.gov, Aug 25, 2016
- ‘Next year or the year after, the Arctic will be free of ice’ by Robin McKie, Observer/Guardian, Aug 21, 2016
- Climate change will double hay fever allergies in Europe over the next 50 years by Mun Keat Looi, Quartz, Aug 25, 2016
- An Open Letter to the (Australian) Prime Minister on the climate crisis, from 154 scientists by Andrew Glikson, The Conversation AU, Aug 25, 2016
- Scientists begin to unravel summer jet stream mystery, News Release, University of Sheffield, Aug 24, 2016
- Investors controlling $13tn call on G20 leaders to ratify Paris climate agreement by Michael Slezak, Guardian, Aug 23, 2016
- Is Natural Gas a Bridge Fuel? by Zeke Hausfather, Yale Climate Connections, Aug 23, 2016
- How air pollution is causing the world’s ‘Third Pole’ to melt by Chelsea Harvey, Washington Post, Aug 24, 2016
Sat Aug 27, 2016
- California Utility Wants to Install Huge Number of Electric Car Chargers by Anne C. Mulkern, ClimateWire/Scientific American, Aug 26, 2016
- By Mid-Century, More Antarctic Snowfall May Partially Offset Sea-Level Rise, News Release, Lamont-Doherty Earth Observatory, Columbia University, Aug 24, 2016
- Why Aren’t We More Freaked Out About Louisiana? by Jeff Turrentine, OnEarth, Reuters/National Resource Defense Council (NRDC), Aug 24, 2016
- Climate Change May Make Shellfish (and Us) Sick by Maryn McKenna, National Geographic, Aug 18, 2016
- Study Finds Biofuels Worse for Climate than Gasoline by John Upton, Climate Central, Aug 25, 2016
- This is How South Florida Ends by Maddie Stone, Gizmodo, Aug 23, 2016
- Eastern India struggles to evacuate reluctant villagers as floods wreak havoc by Jatindra Dash, Thomson Reuters Foundation, Aug 25, 2016
- Analysis of Robin McKie’s “Next year or the year after, the Arctic will be free of ice", Climate Feedback, Aug 22, 2016


'Toon of the week?
http://www.gocomics.com/wumo/2016/08/27
`Next year or the year after, the Arctic will be free of ice’ by Robin McKie, Observer/Guardian, Aug 21, 2016
FYI, climate scientists (Climate Feedback) judge the scientific credibility of this story to be low.
[JH] Thank you Victor. Tomorrow, I will post a link to the Climate Feedback analysis on the SkS Facebook page.
Further to Victor's link.
Arctic sea ice this year may challenge the 2012 record as far as area at minimum goes. It won't challenge the 2012 extent record, although it may come 2nd. The state of much of the ice pack up thre is very poor, with near record low concentrations over 1/2 the Arctic. And a lot of multi-years ice has been lost this year. Ice often flows down the east coast of Greenland, through Fram strait. This year not much. Not because the ice isn't moving there, it is, but the high North Atlantic is so warm this year the ice melts when it hits that region rather than being able to drift south. This has been clear on satellite images for a couple of months.
That said, there is still a lot of ice left, the situation is really only getting back to near the 2012 state after several colder years. With the likely state of the ice at the end of this melt season in about 3 weeks, the ice is quite possibly set up for bigger melt next year if the right weather conditions prevail. However, there is still a lot of ice to work through before the Arctic can become ice free, particularly completely ice free.
Most people use an operational definition of 'ice free' as below 1 million km2. Currently it is around 3.5 million km2 in area and 5 million km2 in extent.
Could several years of weather conducive to melt lead to reaching the 1 million threshold? Possibly. But if they are poorer weather years, it could expand again. The longer term trend seems clear but how far off is quite variable. 2 years, almost certainly not. 50 years, also almost certainly not. But whether operationally ice free is 5 years away or 15 is quite unclear.
Glenn@3,
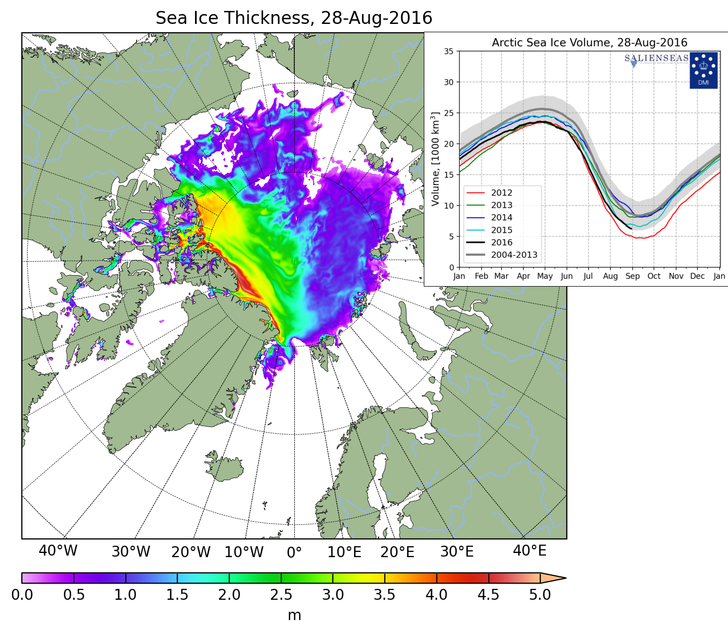
We'll have more data as the melting season concludes soon but I want to know the emerging picture now. Your statement is very vague. What do you mean by "very poor"? By PIOMAS metric (click to see the original), the ice volume runs quite low but higher than 2011, 2013 and of course 2012.
I have noticed that in the NSIDC records for Arctic Ice Extent (Charctic Interactive Sea Ice Graph) the fluctuation of extent appears to be noticeable lower one or two years after significant El Nino events (using the NOAA ONI values to identify significant El Nino events).
If there is a reason for the minimums to drop in the years immediately following an El Nino then 2017 or 1018 would likely be a minimum that is clearly lower than 2012.
Glenn is probably referring to this chart of the sea ice concentration. Note the large regions on the Siberian side with less than 50% concentration. With some care I guess it would be possible to maneuver a small boat between the ice floes in much of that region. After this coming winter, the so-called multiyear ice will contain lots of thin first year ice.
chriskoz

The Uni Bremen chart shows concentration differences across the pack more clearly than the NSIDC chart HK showed:
More interestingly, although it is more work, is to have followed the evolution of the ice pack over the season through direct imagery from Lance-MODIS. Major cracking events north of the Canadian Archipelago and often close to the Pole, lots of broken up floes across not just the peripheral seas but into the Central arctic basin on and off again over months. They move apart slightly, compact, refreeze together a bit. If 3-4 meter thick multi-year ice breaks up into flows that refreeze, the 'joints' are thinner, weaker. You can often see this in the Lance-Modis images.
They are all indications of an ice pack that has less structural integrity. So concentrations maps such as above are an end of season consequence of a far more broken up ice pack. And a series of strong storms in the last few weeks has also contributed.
So by poor I mean mechanical integrity.
As to thickness, PIOMAS only updates every month. DMI update there volume product almost daily and it is suggesting a significant drop over August. There are some concerns that the model DMI uses isn't as robust as PIOMAS but still it is probably useful as indicative of relative changes until PIOMAS updates. And we all wish Cryosat 2 was operational during the melting season :-(
If you haven't been there Neven's Arctic Sea Ice Blog is good value. His graphs page here links to all sorts of sources. Check out the Regional Graphs pages for basin level graphs produced by one of his regular users, Wipnius, from raw satellite feeds. Then visit his forum. Lots of knowledgeable people who live and breath the arctic.