


 Arguments


2017 SkS Weekly Climate Change & Global Warming Digest #29
Posted on 23 July 2017 by John Hartz
Story of the Week... Toon of the Week... Video of the Week... Coming Soon on SkS... Poster of the Week... Climate Feedback Reviews... SkS Week in Review... 97 Hours of Consensus...
Story of the Week...
2017 is so unexpectedly warm it is freaking out climate scientists
"Extremely remarkable" 2017 heads toward record for hottest year without an El Niño episode.
January–June 2017 global surface temperatures (compared to the 20th century average) in Degrees Celsius. CREDIT: NOAA
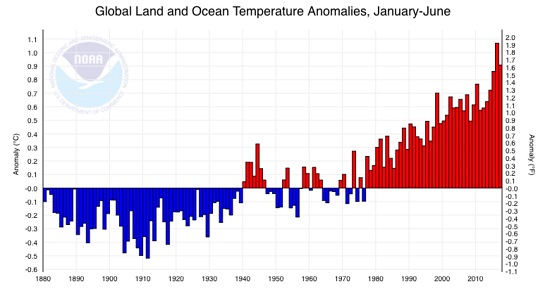
Normally, the hottest years on record occur when the underlying human-caused global warming trend gets a temporary boost from an El Niño’s enhanced warming in the tropical Pacific.
So it’s been a surprise to climate scientists that 2017 has been so remarkably warm?—?because the last El Niño ended a year ago. The National Oceanic and Atmospheric Administration (NOAA) reported Tuesday that the first half of 2017 was the second-warmest January-June on record for Earth, topped only by 2016, which was boosted by one of the biggest El Niños on record.
“As if it wasn’t shocking enough to see three consecutive record-breaking years, in 2014, 2015, and 2016, for the first time on record,” leading climatologist Michael Mann wrote in an email to ThinkProgress, “we’re now seeing near-record temperatures even in the absence of the El Nino ‘assist’ that the previous record year benefited from.”
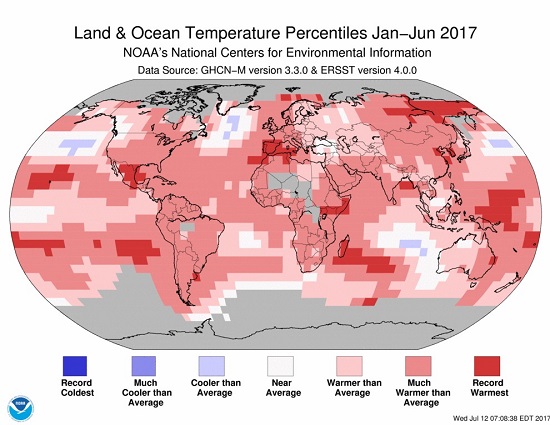
How January-June temperatures globally rank compared to the 20th century average. CREDIT: NOAA
NOAA climatologist Ahira Sanchez-Lugo told Climate Central, “After the decline of the strong El Niño, I was expecting the values to drop a bit…. This year has been extremely remarkable.”
Usually we see global records in years when the short-term El Niño warming adds to the long-term global warming trend (see chart below). As NOAA noted in its March report, without an El Niño, no month before March 2017 had ever exceeded the “normal” temperature (the 1981–2010 average) by a full 1.8°F (1.0°C).
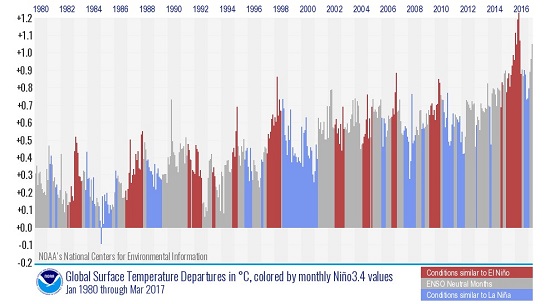
Global monthly temperature departures (from 1981–2010 average) color-coded by whether the Pacific was experiencing an El Niño (red), a La Niña (blue) or neutral conditions (gray). CREDIT: NOAA
This matters because when a month?—?or six-month period?—?sees record high global temperatures in the absence of an El Niño, that is a sign the underlying global warming trend is stronger than ever. The latest NOAA report is “a reminder that climate change has not, despite the insistence of climate contrarians ‘paused’ or even slowed down,” Mann said.
Bottom line: Human-caused global warming continues at a dangerous pace, and only human action to slash carbon pollution can stop it.
2017 is so unexpectedly warm it is freaking out climate scientists by Joe Romm, Think Progress, July 19, 2017
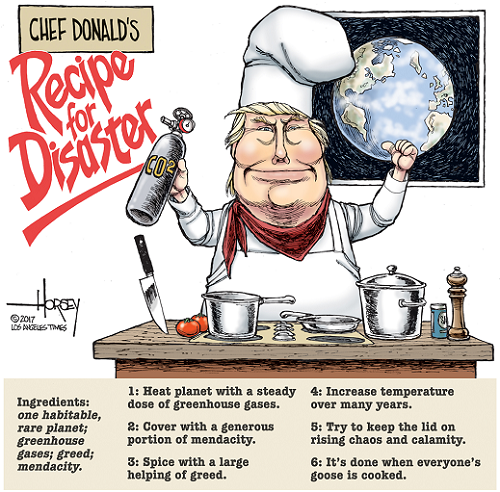
Toon of the Week...
Video of the Week...
Climate change is real, case closed. But there's still a lot we don't understand about it, and the more we know the better chance we have to slow it down. One still-unknown factor: How might clouds play a part? There's a small hope that they could buy us some time to fix things ... or they could make global warming worse. Climate scientist Kate Marvel takes us through the science of clouds and what it might take for Earth to break its own fever.
Filmed at April 2017 at TED2017
Coming Soon on SkS...
- Study: our Paris carbon budget may be 40% smaller than thought (Dana)
- As Trump pulls out of the Paris Agreement, remember: We've seen this before (Benjamin Franta)
- Explainer: How data adjustments affect global temperature records (Zeke Hausfather)
- SkS Resources - Easy to remember Short URLs (Baerbel)
- Guest Post (John Abraham)
- 2017 SkS Weekly Climate Change & Global Warming News Roundup #30 (John Hartz)
- 2017 SkS Weekly Climate Change & Global Waming Digest #30 (John Hartz)
Poster of the Week...
Climate Feedback Reviews...
Climate Feedback asked its network of scientists to review the article, The Uninhabitable Earth by David Wallace-Wells, New York Magazine, July 9, 2017
Seventeen scientists analyzed the article and estimated its overall scientific credibility to be ‘low’.
A majority of reviewers tagged the article as: Alarmist, Imprecise/Unclear, Misleading.
Review Summary
New York Magazine published an article by David Wallace-Wells detailing the potential impacts of climate change if no action is taken to reduce greenhouse gas emissions. Much of the article explores “worst case” scenarios of change in the climate system and the resulting impacts on human populations.
Scientists reviewed the article to determine whether the descriptions of those scenarios accurately reflect the state of scientific knowledge. The New York Magazine article has triggered a number of responses debating the merits of the decision to focus on worst case scenarios, but our review simply addresses the scientific accuracy of the article.
The reviewers found that some statements in this complex article do misrepresent research on the topic, and some others lack the necessary context to be clearly understood by the reader. Many other explanations in the article are correct, but readers are likely left with an overall conclusion that is exaggerated compared to our best scientific understanding.
See all the scientists’ annotations in context.
Update (15 July 2017): New York Magazine has published an annotated version of its article indicating sourcing, which also incorporates several edits based on scientists’ comments. Read more
Update (13 July 2017): The analysis has been updated to include several comments received just after the time of publication. The main conclusion of the analysis is unchanged.
SkS Week in Review...
- 2017 SkS Weekly Climate Change & Global Warming News Roundup #29 by John Hartz
- Planet Hacks: Stuff Video by Climate Adam
- Climate denial is like The Matrix; more Republicans are choosing the red pill by Dana Nuccitelli (Climate Consensus - the 97%, Guardian)
- Is energy 'dominance' the right goal for US policy? by Daniel Raimi (The Conversation US)
- Surrendering to fear brought us climate change denial and President Trump by John Abraham (Climate Consensus - the 97%, Guardian)
- 2017 SkS Weekly Climate Change & Global Warming Digest #28 by John Hartz
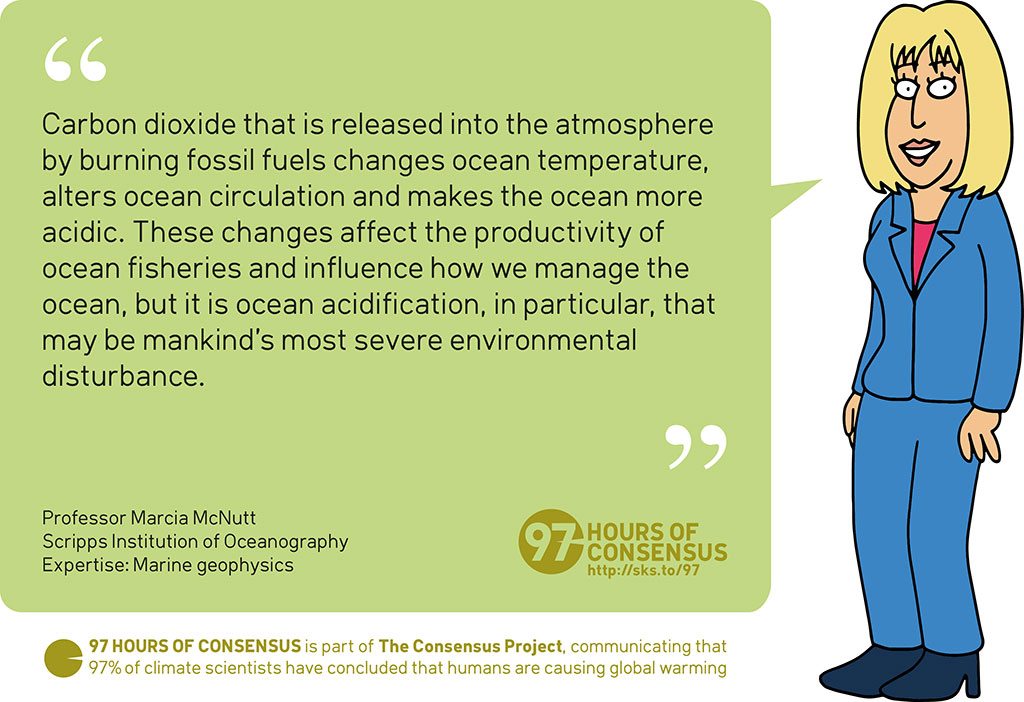
97 Hours of Consensus...


"Arctic sea ice is declining at a rate of 13.3% per decade." Is this for area or volume? I expect the rate for volume is twice that. In any case, it may be helpful to say which it is.
"it’s been a surprise to climate scientists that 2017 has been so remarkably warm " It's never good when the scientists are surprised. This is just speculation: could this be related to the rise in CO2? As recently noted in the NYT: "excess carbon dioxide... rose at the highest rate on record in 2015 and 2016... Scientists are concerned... because... the amount... people are pumping... seems to have stabilized...". Many of us have been concerned that CO2 emissions could begin occuring outside human control. Could this be happening already?
I also think the recent temperature run-up could be related to the Chinese acting to reduce their coal combustion (whose aerosols may have been helping cool the planet). That would work on the short timescales here.
The third graph (monthly anomalies) in the lead story looks wrong.
The graph claims to show the excess over the mean for the period 1980-2010, but only one point is reported as being below that mean. The mean appears to be offset by about 0.4 degrees.
Was a different baseline used? This graph exagerates warming, giving fuel to those calling scientists "alarmists". Could an expert please fix it?
Well spotted Lachlan - the graph is mislabelled in this article. The graph comes from here where it clearly states that the height of bars is the anomaly from the 20th Century average, not the a 1980-2010 average. Ie the same baseline as the other 2 graphs on this page.
#1
The 13.3% decline comes from the NSIDC Arctic Sea ice reports for sea ice extent with (I think) at least 15% coverage. So it's area.
NSIDC Report For September 2016
It's in the note to the graph for "September 2016 compared to previous years"
As this is your first post, Skeptical Science respectfully reminds you to please follow our comments policy. Thank You!
I forgot to add the links to my previous comment.
https://www.youtube.com/watch?v=-qUxjDBY0i0
https://www.youtube.com/watch?v=GiLBbBy8BEY
https://www.youtube.com/watch?v=x64bWsVUPjo
https://www.youtube.com/watch?v=8RBzlyOCdcQ
https://www.youtube.com/watch?v=gps8YwlX8Lc&spfreload=1
https://www.youtube.com/watch?v=LObn2Sk7tVg&spfreload=10 The Little Ice Age
https://www.youtube.com/watch?v=OEzAC89dzgs
[PS] Please read and abide by comments policy. Especially note the rule on link-only comments. We have no idea what you are trying to say and certainly are not going to waste time looking at videos to find out. I would warn you that if your intention is a gish-gallop of long-debunked myths in video form, then your comment is unacceptable. Make your point on a relevant thread (use search function to find threads) and read the article first. Stick only that point. Certainly provide supporting evidence but peer-reviewed papers are better than videos. use the Link button in the editor to create links - dont expect pasted html to work.