


 Arguments


Explaining climate change science & rebutting global warming misinformation
Global warming is real and human-caused. It is leading to large-scale climate change. Under the guise of climate "skepticism", the public is bombarded with misinformation that casts doubt on the reality of human-caused global warming. This website gets skeptical about global warming "skepticism".
Our mission is simple: debunk climate misinformation by presenting peer-reviewed science and explaining the techniques of science denial, discourses of climate delay, and climate solutions denial.


Hot days, cold thermometers
Posted on 27 July 2026 by Zeke Hausfather
This is a re-post from The Climate Brink
A graph has been making the rounds on social media showing the average number of days per weather station above 95F, 100F, and 105F across the contiguous US since 1895. It comes from CFACT analyst Chris Martz, drawing on raw data from NOAA’s Global Historical Climatology Network daily dataset (GHCNd), and it shows the 1930s towering over everything since. The implication is that extreme heat in the US is nothing new, and that all the recent fuss about record temperatures is overblown.
It is a compelling figure. The 1930s Dust Bowl really was an extraordinary period of extreme heat in the US, and no amount of correction for changes in measurement techniques over time makes it go away. But the graph is also a case study in why you cannot naively count threshold exceedances in raw daily station data and call it a climate record. Its results rest on two well-documented thermometer problems that artificially depress modern hot day counts, plus a station network that happens to be oversampled where the Dust Bowl happened.
Reproducing the viral chart
To start with, let’s reproduce the figure properly. Rather than averaging whatever stations happen to be reporting in a given year (the station network grew from a few hundred stations in 1895 to many thousands today, with big shifts in where they are located), I selected the 543 GHCNd stations in the contiguous US with long, near-continuous maximum temperature records over the full 1895-2025 period,1 gridded them to 2x2 degree cells, and computed an area-weighted national average.
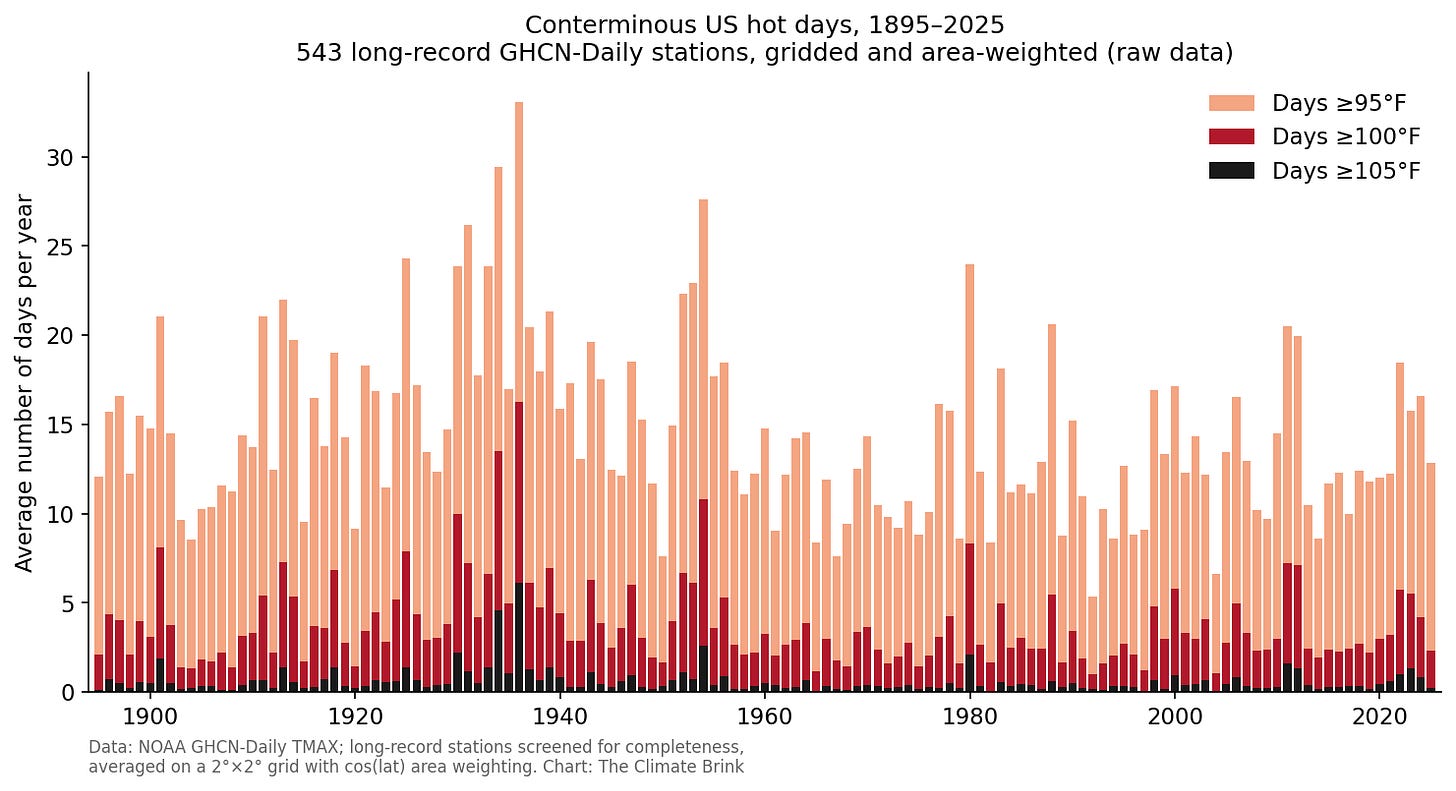
Here we see the same basic story as the viral version: a huge spike in the 1930s (1936 alone averaged 33 days at or above 95F across these stations), elevated values through the mid-1950s, and nothing since that comes close. So the Martz figure is not fabricated, and its shape is not an artifact of the changing station network. To be fair to its author, counting hot days in raw data really does produce this picture.
The problem is what “raw” means here.
2026 SkS Weekly Climate Change & Global Warming News Roundup #30
Posted on 26 July 2026 by BaerbelW, Doug Bostrom
Stories we promoted this week, by category:
Climate Change Impacts (11 articles)
- Insane': Republicans Push To Punish Canada For Wildfires “We will not tolerate this incompetence,” vowed Ohio Sen. Bernie Moreno, who may not understand how climate change works. Huffington Post, Jennifer Bendery, Jul 17, 2026.
- UN to list more sites as 'in danger' from conflict or climate change Phys.org, Simon Valmary and Celia Lebur, Jul 18, 2026.
- As mosquito ranges expand, better monitoring is key to preventing disease Monitoring is expensive and labor intensive. But it helps public health officials stop outbreaks. Ars Technica, Madeline Shaw, Jul 19, 2026.
- Climate Scientists Say The Dice Are Loaded. Here's Why "Just have a Think" on Youtube, Dave Borlace, July 19, 2026.
- Opinion: Is the Colorado River in a climate doom loop? We caused a problem, and our efforts to fix the problem make it worse Colorado Newsline, Gary Wockner, Jul 20, 2026.
- Rising seas magnify the dangers of coastal Georgia`s industrial past The state’s first Superfund research center is looking into how climate change is resurfacing industrial pollution. Grist, Emily Jones, Jul 20, 2026.
- Extreme heat morphs into a major economic shock for an unprepared Europe Europe’s status as the planet’s fastest-warming continent is becoming a serious drag on its economic prospects. The Business Standard, Laura Millan, Jul 21, 2026.
- What Happens to Our Brains in a Warming World? In this era of advancing AI, when everyone is debating the nature of 'intelligence,' we have forgotten that our brains run well only within a narrow band of temperature. What happens to the brain once that temperature threshold is crossed is often overlooked in discussions of climate change. State of the Planet, Marco Tedesco and Burcin Ikiz, Jul 22, 2026.
- The year climate change came for the Tour de France Record heat, wildfire threats, and an unprecedented stage modification highlighted the growing challenge global warming poses to endurance sports. Grist, Tik Root, Jul 23, 2026.
- Climate change to obliterate $1.5 trillion in U.S. home values Climate change will wipe out about $1.47 trillion in U.S. home values over the next three decades and hasten economic gaps in U.S. communities, a report released on Monday finds. CBS News, Kate Gibson , Jul 23, 2026.
- This El Niño is set to be the largest on record by a ‘mind-blowing margin’ Forecasters predict that the monster climate pattern will combine with global warming to push global temperatures in 2027 to new heights. Nature, James Dinneen, Jul 23, 2026.
Climate Policy and Politics (5 articles)
- How Companies Have Abandoned Their Climate Goals and Let Themselves Off the Hook Big business made big promises about saving the planet. Following through hasn’t been easy. New York Times, David Gelles, Jul 17, 2026.
- Trump threatens new Canada tariffs over fires sending 'filthy' air into US cities US President Donald Trump has threatened to impose new tariffs on Canada after hundreds of wildfires have left much of the northern US covered by a blanket of smoke. BBC News, Nadine Yousif, Jul 18, 2026.
- Majority of US voters link extreme weather to climate crisis, study finds Top Democrat says findings show public ‘way ahead of the politicians’ as Trump dismisses global heating as ‘hoax’ The Guardian, Dharna Noor with graphics by Andrew Witherspoon, Jul 19, 2026.
- Trump Lashes Out at National Academies of Sciences Over Climate Guide For Judges Trump claimed without evidence that the manual was “fraudulent, biased, and misleading.” Inside Climate News, Dennis Pillion, July 20, 2026.
- Q&A: What the EU`s carbon market review means for climate action The European Commission has put forward new plans to cut emissions under the EU carbon market more slowly, from 2031 onwards. Carbon Brief, Orla Dwyer, Jul 20, 2026.
Skeptical Science New Research for Week #30 2026
Posted on 23 July 2026 by Doug Bostrom, Marc Kodack
Open access notables
Record-low 2025 and 2026 ice extents restore Arctic winter sea-ice decline, Chan et al., Proceedings of the National Academy of Sciences
Recent analyses have suggested that the decadal rate of Arctic winter sea-ice extent decline weakened in the early 2020s, with 20-y trends becoming statistically insignificant. Here we show from more up-to-date observations that the exceptionally low 2025 and 2026 ice extent winters reversed this picture, with sea-ice extent during the growth and peak phases returning to record lows and 20-y decline trends becoming significant again. Further analysis of CMIP6 model analogues shows that the observed 2025 decline was unusual but physically plausible under comparable Arctic warming, and is more consistent with ongoing winter sea ice reduction than with a return to values seen in the early 2020s.
As the planet heats, public doubt grows: The social structure behind rising climate change scepticism in Germany, Gies & Deutschmann, Global Environmental Change
In 2024, global heating exceeded 1.5 °C for the first time. Paradoxically, as the climate crisis becomes ever more evident, climate change scepticism (CCS) has recently grown (rather than declined) in Germany, a high-emissions country with enormous responsibility. Past research has not systematically studied which social groups and characteristics are behind this shift. We address this gap by examining the social structure of rising CCS in Germany, taking its multidimensionality into account. Drawing on GESIS Panel data that is representative of the German adult population, we detect a strong and consistent increase across a comprehensive set of 14 CCS indicators between 2022 and 2023. We find that this rise in scepticism is not driven by a small and ‘loud’ minority but rather constitutes a mass phenomenon: on average across all items, CCS increased among 59% of respondents, and for 93% of respondents at least one indicator rose. Regression models reveal a complex picture with socio-structural effects depending on the dimension of CCS, but right-wing political orientation, government distrust, and hierarchical worldviews are most consistently associated with increases in CCS. Overall, political attitudes – which are flexible and have shifted substantially in recent years – relate far more strongly to rising CCS than stable socio-structural factors like income or gender. These findings demonstrate an urgent need to restore trust in political institutions and to foster inclusive, participatory climate dialogue to secure broad public support for the transition towards a carbon-neutral society.
Climate Obstruction in the Digital Far-Right: Mapping the Climate Countermovement in German-, Danish-, and Swedish-Speaking Digital Information Environments, Henriksen et al., Environmental Communication
This article examines how climate obstruction narratives circulate in far-right digital information environments in Austria, Germany, Denmark, and Sweden. We analyzed 41 million social media posts published across multiple social media platforms from 2019 to 2022. Using multilingual text classification and actor–source mapping, we identified which posts contained climate obstruction narratives, which actors produced them, and which sources they cited. The results revealed three configurations. In the German-speaking environment (Germany and Austria), obstruction is mainly driven by far-right citizen accounts embedded in a hyperpartisan media ecosystem. In Sweden, far-right grassroots actors coexist with climate-focused organizations that bridge mainstream and alternative sources. In Denmark, obstruction is comparatively mainstream-embedded and anchored in organizations and citizen groups drawing on legacy news. The article discusses how national media systems, political fields, and far-right actor constellations make certain forms of obstruction communicatively viable and thereby shape the digital climate countermovement.
Mapping climate change coverage: Causes, consequences, and solutions in German news media, 2010–2024, Dablander et al., Energy Research & Social Science
The media shapes how political leaders and the public understand the causes, impacts, and solutions to climate change. Here, we provide the most extensive analysis to date of how German news media report on climate change between 2010 and 2024. We develop and validate a methodology based on large language models to analyze the contents of over 50,000 articles from seven major newspapers across the political spectrum. We found that aspects relating to causes, impacts, and mitigation were all covered substantially more often than aspects relating to adaptation. While most articles identified climate change as human-caused, coverage about causes was dominated by fossil fuels, with agriculture, overconsumption, carbon inequality, and economic growth rarely mentioned. Left-leaning outlets more frequently reported that climate change is human-caused, highlighted fossil fuels as a cause, emphasized the need to reduce their use, and discussed systemic and social drivers more often. Coverage patterns have remained largely stable over time, except for growing attention to net-zero targets and carbon taxes. Our findings highlight opportunities for more comprehensive climate journalism to better support public understanding and policy debate by reflecting the scientific consensus and the full range of societal transformations needed to address climate change.
From this week's government/NGO section:
Attribution of Extreme Weather and Climate Events and Their Impacts, National Research Council, The National Academies Press
Decades of data and research indicate that human-caused climate change is altering the frequency and intensity of several types of extreme events, such as heat waves and extreme rainfall events. Even as those trends become clearer, extreme event attribution (EEA) seeks to assess the degree to which climate change contributed to any specific event. EEA studies provide information that can be useful for public understanding, planning and risk management, policy and legal contexts, and scientific research. The authors evaluate the state of EEA science, updating a National Academies report published in 2016. The authors also assess the emerging field of extreme event impact attribution (EEIA). The number of EEA studies has grown substantially over the past decade as scientific tools, observational datasets, and methods have advanced, enabling attribution studies to be completed within days of an event. However, challenges remain, including limited model capabilities for small-scale regional events, representation of key atmospheric processes, and attribution of compounding, cascading, and record-breaking events. The authors examine these advances and remaining challenges and provide recommendations for strengthening attribution science, improving collaboration with local experts and stakeholders, and advancing research, data, and modeling capabilities worldwide.
Early Warnings: Government Knowledge of Climate Change and Legal Responsibility for Climate Harm, Lindsay Fenlock and Nikki Reisch, Center for International Environmental Law
The authors examine publicly available government records, scientific evidence, and historical archives to document when major emitting States became aware of the causes and foreseeable consequences of climate change. They demonstrate that many governments understood the risks decades earlier than they have claimed, strengthening the evidentiary foundation for climate litigation, human rights, and climate advocacy, and the implementation of the International Court of Justice climate advisory opinion. By tracing the history of government knowledge, the report provides a critical resource for advancing climate accountability and ensuring that high-emitting States are held responsible for failing to prevent the climate crisis.
284 articles in 105 journals by 2495 contributing authors
Physical science of climate change, effects
A 21-Year Global Daytime Satellite Climatology of Cirrus Cloud Cover and Its Links to Upper-Tropospheric Conditions and Aviation Over Europe and the North Atlantic, Huu et al., International Journal of Climatology 10.1002/joc.70506
A Reconciled Satellite Record Reveals a Negative Low Cloud Feedback Over the Past 47 Years, Cesana & Arouf, Geophysical Research Letters Open Access 10.1029/2026gl124158
Canada's boreal wildfires aren't just bad forest management
Posted on 22 July 2026 by Zeke Hausfather
This is a re-post from The Climate Brink
Over the past week smoke from Canadian wildfires has once again poured into cities across Canada and the northern US. Toronto briefly had the worst air quality of any major city on Earth, Thunder Bay’s readings went off the top of Canada’s air quality health index scale, and unhealthy air alerts stretched from Minneapolis to New York City.
This smoke-pocalypse has renewed a long-standing debate online that these fires aren’t really about climate change at all, but about forest mismanagement. Decades of aggressive fire suppression, the argument goes, have let fuel pile up. We don’t log enough, thin enough, or do enough prescribed burning The forests are overgrown tinderboxes and we have only ourselves to blame. Climate is a distraction from a problem we created by listening to Smokey Bear’s insidious propaganda.
I want to take this argument seriously, because it has a real kernel of truth. The fire-deficit story is a genuine phenomenon in the dry conifer forests of the western United States. But most of what’s burning in Canada is boreal forest, and the boreal is a fundamentally different beast. So in this piece I’ll try to explain why the management argument, largely valid in a California pine stand, mostly falls apart when you move it a couple of thousand kilometers north, and explore what the fire data actually shows.
Here’s the short version. Canada’s area burned has surged, and it has surged in step with warming: hot, dry fire seasons burn far more forest, with area burned rises roughly 80% for each 1C increase in fire-season temperature (with a correlation coefficient of 0.61). This relationship is robust to a variety of statistical tests and controlling for confounding variables. The boreal burns in rare, high-intensity crown fires on a natural cycle measured in a century or more, across enormous remote areas that have never been logged, thinned, or effectively suppressed. Only about a fifth of Canada’s burned area over the past four decades was even inside forest regions that have ever been actively managed. You cannot have a fuel-buildup from forest mismanagement in a forest you were never managing.
Dangerous and historic wildfire smoke pollution event engulfs the U.S. and Canada
Posted on 21 July 2026 by Guest Author
This is a re-post from Yale Climate Connections by Jeff Masters
As climate change bakes forests across North America, dense smoke from dozens of out-of-control wildfires burning in northern Minnesota and adjacent portions of Ontario is blanketing tens of millions of people with hazardous pollution.
The fires are bringing the worst air quality on record to much of the Great Lakes, mid-Atlantic, and Northeast United States. Pollution from small particles called PM2.5 — the fine particles less than 2.5 microns in diameter are the primary air pollution killers — has been far into the “Hazardous” range across five states since Wednesday morning.
The award for worst air in the nation on July 16 went to the city that has in the past billed itself as a climate haven: Duluth, Minnesota. The city’s 24-hour air quality index, or AQI, for PM2.5 particle pollution hit 934, over three times the threshold for “Hazardous” pollution. This shattered Duluth’s previous all-time AQI record of 159 set July 20, 2021. EPA pollution records go back to 1999.
The award for worst air in the nation on July 16 went to the city that has in the past billed itself as a climate haven: Duluth, Minnesota. The city’s 24-hour air quality index, or AQI, for PM2.5 particle pollution hit 934, over three times the threshold for “Hazardous” pollution. This shattered Duluth’s previous all-time AQI record of 159 set July 20, 2021. EPA PM 2.5 pollution records go back to 1999.
Record 24-hr PM 2.5 air quality on July 16, 2026
Duluth, MN: 934 AQI for PM2.5 (Old record: 159, July 20, 2021)
Toledo, OH (5 monitors): 624 (Old record: 190, June 28, 2023)
Chicago. IL (42 monitors): 511 (Old record: 246, June 28, 2023)
Detroit, MI: 490 (Old record: 226, June 28, 2023)
Cleveland, OH: 297 (Old record: 285, June 28, 2023)
Milwaukee, WI: 414 (Old record: 270, June 27, 2023)
Flint, MI: 343 (Old record: 178, June 27, 2023)
Minneapolis, MN (39 monitors): 251 (Old record: 193, July 29, 2021)
Green Bay, WI (5 monitors): 372 (Old record: 179, June 29, 2023)
Grand Rapids, MI (4 monitors): 482 (Old record: 227, June 27, 2023)
Lansing, MI (2 monitors): 408 (Old record: 194, June 29, 2023)
Buffalo, NY (11 monitors): 206 (Old Record: 176, June 7, 2023)
Record 24-hr PM 2.5 air quality on July 17, 2026
Washington D.C. (21 monitors): 246 AQI at Ashburn, VA, and 234 at Springfield, VA (Old record: 222, June 8, 2023, at Franconia Park, VA)
Pittsburg, PA (25 monitors): 261 (Old record: 237, June 29, 2023)
Dover, DE (2 monitors): 223 (Old record: 207, June 8, 2023)
Columbus, OH (8 monitors): 272 (Old record: 210, June 28, 2023)
Because of the huge number of people affected, and since this is occurring at the same time as a severe humid heat wave, this extreme and widespread pollution event — which will be followed by many months of repeated wildfire smoke incursion into the U.S. — will undoubtedly cause hundreds and perhaps thousands of premature deaths. The only comparable wildfire smoke event affecting this portion of North America occurred in 2023; a 2025 study blamed that event for 33,000 premature deaths in the United States, 8,300 in Canada, and 23,000 in Europe. According to the EPA, a premature air pollution death is one that occurs on average 14 years before a person would have otherwise died.
The Strongest El Niño Ever
Posted on 20 July 2026 by Zeke Hausfather
This is a re-post from The Climate Brink
I’m generally pretty measured in how I discuss climate data. There has been only one time in recent years when I was truly shocked: when global temperatures came in for September 2023 at a full 0.5C warmer than any prior September on record.1 Once until today, that is. With the July runs now in from 667 ensemble members across 14 different seasonal forecast models, it looks like this year’s El Niño is not only very likely to be the strongest event since reliable records began – it may end up the strongest by a truly mind-blowing margin.
The multi-model median for the event’s peak (measured as detrended sea surface temperature anomalies in the Niño 3.4 region of the tropical Pacific) currently stands at 3.6C, roughly 0.8C hotter than the prior record of 2.75C set in 2015-16. For context, the gap between the strongest and the fifth strongest El Niño of the past 150 years is only about 0.5C. The models are forecasting something outside the envelope of anything we have ever observed.
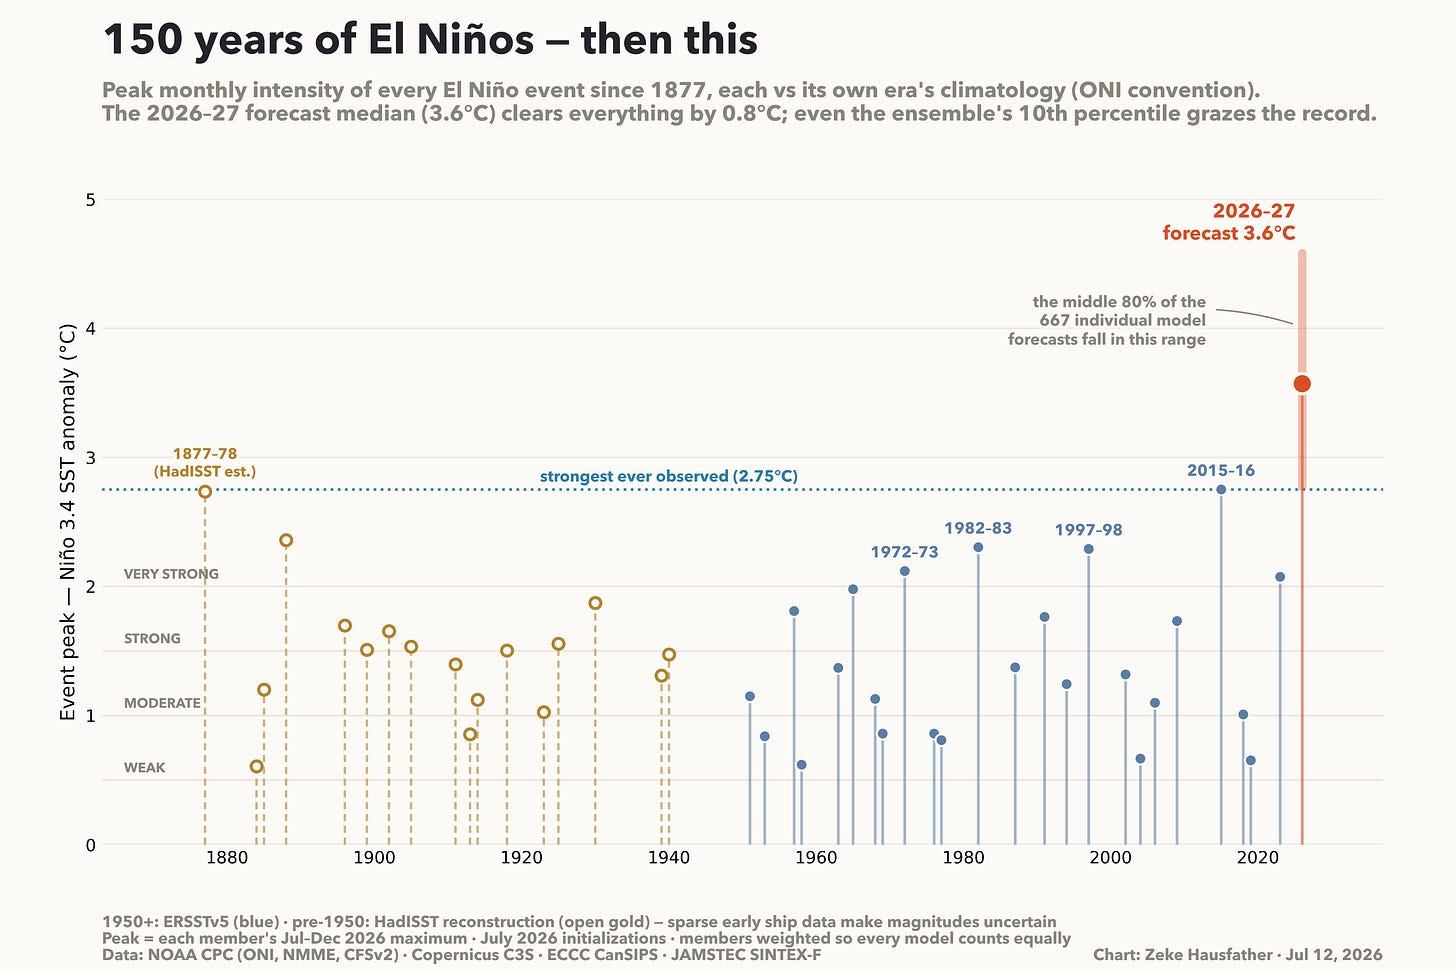
A few things stand out in this figure. First, no event in a century and a half of observations has ever pushed meaningfully past 2.75C. The legendary 1877-78 event comes closest, in a statistical dead heat with 2015-16 (2.73C vs 2.75C, well within the uncertainty of 19th-century ship data). Second, the middle 80% of this year’s forecast ensemble sits entirely at or above that all-time record: even the low end of the plume (2.8C) grazes it. Around 91% of ensemble members exceed the 2015-16 record at their peak.
To see what this would look like as the event unfolds, we can compare the forecast trajectory against the five strongest events ever observed, month by month through the development year and into the following spring.
2026 SkS Weekly Climate Change & Global Warming News Roundup #29
Posted on 19 July 2026 by BaerbelW, Doug Bostrom
Stories we promoted this week, by category:
Climate Change Impacts (7 articles)
- New research : Doomsday Glacier ice shelf could 'give way any day now' "Just have a Think" on Youtubue, Dave Borlace, July 5, 2026.
- Grey whales are dying along our shores. Researchers say a warming climate may be part of the problem Although a number of factors may be contributing to the die-off, scientists say it’s likely at least partly due to climate change. Melting Arctic ice and warmer waters may be reducing the number of small sea creatures the whales rely on for food, and altering the selection of what does remain. CBC'', Brandie Weikle, Laura Lynch, Jul 12, 2026.
- The Strongest El Niño Ever With the July runs now in from 667 ensemble members across 14 different seasonal forecast models, it looks like this year’s El Niño is not only very likely to be the strongest event since reliable records began – it may end up the strongest by a truly mind-blowing margin. The Climate Brink, Zeke Hausfather, Jul 13, 2026.
- Global warming's new wrinkle - it's too hot for nuclear reactors to operate The scorching summer in the U.S. and Europe and wildfires across both continents are well documented, but global warming flexed its power in a new way this week as France said it shut down a handful of nuclear reactors because of the extreme heat. Callaway Climate Insights, David Callaway, Jul 14, 2026.
- Climate Change Contributes to a Smokier World Higher temperatures and drought conditions are contributing to more intense wildfires and extending the summer fire season in North America. NYT, Quinn Glabicki, Jul 16, 2026.
- Canada's boreal wildfires aren't just bad forest management Higher fire season temperatures are strongly correlated with increased area burned The Climate Brink, Zeke Hausfather, Jul 17, 2026.
- Dangerous and historic wildfire smoke pollution event engulfs the U.S. and Canada Most of the fires grew out of control under extreme heat conditions made up to five times more likely by climate change. Yale Climate Connections, Jeff Masters, Jul 17, 2026.
Climate Science and Research (6 articles)
- Scientists finally solved the mystery of Earth's greatest mass extinction According to the researchers, the work also has important implications for the present. The environmental conditions before the Great Dying resembled the relatively cool, oxygen rich oceans that existed for millions of years before human activities began rapidly altering Earth's climate through fossil fuel emissions. ScienceDaily, Stanford University press office, Jul 12, 2026.
- Changes in Funding Could Tank Quality of Ocean Heat Content Data An uncertain funding landscape threatens the longevity of an ocean observation system critical to projecting tropical storms, sea level rise, and more. Eos, Grace van Deelen, Jul 13, 2026.
- A deep pool of extremely warm water is available to fuel El Niño in summer 2026 Climate.us, Rebecca Lindsey, July 16, 2026.
- The report oil companies are worried about: Climate attribution science New report says our ability to tie weather damages to climate change is improving. Ars Technica, John Timmer, Jul 17, 2026.
- As climate extremes collide, attribution science evolves A National Academy of Sciences report on extreme climate event attribution confronts political climate denialism with scientific evidence. Inside Climate News, Bob Berwyn, Jul 17, 2026.
- "iT'S CaLLeD SuMmER" Dr Gilbz on Youtube, Ella Gilbert, July 17, 2026.
Skeptical Science New Research for Week #29 2026
Posted on 16 July 2026 by Doug Bostrom, Marc Kodack
Open access notables

Renewable energy discourses of fossil fuel companies: obstruction and delay of climate action, Desai et al., Energy Sustainability and Society
For decades, multinational fossil fuel companies have strategically promoted discourses to obstruct climate action. Initially, the fossil fuel industry publicized communications that denied the role of fossil fuels in climate destabilization. Recently, however, they have advanced nuanced messages to delay climate action and policy. As the climate crisis worsens and calls to phase out fossil fuels intensify, research into the industry has revealed pervasive “greenwashing” and a discrepancy between external messaging on renewable energy and internal operational positions. Corporate annual reports, which are public-facing communications, offer insights into how companies align their internal strategy with their external messaging. Based on a textual analysis of the annual reports of four of the largest fossil fuel companies (ExxonMobil, BP, Shell, and TotalEnergies), this research compares how companies have adapted their communication strategies about renewable energy between 2016 and 2022.
When algorithms decide the climate: AI, disinformation, and the crisis of environmental truth in the Anthropocene, Vidal, PLOS Climate [commentary]
We often describe the Anthropocene as a planetary emergency. Yet beneath the ecological upheaval lies a deeper and more destabilising fracture: the erosion of environmental truth [1]. By environmental truth, I refer to the collectively negotiated understanding of climate and ecological realities, shaped by scientific, social, and technological processes. Climate knowledge today is reported, debated, and contested, but increasingly it is computed [2]. Algorithmic infrastructures now decide what becomes visible, credible, and politically actionable. My argument here is direct: AI systems and digital platforms have become co-producers of environmental truth, and this reconfigures the very conditions under which climate policy, public debate, and democratic decision-making occur. The Anthropocene is as much a crisis of meaning as it is of ecology.
When models outrun politics: Biofuels as a stress test for scenario plausibility, Hedenus, Energy Research & Social Science
Long-term energy scenarios often assign a substantial role to biofuels in net-zero pathways, despite decades of policy support and limited evidence of sustained cost reductions or large-scale diffusion. Using biofuels as a critical case, this paper examines a broader problem in scenario construction: the misalignment between modelled technology pathways and socio-technical feasibility. Drawing on innovation theory, learning-curve evidence, and observed patterns of policy support and investment, it argues that biofuels are constrained by a configuration of mutually reinforcing limitations, including feedstock-dominated costs, weak learning dynamics, and permanent policy dependence. These constraints do not form a simple causal chain, but jointly limit the conditions under which large-scale competitiveness could emerge. Despite this, energy system and integrated assessment models often project extensive biofuel deployment under assumptions that abstract from political volatility and investment risk. The paper argues for greater use of empirical plausibility checks to improve the relevance of long-term energy scenarios.
Global Warming Has Accelerated Significantly, Foster & Rahmstorf, Geophysical Research Letters
Recent record-hot years have caused discussion over whether global warming has accelerated. Previous analysis found acceleration (i.e., increase in warming rate) has not yet reached a 95% confidence level, given natural temperature variability. We remove the estimated influence of three main natural variability factors: El Niño, volcanism, and solar variation. The resulting adjusted and thus less “noisy” data show that there has been acceleration with over 98% confidence, with faster warming over the last 10+ years than during any previous decade.
Compound coldwave and freezing-snow events decrease during 1994−2023 over global land area, Ma et al., Advances in Climate Change Research
With accelerating global warming, compound climate extremes pose amplified threats to ecosystems and socio-economic stability. However, the occurrence and evolution of Compound Coldwave and Freezing-Snow (CCFS) events in a warming climate remain a critical knowledge gap. This study provides a quantitative assessment of the spatiotemporal changes of CCFS characteristics, including its frequency, duration, and severity from 1964 to 2023, by integrating daily minimum temperature data from Berkeley Earth with hourly precipitation amount and precipitation type data from the ERA5 reanalysis. The spatial distribution of CCFS events exhibits a pronounced interhemispheric asymmetry, with over 90% of occurrences located in the Northern Hemisphere. Mid- to high-latitude regions of Eurasia and North America, where show the highest CCFS frequency, also experienced substantial temporal changes. Compared to the earlier period (1964−1993), notable declines in CCFS frequency, total duration, deficit heat, and combined severity are observed across most land regions during the recent warming period (1994−2023). Globally averaged trends reveal a faster reduction in CCFS frequency and total duration, as opposed to a slower decline in deficit heat and combined severity. The reduction has been particularly rapid in the top 20% most affected land areas, concentrated in subtropical North America, northern/eastern Europe, and Siberia. In these regions, average event frequency, duration, deficit heat, and combined severity declined markedly from approximately 3.5 events, 28 d, −44 °C, and 25 in 1964 to about 2 events, 18 d, −14 °C, and 17 in 2023. However, the average duration per event extends from 1964 to 2023, especially across mid to high latitudes of the Northern Hemisphere. Furthermore, CCFS frequency and duration demonstrate a nearly linear decrease with global warming, while severity indicators follow a nonlinear, logarithmic decay. This disparity indicates distinct sensitivities among different CCFS characteristics. For all CCFS indicators except average duration, the linear component of the response outweighs the nonlinear component. The results will aid forecasting efforts and help to improve hazard preparedness and mitigation strategies.
From this week's government/NGO section:
Climate Change in the American Mind: Beliefs & Attitudes, Spring 2026, Leiserowitz et al., Yale University and George Mason University
Americans who think global warming is happening outnumber those who think it is not by a ratio of more than 4 to 1 (68% versus 16%). By a margin of more than 2 to 1, Americans are more likely to think global warming is mostly human-caused (59%) than to think it is mostly caused by natural changes in the environment (27%). 66% of Americans say they are at least “somewhat worried” about global warming, including 29% who say they are “very worried.” 59% of Americans think global warming is affecting weather in the United States, including 35% who think weather is being affected “a lot.” 13% of Americans have considered moving to avoid the impacts of global warming.
Cheaper. Cleaner. Unstoppable. Clean technologies that are delivering for the climate, James Haselip and Lakshmi Bhamidipati, United Nations Environment Program
At a time when climate risks are intensifying, this policy briefs highlights a powerful and hopeful shift: many clean solutions are no longer niche—they are becoming the new normal. Across energy, transport, buildings and food systems, “positive tipping points” are emerging. As costs fall, technologies scale, and public support grows, adoption is accelerating in self reinforcing ways. Solar power, electric mobility, and sustainable cooling are proving that climate action can be economically competitive, socially beneficial and globally scalable. This report shows that the transition is not only possible—it is already underway. With the right policies, investments and partnerships, we can amplify these positive tipping points, unlock cascading benefits, and deliver a future that is more resilient, equitable and sustainable.
287 articles in 92 journals by 1998 contributing authors
Physical science of climate change, effects
A strong constraint on radiative forcing of well-mixed greenhouse gases, Feng et al., Nature Open Access pdf 10.1038/s41586-026-10289-x
Home batteries could become the next must-have household appliance
Posted on 15 July 2026 by Guest Author
This is a re-post from Yale Climate Connections by Bridgett Ennis
s the prices of home battery systems fall, they’re becoming a key part of the modern electric grid. They can help homeowners store power from rooftop solar panels or the grid for use during outages or periods of high demand. And they can reduce strain on the grid during heat waves when electricity demand soars.
In this interview with Yale Climate Connections, Raghu Belur, the chief products officer for Enphase Energy, explains how home battery systems can lower utility bills and create backup power during grid failures. He also says that batteries, including the batteries in electric vehicles, may one day make it possible for utilities to use power from many small sources to maintain a more reliable grid.
This interview has been edited for clarity and length.
Yale Climate Connections: Could you explain what a home battery is, how it works, and the benefits it provides customers?
Raghu Belur: The beauty of the battery is it can do a few different things. The home – which traditionally has been only a consumer of energy – is actually producing its own energy with solar on the roof. One of the limitations to solar is that it’s an intermittent resource – we don’t have solar at night – so the best way to actually maximize the utilization or the usability of solar is to add a battery.
The second use case is you can actually sell energy back to the grid [in some places]. When there is a lot of demand on the grid and you have all these stored electrons, those electrons are very valuable for yourself as well as for the grid. So you as a prosumer – a producer and a consumer – can sell that energy to the grid and actually make money.
The third use case for that battery is, of course, if the grid were to fail. So when the grid goes out, these batteries can create a microgrid and power the home. The whole process is seamless: It senses that the grid is gone, takes over, and runs the home on the energy that it has saved so the homeowner wouldn’t even know that the grid is gone.
Fact brief - Do electric vehicles stop working in extreme heat?
Posted on 14 July 2026 by Sue Bin Park
![]() Skeptical Science is partnering with Gigafact to produce fact briefs — bite-sized fact checks of trending claims. You can submit claims you think need checking via the tipline.
Skeptical Science is partnering with Gigafact to produce fact briefs — bite-sized fact checks of trending claims. You can submit claims you think need checking via the tipline.
Do electric vehicles stop working in extreme heat?
 Extreme heat can temporarily reduce range, but recent research does not show that EVs are unable to operate in hot weather.
Much of the decrease comes from energy diverted to cool the vehicle, not because EV batteries or motors stop functioning. Modern EVs use thermal management systems to keep components within safe operating temperatures.
U.S. Department of Energy testing in 2024 found EV range fell on average about 14% at an ambient temperature of 95°F (35°C) compared with mild weather. However, the same proportional decrease was measured for gasoline vehicles under comparable conditions.
AAA testing of popular EV models in 2026 found an average range decrease of 8.5% at 95°F. Meanwhile, a 2025 study of 345,000 real-world EV trips found a 16% reduction at temperatures up to 122°F (50°C).
Extreme heat can reduce efficiency, but it does not make EVs unable to function.
Go to full rebuttal on Skeptical Science or to the fact brief on Gigafact
This fact brief is responsive to quotes such as this one.
Sources
U.S. Department of Energy Impact of Cold Ambient Temperature and Extreme Conditions on Electric Vehicles
AAA TEMPERATURE EFFECTS ON ELECTRIC AND HYBRID VEHICLE EFFICIENCY
Applied Energy Extreme heat effects on electric vehicle energy consumption and driving range
Recurrent How Hot Summer Weather Affects EV Range
Columbia Law School Sabin Center for Climate Change Law Rebutting 33 False Claims About Solar, Wind, and Electric Vehicles
[Based on Evan's suggestion in the comments, we updated the title to eliminate the double negative. July 15, 2026]
Please use this form to provide feedback about this fact brief. This will help us to better gauge its impact and usability. Thank you!
Deadly heat wave in France shows the future of climate risk
Posted on 13 July 2026 by Guest Author
This is a re-post from The Climate Brink by Andrew Dessler
I have a commentary in Carbon Brief today, written with my friend, Prof. Chris Callahan. It focuses on the recent heatwave in France.
One point we wanted to make, but that was downplayed after the elves at Carbon Brief edited the piece, is that this event should make us rethink the victory lap people took after RCP8.5 was judged to be implausible.
The focus on arguments about emissions scenarios that only affect the climate late in this century takes the spotlight off the fact that the impacts of climate change are already here and they’re significant, as this French heatwave shows.
The reduction in future emissions is good news, but it may be cancelled by the fact that models seem to be underestimating the extreme heat that Europe is experiencing.
Here is a reprint of our Carbon Brief piece:
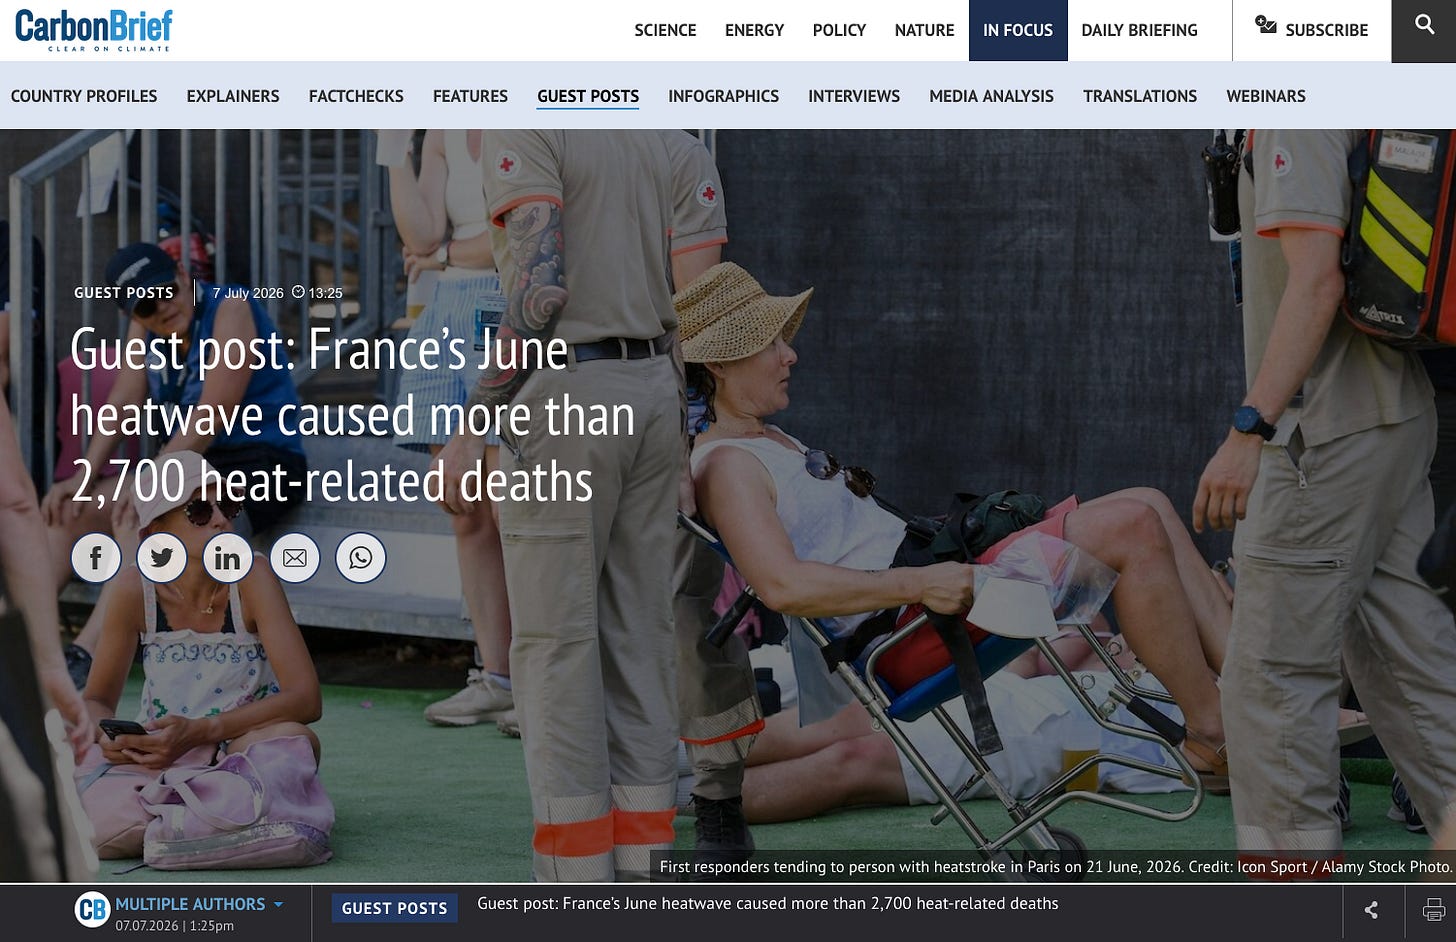
In June 2026, a record-breaking heatwave swept across Europe, with France among the first and hardest hit countries.
In a new analysis, we estimate that the extreme conditions caused more than 2,700 heat-related deaths in France.
We also show how France’s extreme temperatures in June exceeded projections from climate models.
Our findings illustrate the human toll of extreme weather as the world warms.
We also highlight the challenges in projecting the magnitude of future heatwaves and their impacts on people.
2026 SkS Weekly Climate Change & Global Warming News Roundup #28
Posted on 12 July 2026 by BaerbelW, Doug Bostrom
Stories we promoted this week, by category:
Climate Change Impacts (11 articles)
- Ocean surface temperatures hit record high as world enters ‘uncharted territory,’ scientists warn Temperatures on the ocean surface hit a record high in June, European scientists warned Wednesday, fueling fears of more dangerous heat waves this summer and fanning concerns over the escalating global climate crisis.y NBC News, Chantal Da Silva, Jul 1, 2026.
- Heat, Drought, & Fires Disrupt USA`s 250th Anniversary - But We Ain`t Seen Nothing Yet A country that is by and large ignoring global heating is having celebrations of its 250-year anniversary/birthday canceled because of global heating. CleanTechnica, Zachary Shahan, Jul 04, 2026.
- Rising seas make once-rare coastal floods 12 times more likely Phys.org, Alexa St. John, Jul 04, 2026.
- Where do heat waves come from? Just like the adage “a rising tide lifts all boats,” a warming climate raises the baseline temperature from which heatwaves start. '' The Climate Brink, Andrew Dessler, Jul 04, 2026.
- Deadly heat wave in France shows the future of climate risk Professor Andrew Dessler points out that celebration over the recently retired RCP 8.5 emissions scenario is premature and irrelevant, given how Europe's scorching summer illustrates how ''low end'' warming we already live with is profoundly destructive. The Climate Brink, Andrew Dessler, Jul 07, 2026.
- June heatwave in UK led to `mass sleep deprivation`, poll suggests Record temperatures fuelled by climate crisis left 86% of homes ‘too hot’ and many people feeling unwell The Guardian, Damian Carrington, Jul 07, 2026.
- The Arctic Ocean may have passed a crucial tipping point that could harm food webs and worsen climate change Sea ice loss seems to have triggered a decline in the nutrient nitrate, affecting the tiny organisms that form the foundations of marine food chains and absorb atmospheric carbon dioxide, according to a new study. Smithsonian Magazine, Sara Hashemi, Jul 09, 2026.
- The oceans are full of heat, and it`s coming ashore The ocean absorbs 90 percent of the excess heat from global warming. It doesn't all stay there. Grist, Sachi Kitajima Mulkey, Jul 10, 2026.
- The Irreversible Global Impacts of Earth`s Lost Frozen Regions In a U.N. side event organized by the International Cryosphere Climate Initiative, researchers and experts discussed how exceeding 1.5°C will bring irreversible damage from the loss of global snow and ice regions. State of the Planet, Amy Indieke, Jul 10, 2026.
- What happened to Australia`s snow season? A climate expert explains The Conversation, Andrew B. Watkins, Jul 10, 2026.
- Pacific gray whales facing `catastrophic` die-off as climate crisis hits food supply Trump administration urged to relist a species in ‘very, very serious trouble’ under Endangered Species Act The Guardian, Tom Perkins, Jul 10, 2026.
Skeptical Science New Research for Week #28 2028
Posted on 9 July 2026 by Doug Bostrom, Marc Kodack
Open access notables
Fossil fuel emissions dominate Northern Hemisphere CO2 seasonal cycle trends under mitigation scenarios, Jin et al., Nature Communications
Variations in the atmospheric CO2 seasonal cycle across the Northern Hemisphere have historically been dominated by terrestrial ecosystems, making ground-based observations a reliable proxy for terrestrial carbon dynamics. However, whether this dominance will persist in the future remains uncertain. Here we combine atmospheric transport modeling with factorial simulations to assess and attribute future changes in the CO2 seasonal cycle through 2100. We show that the dominant drivers of these changes shift fundamentally across scenarios. Under the high-emission scenario (SSP5-8.5), strengthening land sinks dominate and amplify CO2 seasonal variability, preserving ground-based observations as a reliable terrestrial proxy. In contrast, under the low-emission scenario (SSP1-2.6), CO2 seasonal amplitude declines widely, driven primarily by reduced fossil fuel emissions and their dampened seasonality. Consequently, established ground-based CO2 observations may no longer reliably track terrestrial carbon dynamics under mitigation pathways, underscoring the need for new approaches for monitoring and climate policy verification.
Dynamic evaporative and radiative cooling for efficient year-round energy savings, Zhou et al., Science Advances
Electricity-free radiative cooling (RC) techniques are gaining ever-increasing attention to decrease energy consumption and carbon dioxide (CO2) emissions. However, the cooling power of RC in summer is severely limited by atmospheric window constraints and its negative effect in winter offsets annual energy savings in four-season regions. This study introduces a dynamic evaporative and radiative cooling (DERC) device to maximize the cooling power in hot summer and achieve year-round dynamic thermal management. Adaptive to changes in environmental temperature, the DERC device demonstrates dynamic regulation of water evaporation, along with notable modulation of solar and thermal radiation (ΔAsol = 87%; ΔεBroadband = 63%). Theoretical and real-time experiments demonstrate that the DERC device is more energy-efficient than cutting-edge dynamic radiative cooling (DRC) techniques. The energy-saving simulations indicate that the DERC device yields over 40% primary energy savings and CO2 emission reduction compared to the DRC device. This DERC device represents a conceptual advancement, paving the way for global energy savings and emission reductions.
Heating up the headlines: How tabloid framing reshaped Germany's Buildings Energy Act, Loschke et al., Energy Research & Social Science
Media has become a decisive force in shaping climate and energy policy, influencing not only which issues gain attention but also how they are framed and contested. This paper examines how BILD, Germany's largest tabloid, transformed the 2023 reform of the Buildings Energy Act (GEG) into one of the most polarizing political controversies in recent German history. Analyzing a corpus of 333 BILD articles from January 2023 to March 2024, we identify three dominant rhetorical strategies – personalisation, economic alarmism, and ideological framing – epitomised by the term “Heizungshammer”, which appeared over 250 times in BILD alone and spread to more than 1100 articles across the broader press. These narratives produced concrete policy outcomes: the progressive dilution and eventual abandonment of the 65% renewable energy obligation, the cancellation of planned building efficiency standards, and a reversal of Germany's position in EU negotiations on the Energy Performance of Buildings Directive. The case demonstrates that tabloid framing can migrate directly into legislative outcomes, with measurable consequences for climate governance ambition, highlighting the fragility of climate legislation in an age of digital populism.
Shades of Swedish climate scepticism: an exploration of explanatory factors on doubts about climate change, Mendy & Lindvall, Environmental Sociology
This study examines the drivers of climate scepticism in Sweden, distinguishing between epistemic scepticism – doubts about the scientific evidence of climate change – and response scepticism, concerning doubts about the need or effectiveness of climate mitigation. Using a large-scale survey (n = 5280), we analyse how variants of political ideology – regarding economic and material aspects, and cultural values captured on the GAL-TAN scale – and trust shape these forms of scepticism. While relatively few respondents expressed epistemic scepticism, response scepticism was more prevalent. Low trust in scientists is the strongest determinant of epistemic scepticism, alongside TAN-oriented ideology. TAN orientation associates more strongly with response scepticism than epistemic scepticism, suggesting that individuals who accept climate science may still oppose mitigation policies, possibly due to a proclivity of social dominance orientation or political cues. A novel result is that attributional uncertainty, beliefs that climate is changing equally due to human and natural causes, is found to strongly associate with response scepticism, suggesting that more effective climate communication could alleviate such scepticism. The paper underscores the need to disentangle social mechanisms behind different sceptical climate beliefs and to refine the concept of response scepticism, as it may reflect distinct psychological and political dynamics.
From this week's government/NGO section:
The Power Behind AI. Wave of Dirty Gas Power Plants Planned for Data Centers, Bird et al., The Environmental Integrity Project:
At least 74 natural gas-fired power plants are planned across the U.S. to provide energy for the rapidly growing data center industry. These proposed gas plants, which would be dedicated to serving data centers, are expected to generate 143 gigawatts of electricity – enough to power the state of California nearly three times over. The plants would also release nearly 662 million tons per year of greenhouse gas pollution, which would have the climate-warming effect of 140 million cars and trucks driving for a year or the emissions from the entire nation of Australia. Beyond greenhouse gases, this wave of power plants for data centers could also release 159,142 tons of health-harming air pollutants, including 44,281 tons of nitrogen oxides that contribute to smog and lung damage and 32,684 tons of fine particulate matter, which can trigger heart and asthma attacks. And this is just the tip of the iceberg. This pollution is a small fraction of the likely environmental effect of the booming artificial intelligence (AI) industry and affiliated data centers. These 74 planned gas plants, including 71 new power plants and three plant expansions, would be connected directly to data centers — so-called “behind-the-meter” power plants. These plants are designed to provide their electricity primarily to data centers and not to compete with local households and businesses on regional power grids. More power plants are being planned across the U.S. that will indirectly serve the growing data center industry along with other consumers on the grid, which will likely drive up electricity prices for nearby residents.
Code, carbon, kilowatts: AI’s hidden toll and the race to green the grid, Patrick Hoffmann and Katharina Utermöhl, Allianz Research
Data-center investment reached USD580bn in 2025, putting AI on track to become one of the world's fastest-growing sources of electricity demand. Installed capacity is expected to double by 2030, with AI workloads already accounting for 15–20% of data-center electricity use and potentially approaching 40% by the end of the decade. Yet the sector's environmental footprint remains underestimated as most analyses focus only on operational electricity use. The authors take a broader systems view across 26 countries (+93% of global capacity), adding lifecycle emissions, water use and AI's growing resource demand. Identical workloads can generate up to 24 ti mes more emissions depending on the emission intensity of the grid, making location as decisive as demand growth. Fossil-dependent grids in Indonesia, India and Malaysia exceed 600 gCO2/kWh, compared with under 30 gCO2/kWh in Norway and Sweden. The US and China, which host the largest data-center clusters, sit in between at 384 gCO2/kWh and 526 gCO2/kWh, respectively, giving Europe's cleaner power mix a structural advantage for low-carbon AI growth. These disparities are amplified by transmission and distribution losses of 10–15% in some markets, while less reliable grids raise electricity needs and dependence on backup generation.
125 articles in 56 journals by 1121 contributing authors
Physical science of climate change, effects
A Link between African Surface Temperature and the Eastward Shift of Precipitation over the Indo-Pacific Maritime Continent Region, Hagos et al., Journal of Climate 10.1175/jcli-d-25-0192.1
Antarctic Sea-Ice Loss Enhances East Asian Summer Precipitation Through Tropical Ocean Warming, Zhu et al., Earth s Future Open Access 10.1029/2026ef008147
Six charts show how clean power was world’s largest source of new energy in 2025
Posted on 8 July 2026 by Guest Author
This is a re-post from Carbon Brief
Clean power added more to global energy supplies than any other source in 2025, according to the latest Energy Institute statistical review of world energy.
Outside the Covid pandemic, it was also the first year ever in which wind and solar, when combined, contributed more new energy than any of the individual fossil fuels.
The findings illustrate the “growing prominence” of electricity in the global energy system, according to the Energy Institute, a professional membership body that took over the production of the annual statistical review from oil firm BP in 2023.
It notes that electricity demand is rising much faster, at 3% in 2025, than energy use overall at 1.7% – and that all of the new power supply came from low-carbon sources.
While it includes data on data-centre demand for the first time, the review shows that these only make up 2% of all electricity use and 15% of the increase in 2025.
(The review does not explore other sources of demand, but separate data shows electrification of industry, heat and transport is a far larger driver of growth than data centres.)
At the same time, every source of energy – including coal, oil, gas, nuclear and hydro – also reached global all-time highs in 2025, the statistical review shows.
While the 86% of “primary energy” that came from fossil fuels is a record low, their real contribution to the economy is far lower, because roughly two-thirds of their energy is lost during combustion.
Below, Carbon Brief highlights the key findings of the review in six charts.
- Global energy supplies increase 1.7% in 2025
- Fossil fuels met a record-low 86.2% of global energy supply
- The ‘primary energy fallacy’ ‘inflates fossil fuels’
- Wind and solar were biggest source of new energy in 2025
- Clean energy met all of global electricity growth in 2025
- China generates more power than the US, EU and India combined
Global energy supplies increase 1.7% in 2025
The review shows that global energy supply reached a record high in 2025, climbing 10 exajoules (EJ, 1.7%) to more than 600EJ for the first time ever.
Within this total, there were new all-time highs for every energy source: oil; coal; gas; nuclear; wind and solar; as well as hydro and other renewables. This is shown in the figure below.
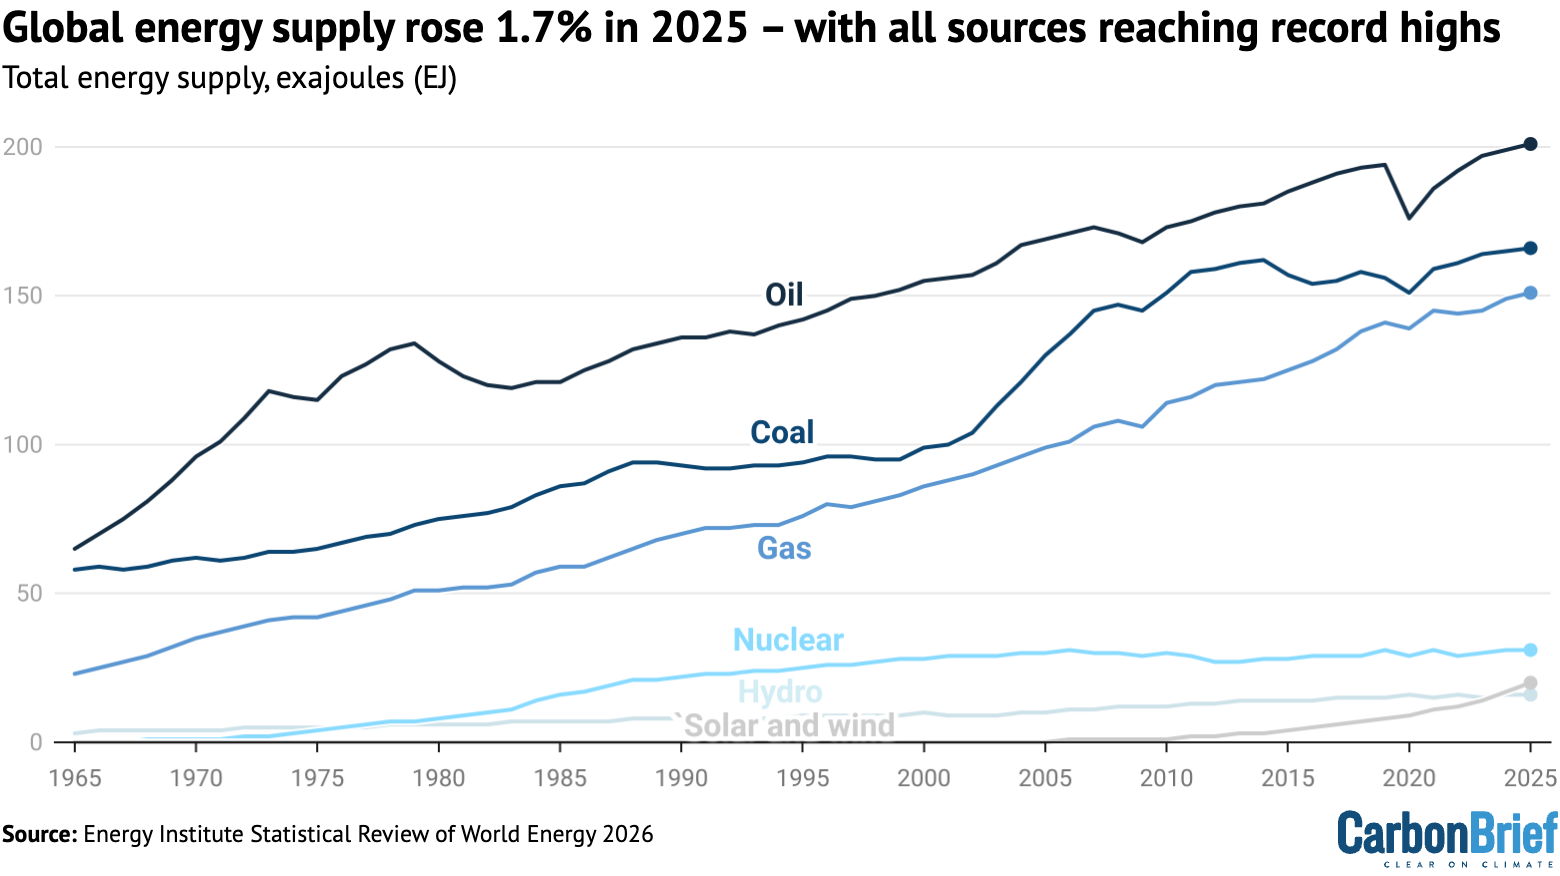 Total global energy supply by fuel, exajoules. Source: Energy Institute (2026).
Notably, coal hit a new record of 166EJ in 2025, up 0.7% from a year earlier and 2.8% above the level reached in 2014, which had been seen as a potential peak for the fuel.
Wind and solar saw the fastest growth, up by 18.3% year-on-year, as well as adding more to global supplies – in combination – than any single fuel source.
Eastern U.S. broils after heat wave kills over 1,300 in Europe
Posted on 7 July 2026 by Guest Author
This is a re-post from Yale Climate Connections by Bob Henson and Jeff Masters
Update (Thursday, July 2, 3 p.m. EDT):
Extreme heat warnings covered much of the Midwest, mid-Atlantic, and Northeast U.S. on Thursday – including the heavily populated Interstate 95 corridor from Virginia to southern Maine – as a well-predicted heat wave intensified with the approach of a holiday weekend, bringing widespread temperatures above 100 degrees Fahrenheit. Millions of people are set to experience the hottest Fourth of July ever recorded in the history of their town or city. Parades, concerts, and other events were being rearranged, rescheduled, or moved indoors to avoid the worst of the dangerous heat.
As the United States prepared to commemorate the nation’s 250th birthday, the U.S. capital had entered one of the worst heat waves in its history. As of midday Thursday, the official forecast for Washington’s Reagan National Airport was for highs of 102°F, 104°F, and 103°F for Thursday through Saturday, July 2-4. These readings would melt the D.C. daily records of 101°F, 101°F, and 100°F. In observations that go back to 1871, Washington has never recorded two consecutive days of 103°F, and the only three-day streak of highs reaching at least 102°F occurred way back on July 19-21, 1930.
Further north, the nation’s first capital city, Philadelphia, was on track for predicted highs of 103°F, 103°F and 101°F on Thursday through Saturday, which would tie the daily record on Thursday and approach the city’s monthly record of 104°F set on July 3, 1966. For what it’s worth, the temperature recorded in Philadelphia by president-to-be Thomas Jefferson at 1:00 p.m. on the day the Declaration of Independence was signed – July 4, 1776 – was a mere 72.5°F.
In New York, Central Park had already reached 100°F by 2 p.m., the first time it has reached the century mark since July 18, 2012. The forecast was for 101°F on Friday and 97°F on Saturday. In 157 years of recordkeeping, Central Park has only had 5 pairs of consecutive days that both reached at least 101°F. The only pair of 102°F readings at Central Park occurred during the height of the central U.S. Dust Bowl on July 9-10, 1936.
Original article, posted on Monday, June 29:
As our fossil-fuel-warmed world careens into what’s likely to be months of record global-scale heat goosed by El Niño, early season heat waves are already proving tragic this summer. Most of central and northern Europe was assaulted over the past week by the continent’s worst heat wave ever recorded before the core summer months of July and August, and at least 1,300 people have died as a result.
Meanwhile, extreme heat watches extended along the U.S. East Coast on Monday from New Jersey and eastern Pennsylvania to southern Maine, foretelling a miserable and potentially record-setting heat wave that will run from midweek into the Fourth of July holiday across much of the U.S. east of the Appalachians. Heat indexes – reflecting air temperature plus humidity – may exceed 110 degrees across much of the extreme-heat watch area.
As of midday Monday, the official forecast for Washington’s Reagan National Airport was for highs of 99°F, 103°F, 103°F, and 101°F for Wednesday through Saturday, July 1-4. The city has never recorded two consecutive days of 103°F, and only a handful of heat waves have produced four-day strings of 99°F. In New York, Central Park’s forecast highs of 91°, 96°, 95°F, and 91°F for July 1-4 wouldn’t be as historic, but they would still make for a hot, sweaty lead-up to the holiday, especially with lows possibly staying above 80°F for two nights.
The National Weather Service office warned folks in and around Philadelphia: “Very warm low temperatures in the mid 70s to low 80s at night will not offer any relief from the heat. This combined with multiple days of near record-breaking temperatures will exacerbate the impacts from the heat and humidity.”
How climate change influences extreme weather
Posted on 6 July 2026 by Guest Author
This is a re-post from The Climate Brink by Andrew Dessler
I am finalizing a textbook on climate risk and am posting chapters as I finish them. I’d previously posted chapters about embedded energy, physical climate risk, and transition risk. This post is a chapter on attribution of extreme weather to climate change. It is an emerging battleground in the public debate over climate change, so this chapter is an opportunity to get up to speed on the science.
Introduction
In the aftermath of any major weather disaster, the question inevitably arises: “Did climate change cause this disaster?” However, this is a bad way to think about the problem.Climate change does not cause a rainstorm, a heatwave, or a hurricane in a direct sense. These hazards would still occur in a world without human influence on the climate: hurricanes would still form over warm ocean waters, heatwaves would remain a product of stationary high-pressure systems, and low-pressure systems will always generate rain and the occasional flood.
But climate change can make these events more intense. It takes a heatwave and pushes the temperature higher. It adds moisture to a rain event, generating more intense rainfall, enhancing flooding. Warmer oceans make a hurricane’s winds stronger and its rainfall more severe.
Therefore, the scientifically interesting question is not “Did climate change cause this?”, but about influence:
1.How much morelikely did climate change make this event?
2.How much moreintense did climate change make this event?
Answering these questions is the work of a rapidly advancing field of science called Extreme Event Attribution. This chapter will explore the methods scientists use to disentangle the roles of natural variability and climate change.
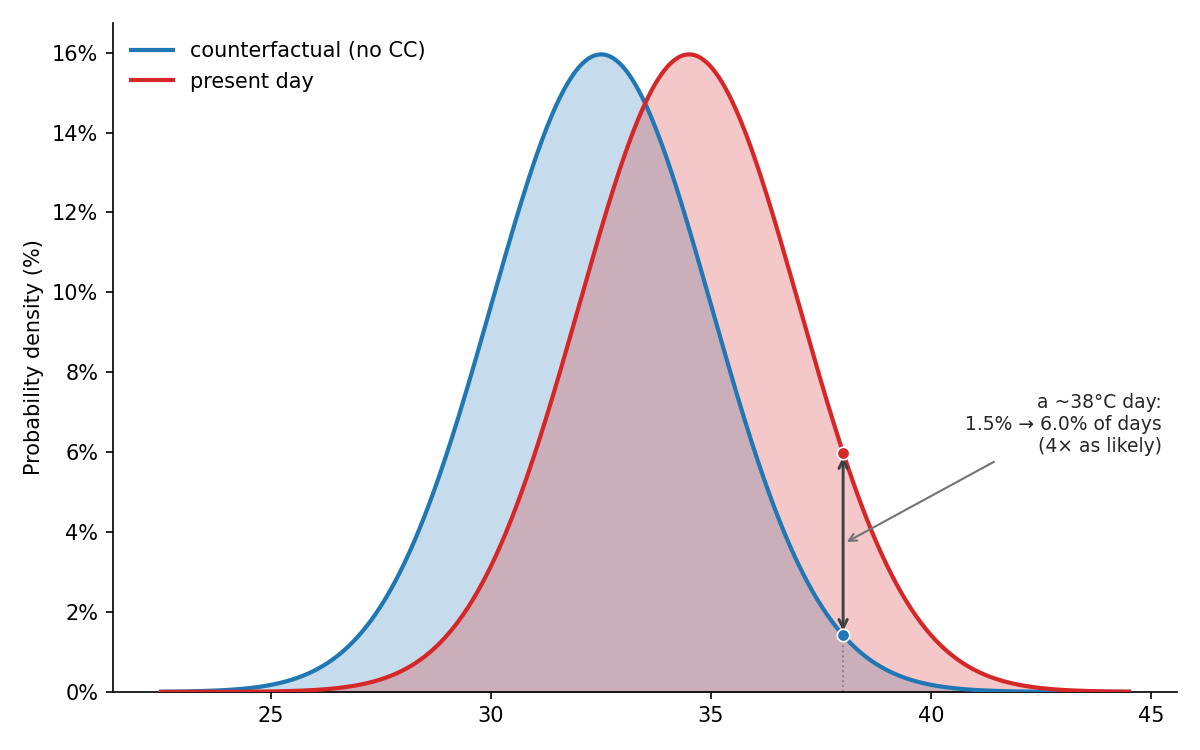
To understand the two different ways of looking at the problem, let’s examine a hot 38°C (99°F) day in a hypothetical city (like Houston, Texas) and examine each question in turn.
1. How much more likely has climate change made a 38°C day?
2026 SkS Weekly Climate Change & Global Warming News Roundup #27
Posted on 5 July 2026 by BaerbelW, Doug Bostrom
Stories we promoted this week, by category:
Climate Change Impacts (11 articles)
- The scientist and his family tracking melting glaciers for nearly half a century PBS NewsHour, Ben Tracy, June 22, 2026.
- Europe’s record heatwave: does the continent have a new climate? Nature asks researchers whether scorching summers are the new norm for London, Paris and Berlin. Nature, Edward Chen, June 26, 2026.
- How climate change gets under the skin Researchers unearth clues about how repeat, overlapping climate stressors, from flood-related mold to warming water temperatures to higher pollen counts, affect everyone Grist, Zoya Teirstein, Jun 28, 2026.
- Climate change to blame for intensity of Europe heat wave: Scientists Phys.org, Nick Perry, Jun 28, 2026.
- Could this be Australia`s warmest winter ever? The seasons underway in Australia exemplify a worldwide trend of unseasonably high temperatures, including the early summer heatwave in western Europe. The Conversation, Milton Speer, University of Technology Sydney, Lance M Leslie, University of Technology Sydney, Jun 29, 2026.
- Loading the Heat Dice Without human influence, the recent European heatwave would have been more than 3°C cooler. Climate Trunk, John Lang, Jun 30, 2026.
- How climate change influences extreme weather How science shows us how warming makes heat waves, floods, hurricanes, and wildfires more likely or more severe — and why this science is becoming a major public-policy battleground. The Climate Brink, Andrew Dessler, Jun 30, 2026.
- The world`s oceans are the hottest on record for June - and El Niño is set to turn up the heat even more Average sea surface temperature is just under 21°C across the world’s tropical and temperate oceans, while before widespread industrialisation in 1870 the temperature was about 19.6°C. The Conversation, Matthew England, Alex Sen Gupta, Alistair Hobday, Jul 02, 2026.
- Tour de France braced for historic stage cancellations amid 44C European heatwave The 2026 Tour de France, which starts in Barcelona on Saturday, is steeling itself for climate change disruption with another extreme heatwave predicted to return to Europe in the coming days which could lead to stages being cancelled. The Guardian, Jeremy Whittle in Barcelona, Jul 02, 2026.
- Without Climate Change, U.S. Heat Wave Called `Virtually Impossible` Scientists have said the conditions are the result of a climate that is “fundamentally different” from the time before fossil fuel use started rapidly warming the world. NYT, Raymond Zhong, Jul 03, 2026.
- Sydney records hottest June since 1859 as expert warns new high a `signature` of global warming Prof Andy Pitman, a Sydney-based climate scientist, expressed a “complete lack of surprise” at the new record. The Guardian, Ima Caldwell, Jul 04, 2026.
Skeptical Science New Research for Week #27 2026
Posted on 2 July 2026 by Doug Bostrom, Marc Kodack
Open access notables
Warming climate has lengthened global intense tropical cyclone seasons, Liu et al., Nature Communication
Intense tropical cyclones (TCs), which pose serious threats to human life and property, often occur within a short period of time each year, known as the intense TC season. Changes in the lengths of intense TC seasons under climate change are critical scientific and socioeconomic issues. While trends in overall TC seasons have been widely studied, the response of intense TC seasons to climate change remains underexplored. Here, we show that intense TC seasons have been lengthening globally since 1980, with statistically significant increasing trends ranging from 9.9–13.8 days/decade across all basins, equivalent to 7.4–21.9% increase in intense TC season lengths per decade. This is primarily due to the enhancing probability of off-season TCs experiencing rapid intensification, which is partly driven by oceanic warming. Meanwhile, changes in background atmospheric circulation play a role in the complexity of intense TC seasonality change. As a result, off-season TCs are more likely to develop into intense TCs. The findings in this study indicate an increasing exposure of human societies to intense TC risks outside historical seasonal norms. This suggests the urgent need for preparation and mitigation measures for the potential risks of intense TCs under future climate change.
Abrupt permafrost thaw drives exceptional carbon release across the Tibetan Plateau, Jia et al., Nature Communications
Climate warming is accelerating abrupt permafrost thaw, driving substantial carbon emissions. Retrogressive thaw slumps (RTSs) represent the most severe instance of abrupt permafrost thaw, yet their carbon emissions remain poorly quantified due to limited observations. Here, by synthesizing 4728 RTS incidents and 1862 in-situ CO2 and CH4 measurements from RTS-affected zones across the Tibetan Plateau, we estimate that the area of RTS susceptibility will expand by 17–19% by 2100 relative to 2022, driven primarily by precipitation changes. Compared to control areas, the ecosystem respiration rate in collapsed areas decreases by 14.4%, while CH4 release rate increases by 20.0%. The combined CO2 and CH4 release associated with RTS expansion increased 1.1-fold between 2016 and 2022. Under the intermediate Shared Socioeconomic Pathways scenario, carbon emissions from RTS-susceptible areas are projected to surge 2.7-fold by 2100. These findings highlight that abrupt thaw strengthens permafrost carbon-climate feedback in high-altitude regions, underscoring the urgent need for targeted permafrost protection strategies to achieve carbon neutrality goals.
Influence of seismic energy dissipation technology on carbon emission of building construction, Zhang et al., Scientific Reports
This study aims to simultaneously enhance structural safety and reduce carbon emissions using the seismic energy dissipation technology. Eight reinforced concrete frame structures with varying numbers of floors are selected as case studies in accordance with the Chinese design code. By incorporating additional energy dissipation devices, the required dimensions of structural components in structures with damper (SWD) are reduced compared with structures without damper (SWOD), thereby lowering carbon emissions and improving seismic performance. Both SWOD and SWD systems are designed for each of the eight reinforced concrete frame structures for comparative analysis. Structural component dimensions are calculated using SAUSG software, and key performance indicators, including the natural period and inter-story drift ratio, are analyzed to verify compliance with code-specified safety requirements. Engineering quantities and life-cycle energy consumption are quantified, including the production and transportation of materials, as well as construction and dismantling stages. The results indicate that SWDs reduce material and energy consumption, with average carbon emissions 17.4% lower than those of SWODs. This study provides a novel perspective on carbon emission reduction during the design phase and offers an effective technical pathway for the coordinated development of low-carbon buildings and seismic resilience.
Ideological drivers of climate obstruction and delay: political parties and public opinion in Spain, Ochoa et al., Journal of Environmental Studies and Sciences
This study contributes to the growing body of international research examining how political actors strategically resist or slow down climate action despite scientific consensus. It combines a cross-sectional public opinion survey with a systematic analysis of political party manifestos. The study identifies clear ideological differences between parties and their supporters in regard to how climate change is framed and addressed. While most respondents acknowledge anthropogenic climate change and express support for stronger government action, significant segments resist lifestyle changes and consider resource extraction to be unavoidable. Left-leaning voters tend to emphasize collective responsibility and call for stronger public intervention. In contrast, conservative and far-right voters are more likely to downplay human causation, prioritize economic growth, and frame climate disruption as being driven by natural forces. Party programs across the political spectrum indeed mirror these tensions by promoting incremental rather than transformative measures. The Far-right nationalist narratives of sovereignty and securitization further serve to delegitimize mitigation efforts. The Old and New Right parties try to avoid regulations and thus oppose decisive government intervention in environmental matters. The findings show that political polarization plays a central role in shaping attitudes towards climate policy in Spain, in line with broader European trends whereby far-right parties promote climate delay narratives. The research also identifies that climate delay is a structural phenomenon, rooted in the intersection of ideologies such as capitalism, nationalism, and patriarchy, rather than a purely partisan one.
Negative partisanship, positive partisanship, and variation in climate policy attitudes on the political right, Huddart et al., PNAS Nexus
Conservatives are more likely than liberals to oppose climate policies, resulting in political polarization over climate change. Most research treats this gap as if it reflects two cohesive blocs on opposite sides of an issue. Drawing on original survey data from a probability sample of Canadians (n = 2,503), we find that while liberals are highly uniform in their orientation toward climate policies, conservatives are far more heterogeneous. Further analyses reveal conservatives' policy positions strongly correlate with their partisan affect—both the extent to which they dislike opposing liberals (negative partisanship) and the extent to which they like fellow conservatives (positive partisanship). These findings highlight the importance of considering variation within, and not just between, political sides. The results additionally suggest that reducing hostility toward the other side (particularly among conservatives) may facilitate cross-ideological climate coalitions.
From this week's government/NGO section:
Global trends in climate change litigation: 2026 snapshot, Joana Setzer and Catherine Higham, Global School of Sustainability, London School of Economics
The authors identify the following key trends for the period January to December 2025: in 2025, 249 new climate cases were filed, bringing the total since 1986 to more than 3,600 cases. Over three quarters of these cases have been filed since 2015, the year of the Paris Agreement. Cases have been filed across 62 countries, up from just 17 countries a decade ago. In 2025, cases were newly filed in Grenada, Guatemala, Kazakhstan, Malaysia, Singapore and Zambia. • The United States remains the jurisdiction with the highest number of cases: 151 new cases were recorded in 2025, bringing the total to 2,078.
Fossil fuel emissions have rapidly worsened European heatwaves in just a few decades, Keeping et al., World Weather Attribution
Just weeks after a severe heatwave that broke all-time May records, Europe is experiencing another major heatwave that is breaking June and annual records. This is particularly remarkable given that June is not historically the hottest month in Western Europe. The authors assessed to what extent human-induced climate change altered the likelihood and intensity of the extreme heat in Western Europe. The analysis focuses on the 3 hottest days and nights over the most affected area and additional analysis of the 19 capitals of the affected countries. This June 2026 heatwave occurred under a circulation pattern broadly similar to historical analogues – Southerly Flow. However, a similar circulation pattern now produces significantly hotter temperatures than it did in the mid-20th century because the climate baseline has warmed. This summer shows that at 1.4°C of global warming, extreme heat is already reaching the limits of our societies’ ability to cope. The analysis shows that intense heat is increasing rapidly even in living memory, with such events tens to hundreds of times more likely since only 2003 and virtually impossible just 50 years ago.
120 articles in 58 journals by 790 contributing authors
Physical science of climate change, effects
AMOC response to historical freshwater increase, Devilliers et al., Nature Geoscience 10.1038/s41561-026-02028-8
Barents-Kara Sea Ice Variability Drives Stronger Tropospheric Anomalies Over East Asia After 2000 Due To Weakened Stratospheric Polar Vortex, Zhang et al., Journal of Geophysical Research Atmospheres 10.1029/2025jd046058
Climate Adam - Is Climate Change Ramping Up El Niño Risks?
Posted on 1 July 2026 by Guest Author
This video includes personal musings and conclusions of the creator and climate scientist Dr. Adam Levy. It is presented to our readers as an informed perspective. Please see video description for references (if any).
Video description
El Niño has begun, and there's high risk that it could be a Super El Niño: bringing with it extreme weather, like heatwaves, droughts and downpours. And the world is bracing itself for record smashing temperatures. But is this natural swing in the climate partly down to climate change? Is climate change shifting the balance of El Niño? Either way, El Niño and climate change are combining to threaten us like we've never seen before.
Support ClimateAdam on patreon: https://patreon.com/climateadam
Fact brief - Are injuries from wind turbines common?
Posted on 30 June 2026 by Sue Bin Park
![]() Skeptical Science is partnering with Gigafact to produce fact briefs — bite-sized fact checks of trending claims. You can submit claims you think need checking via the tipline.
Skeptical Science is partnering with Gigafact to produce fact briefs — bite-sized fact checks of trending claims. You can submit claims you think need checking via the tipline.
Are injuries from wind turbines common?
Wind turbine collapses or blade failures are extremely uncommon, and wind power causes far fewer deaths per unit of electricity than fossil fuels.
Modern utility-scale turbines use monitoring and shutdown systems designed to handle extreme weather, including hurricanes. Concerns about blades breaking off were more common in earlier years of wind development, but improved engineering and hazard sensors have made these events exceedingly infrequent. One study estimated the turbine blade failure rate at about 0.54% per year, with the U.S. Department of Energy describing “catastrophic” failures as rare events.
Safety comparisons utilize “deaths per terawatt-hour,” which counts both direct accidents (like mining, drilling, transport, and plant accidents) and indirect deaths from air pollution or emissions. By this measure, wind is estimated to cause about 0.04 deaths/TWh, far below coal (24-33 deaths), oil (18), or natural gas (3).
Go to full rebuttal on Skeptical Science or to the fact brief on Gigafact
This fact brief is responsive to quotes such as this one.
Sources
Philosophical Transactions Damage tolerance and structural monitoring for wind turbine blades
US Department of Energy How Do Wind Turbines Survive Severe Weather and Storms?
US Department of Energy Wind Energy Projects and Safety
IOP Conference Series: Materials Science and Engineering A Critical Review of Damage and Failure of Composite Wind Turbine Blade Structures
US Department of Energy Wind Vision: A New Era for Wind Power in the United States
Our World in Data What are the safest and cleanest sources of energy?
Columbia Law School Sabin Center for Climate Change Law Rebutting 33 False Claims About Solar, Wind, and Electric Vehicles
Please use this form to provide feedback about this fact brief. This will help us to better gauge its impact and usability. Thank you!


