


 Arguments


Accumulated Cyclone Energy Questions and Answers
Posted on 17 January 2013 by Klaus Flemløse
Based on data from Maue, R.N. (2011), I have studied the development of Accumulated Cyclone Energy (ACE) in the years January 1970 - September 2012 by oceans. This analysis must be seen as complementary to what can be found at PoliClimate. ACE data are available here. Thanks to R.N. Maue for making data available.
Data exists from the following oceans:
- The Atlantic Ocean (Atl)
- The Eastern Pacific (Epac)
- The Western Pacific (Wpac)
- The Indian Ocean (Io)
- The Southern Hemisphere (SH)
This post is an attempt to provide an overview and a call for climate experts to prepare more comprehensive posts about tropical cyclones and not just for the Atlantic Ocean.
Due to the dominating position of the American news media we hear a lot about what is happening in the Atlantic Ocean in respect of tropical cyclones. This is not proportional to the number of tropical cyclones in the Atlantic Ocean compared to the total number of tropical cyclones worldwide.
Bjørn Lomborg has recently (in the Danish newspaper BT, 30 October 2012, translated by me), used a low value of ACE, as an argument against Al Gore and the link between global warming and Hurricane Sandy.
Bjørn Lomborg: There are no reasons to believe that Hurricane Sandy would be caused by global warming. It's a hurricane of relatively low strength - it is unusual jet stream, but this one was also in 1953. After Katrina in 2005 talked Al Gore much about that we would get much worse hurricanes, and since then the global hurricane index dropped to the lowest since 1970.
I do not claim that I have found the whole truth and got everything right in this post, because there are a number of other issues that should be addressed, namely the link to ocean temperature in the areas that are vulnerable to tropical cyclones and the link to the Atlantic Multidecadal Oscillation (AMO) or Pacific Decadal Oscillation PDO).
The random variation of ACE is determined by two sources: the random varation of the number of tropical cyclones and the random variation in the ACE for individual tropical cyclones. The first-mentioned variation can be described by a Poisson distribution and the other by a log-normal distribution, or other skewed distribution. The total ACE is thus a random sum of random variables. Therefore, it is expected that there will be a large variation in the total ACE from year to year. This will make it difficult to make definitive conclusions about trends.
If there was access to the data on the individual tropical cyclones both in terms of category and ACE, it will be possible to model the random variation of ACE.
Therefore it will be nice to have a database with all tropical cyclones that have catagory and ACE available.
On this background I hope experts in tropical cyclones will be helpful in providing better information about tropical cyclone and Accumulated Cyclone Energy to the readers of this blog than I can provide here and now.
Summary
1) There is no evidence of a systematic increasing or decreasing trend in ACE for the years 1970-2012.
2) There is a cyclical variation in the ACE of 6 and 12 months’ length
3) The contribution of ACE from the Eastern and Western Pacific is approximately 56% of the total ACE
4) The contribution of ACE from the Atlantic Ocean is approximately 13% of the total ACE
5) The minimum and maximum values of ACE per month are respectively 1.8 and 266.4
6) The average value of ACE per month is 61.2
7) The minimum and maximum values of ACE per year are respectively 416.2 and 1145.0
8) The average value of the ACE per year is 730.5
9) The total of ACE for 2012 through September is 540.8.
10) There is a correlation of ACE between some oceans
Overview
The following graph shows the development of ACE by oceans. The figures are stacked on top of each other. This means: the lower curve shows the Atlantic Ocean. The next graph shows the sum of ACE from the Atlantic Ocean and from the East Pacific, etc. [Click on the images in this post to see larger versions]
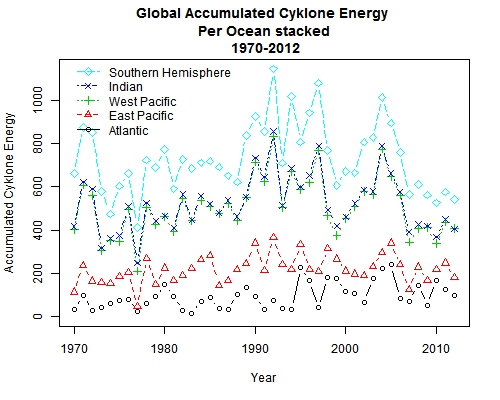
These curves show that there is a minimum in late 1970s, a maximum in early 1990s and another minimum around 2011. There is a considerable random variation in the ACE and therefore it is difficult to judge any trends.
We know that the Major Hurricanes have the largest contribution to ACE - approximately 30% - and since we know that their number is increasing because of increasing sea surface temperatures, an increase in the ACE is expected. This is a paradox. The estimated contribution to ACE from the Major Hurricanes is uncertain. I would be pleased if some might provide at better estimate.
If sea surface temperature by month for all tropical cyclone prone area were available, it will be interesting to investigate relations between ACE and sea surface temperature. Analysis of relations to AMO and PDO is also of interest.
The maximum/minimum value of ACE is observed in May 2012/September 2004 to be respectively 1.8 and 266.4.
The distribution of ACE by ocean appears in the following graph:
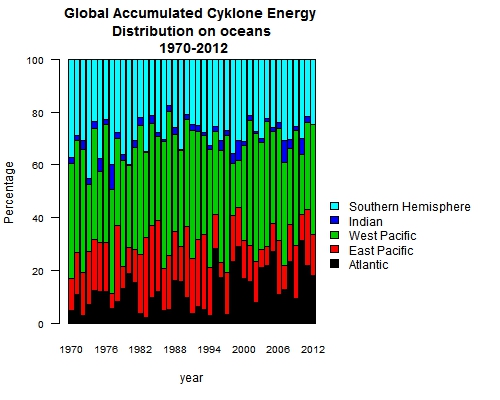
It is clear from this graph that the largest contribution to the total ACE comes from the Western Pacific. For all years the total ACE for the Atlantic Ocean, Eastern Pacific, the Western Pacific, The Indian Ocean and The Southern Hemisphere makes up 13%, 17%, 39%, 2% and 29% respectively. It looks like The Atlantic Ocean has an increasing share of ACE.
The news media are focused on what is happening in the Atlantic Ocean, despite the fact that the area represents only 13% of the total ACE.
The histograms of ACE per month and per year are presented in the following graph:
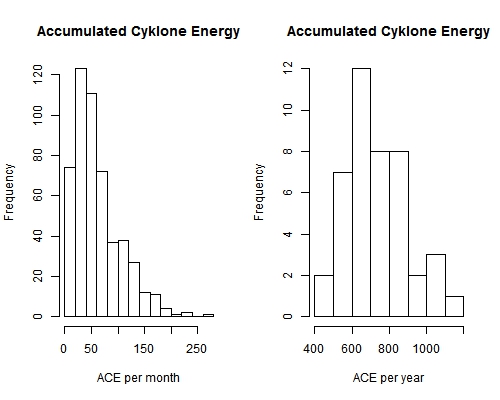
While the histogram of the monthly ACE is clearly skewed to the right, this is not the case for the annual ACE. "Skewed to the right" means many small values and few large ones.
Cyclic variation
There is a clear cyclic variation within a single year in the total ACE. This is shown in the following four graphs:
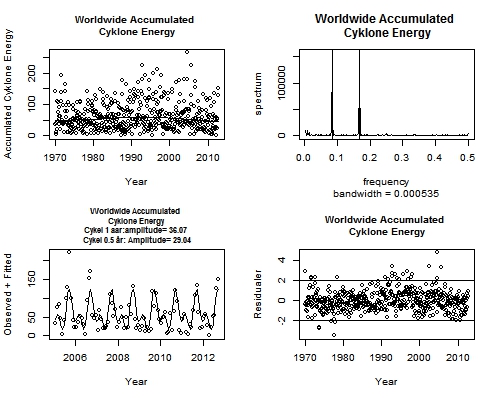
The top left graph shows the raw data with fitted curve i.e. a Lowess curve. The distribution of the points shows that ACE has a right-skewed distribution, i.e. many small values of ACE and fewer very large values.
The top right graph shows the spectrogram of ACE for the years 1970-2012. There are two distinct peaks corresponding to two cyclic signals of 6 and 12 months. This is expected due to the seasonal variations in the Northern and Southern Hemispheres respectively.
The lower left graph displays the observations with a fitted curve consisting of the sum of two harmonic oscillations with periods 6 and 12 months, but only for the years 2005-2012. The fitted curve can only explain approx. 55% of the variations in the ACE. There is no linear trend. This means that the level of ACE is constant over the entire period. There is, therefore, a conflict between the visual impressions of the evolution of ACE from the very first graph in this analysis.
The bottom right graph shows the standardized residuals. In total there are 513 observations, of which 27 observations are outside the range [-1.96, 1.96], where 5 % is expected and 5.3 % is observed. The present model does not fully cope with the fluctuations in mid-1990 and mid-2000.
A possible conclusion is that there has not been observed a global warming signal in the development of ACE during the years 1970-2012, since the global temperature has increased over the same years.
This is expected according to the IPCC. This can be found here Has there been a Change in Extreme Events like Heat Waves, Droughts, Floods and Hurricanes? and here Evidence for Changes in Tropical Storms
Correlations
It is obviously of interest to investigate whether there are any correlations of ACE between oceans. This is done in summary form in the following graph:
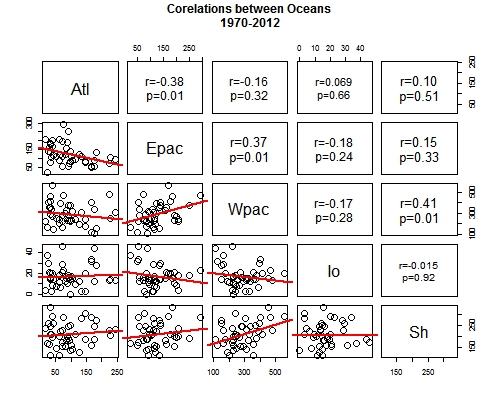
In the above graph there are 25 panels in 5 rows and 5 columns. The name of the ocean is shown in the diagonal. The naming of the cells given by (1,1), (1,2). ..:
Atlantic Ocean and Eastern Pacific
There has been a significant negative correlation of -0.38. This is shown on the panel (1,2) and the graph of the panel (2,1). This means that if there is a large positive deviation in ACE in the Atlantic Ocean, a large negative deviation is expected in the Eastern Pacific and vice versa. In this way, the tropical cyclone in the Atlantic Ocean and in the Eastern Pacific is a seesaw.
The Western Pacific and Eastern Pacific
There has been a significant positive correlation of 0.37. This is shown on the panel (2,3) and the graph of the panel (3,2). This means that if there is a large positive deviation of ACE in the Eastern Pacific, a large positive deviation is expected in the Eastern Pacific. The tropical cyclone in the The Western Pacific and Eastern Pacific are cooperating. Both are up and down at the same time.
The Western Pacific and the Southern Hemisphere
There has been a significant positive correlation of 0.41. This is shown on the panel (3,5) and the graph of the panel (5,3). This means that if there is a large positive deviation of ACE in the Western Pacific, a large positive deviation is expected in the Southern Ocean. The tropical cyclone in The Western Pacific and the Southern Hemisphere are cooperating. Both are up and down at the same time.
There have been no other correlations than those described above.
It seems a little surprising that there is a negative correlation between ACE in the Atlantic Ocean and Eastern Pacific. The other correlations are expected as a result of neighboring oceans.
I would be pleased if some could guide me to monthly average temperatures for each hurricane prone area of the various oceans.
Remarks
In this post I have asked more questions than given answers.
The most important question I have asked is how to define a common accepted definition of tropical cyclone areas by oceans and with corresponding sea surface temperatures.
The cycles of 6 and 12 month duration in the variation of ACE is not a surprise. However, this does not exclude that there might be a cyclic variation of a longer duration.
I have found out that the ACE in Atlantic Ocean and Eastern Pacific is negatively correlated. This means that they make up a seesaw. Therefore you can’t use the Atlantics Ocean as an indicator for the tropical cyclone activity worldwide.
I have found out the ACE in the Western Pacific is positively correlated with Eastern Pacific and Southern Hemisphere as well. This means you can use the ACE in the Western Pacific as an indicator for the tropical cyclone activity in The Eastern Pacific and in the Southern Hemisphere.
Even if we know that the sea surface temperatures have been increasing, this is not manifested in a corresponding increase in ACE. This is a paradox.
This post is written with the right to be updated if errors and misunderstanding are discovered or new knowledge emerges.
Links:
Changes in Tropical Cyclone Number, Duration, and Intensity in a Warming Environment
Climate Variability and Change: Impacts on Atlantic Hurricanes


OK, I've come to this quite late.
I've just started looking at ACE values.
My background is in data science and not "real" science, so I've found a trend in global ACE over time using some simple methods. Perhaps too simple.
I was wondering what is the EXPECTED change to global ACE for a gradual change in surface temps of say 1C.
I can see via various means an estimate of a very transient change can be obtained using seasonal variations in ACE/surf temps. But that — of course — gets an expected change in ACE per deg C that is quite large.
I'm looking for a "fudge factor" more than anything else, that might account for buffering effects that might give a ballpark equilibrium change in ACE for a 1C change in surf temps.
Any ideas?