Climate Science Glossary

Term Lookup

Enter a term in the search box to find its definition.

Settings

Use the controls in the far right panel to increase or decrease the number of terms automatically displayed (or to completely turn that feature off).

Term Lookup

Settings


All IPCC definitions taken from Climate Change 2007: The Physical Science Basis. Working Group I Contribution to the Fourth Assessment Report of the Intergovernmental Panel on Climate Change, Annex I, Glossary, pp. 941-954. Cambridge University Press.

Home Arguments Software Resources Comments The Consensus Project Translations About Support

Bluesky Facebook LinkedIn Mastodon MeWe

Twitter YouTube RSS Posts RSS Comments Email Subscribe


Climate's changed before
It's the sun
It's not bad
There is no consensus
It's cooling
Models are unreliable
Temp record is unreliable
Animals and plants can adapt
It hasn't warmed since 1998
Antarctica is gaining ice
View All Arguments...


Username
Password
New? Register here
Forgot your password?

Latest Posts

Archives

Arctic sea ice takes a first nosedive

Posted on 20 June 2012 by Neven

If you want to mislead people into thinking that there is nothing weird going on in the Arctic, you have to do it during winter. In winter things almost look normal on some graphs, with gaps between trend lines and long-term averages not as ridiculously big as during spring and summer. If you're lucky anomalous weather patterns can make those trend lines come real close to the long-term average, and you'll have a couple of weeks of shouting 'recovery', ridiculing scientists and suggesting graphs are being cooked. It's an annual ritual on pseudo-skeptic blogs, which is only logical. The Arctic is becoming ever more problematic for their life work, ie denying AGW could ever be a problem and thus delaying any meaningful action on mitigating the consequences of AGW. Thank God water still freezes in winter.


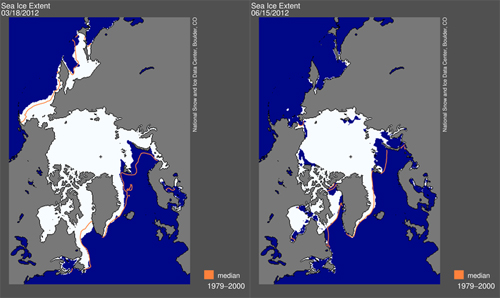
Sea ice extent maximum on the left and how it looks now on the right (source: NSIDC)

But what happens in winter is only interesting in so far as it influences the melting season that comes after it. The fact that this year saw a late finish to the freezing season, with an extreme expansion of sea ice into the Bering Sea, was far from irrelevant, but it didn't tell the whole story either. Another part of that story was covered in a guest blog on ClimateProgress in February (Arctic Sea Ice Update: Spectacular and Ominous), and the whole story as I saw it was told in this SkS post: Arctic Winter Analysis. It quite simply came down to this: "Sea ice on the Atlantic side of the Arctic looks vulnerable, sea ice on the Pacific side should be thicker."

The melting season is well underway now and in the last two weeks sea ice has been disappearing so fast that 2012 is leading all other years on practically all sea ice extent and area graphs. Take for instance this graph I've made, based on Cryosphere Today sea ice area data:

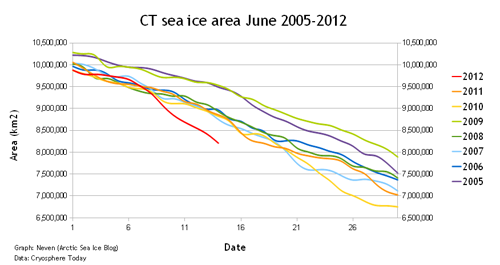
That looks pretty spectacular, doesn't it? Sea ice area has never been so low for this date in the satellite record, not even close to it. 2012 has over half a million of square kilometres less ice than record minimum years 2007 and 2011.

There was a distinct possibility this would happen, although I didn't expect it to happen quite this early. But now that it has happened, it's not difficult to see what the causes are. First of all, the extra ice in the Bering Sea that caused the late maximum, was wafer-thin and so has now virtually disappeared (I compared this year's situation with previous years in this post on the ASI blog). All the easy ice is as gone as the easy oil.

Second, that vulnerability on the Siberian side of the Arctic is becoming ever more visible, with the Northern Sea Route possibly opening up for commercial shipping very early this year. Here's a comparison to previous years for the western part of the Northern Sea Route (the eastern side doesn't look so great either):

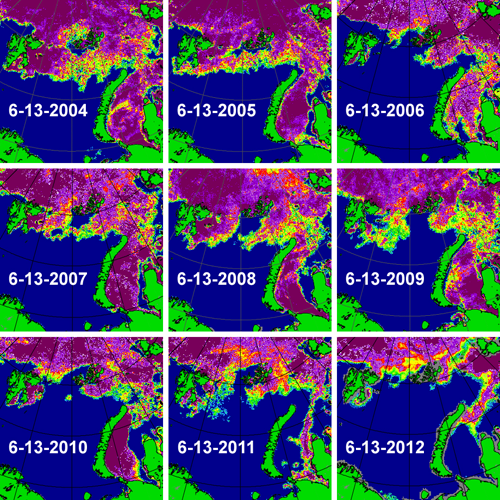
Go to Cryosphere Today to see how the Arctic regions are called

A third reason for the recent rapid decline is the widespread formation of melt ponds on ice floes. These are fooling satellite sensors into believing that there is open water where there actually isn't, causing sea ice area to go down faster than sea ice extent. The NSIDC FAQ page explains it well:

A simplified way to think of extent versus area is to imagine a slice of Swiss cheese. Extent would be a measure of the edges of the slice of cheese and all of the space inside it. Area would be the measure of where there is cheese only, not including the holes. That is why if you compare extent and area in the same time period, extent is always bigger.

One could say those melt ponds are making the trend lines artificially low, especially on sea ice area graphs. Although this is true, it isn't the only reason for the recent nosedive and at the same time it's an indication of how much the Sun is beating down on the Arctic right now. We are approaching Summer Solstice, meaning that the Sun shines practically all day in these northern latitudes, and thus heat will accumulate everywhere where there are clear skies and no ice to reflect the incoming sunshine.

This effect has started to become visible on the sea surface temperature anomalies all around the Arctic:

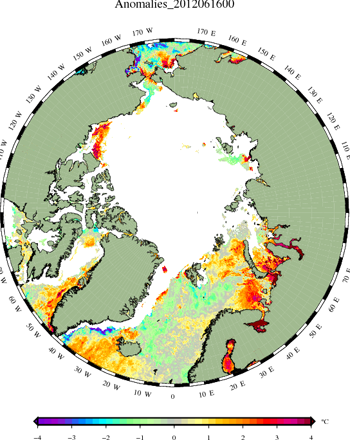
source: Danish Meteorological Institute

The water seems to be warming up big time in the polynyas (large stretches of open water) that recently opened up, especially in the Kara and Barents Seas, that are 'coincidentally' thought to be a source for some of the blocking patterns that cause outbursts of cold air to spill out from the Arctic and cause extreme winter conditions further down on the Northern Hemisphere (also known as WACC, Warm Arctic Cold Continents).

One could also say that the stage is being set for the latter part of the melting season, as sea surface temperatures play a big role in the final outcome of the melting season. But that's a worry for later. What can we expect in the short-term? Will trend lines continue to plummet?

Short answer: I don't think they will. The weather conditions that let all that built-up melting potential come to fruition, are in the process of switching. And although this means that those Siberian Seas are also going to get a good dose of sunshine, and the Northwest Passage (which is still chock-full of ice right now) will start opening up as well, the speed of the decline will probably level off a bit on those sea ice extent and area graphs. Until weather conditions switch again, of course.

Here's a brief explanation of how it works in general with those Arctic weather systems:

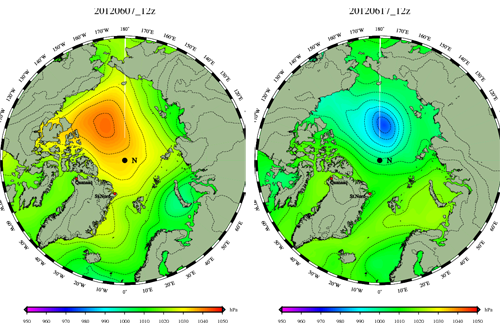
These images from the Danish Meteorological Institute show the distribution of sea level pressure (SLP) in the Arctic. The image on the left is from 10 days ago and has a big red/orange blob over the Beaufort Sea and the Arctic Basin. This was the big high-pressure system that was responsible for the rapid decline of the past two weeks. High-pressure systems do two things. They bring clear, cloudless skies and they cause winds that turn in a clockwise (or anti-cyclonic) direction. Those black lines are called isobars and they give an indication of how the winds are blowing. In this case those winds caused the ice to move away from the Canadian coast, and on the other side of the Arctic to be blown out into the Atlantic (some of that ice being thicker, multi-year ice).

We see the exact opposite in yesterday's SLP image on the right. This low-pressure system has moved over the Central Arctic in the last couple of days, bringing clouds and cyclonic, anti-clockwise turning winds that makes the ice pack turn in reverse again. It won't make the melting stop, in fact, clear skies over the Siberian Seas will guarantee a lot of heat accumulation there (which will come into play at the end of the melting season and the start of autumn), but trend lines on the various sea ice area and extent graphs will stop falling off a cliff. The current weather forecast is for this low-pressure system to dominate the Arctic for the coming 4-5 days. After that it's anybody's game.

And so I conclude: Nothing in the Arctic is a dead certainty. But if one thing is clear after the first phase of the melting season, it's that there's a very high chance of records being broken again if this year's weather conditions resemble those of last year or 2010. This of course has to do with a high probability that the ice pack is overall thinner than ever. If weather patterns resemble those of 2007, the year of the perfect storm (with high-pressure systems on the American side of the Arctic for the entire melting season), it will become clearer than ever that something weird and potentially dangerous is going on in the Arctic.

I'll report again if and when something worthwhile happens. In the meantime go to the Arctic Sea Ice blog if you want to read more regular and detailed updates. And check the daily updated graphs, maps and webcams on the Arctic Sea Ice Graphs website.

0 0

Printable Version  |  Link to this page

Comments

Comments 1 to 19:

  1. Neven, Great post & blog. I notice that JAXA seems to have revised downwards the big breaks they were posting for the past few days, and the Arctic Oscillation has turned positive. You have provided an excellent answer to the question I was going to ask!
    0 0
  2. Back in the day when frosts were common here*, I used to watch the frozen puddles go from being almost completely sheeted in ice to clear water in just a matter of minutes, once the mornings had warmed sufficiently. So it will be, I predict, that Arctic summer sea ice extent will appear to be still 'relatively' high for some small number of years into the future, but following a few warm summers that summer sea ice will spectacularly disappear - like the thinning ice used to do on the puddles on the west side of my house. Of course, anyone who follows Arctic sea ice volume (or thickness) rather than area/extent will not be caught off-guard, but I am sure that come the time there will be loud brays of faux surprise from those who currently claim that there's nothing more happening than a breezy shifting of a few burgs. [*Prior to the last decade it was usual in my area to have had by this time of year, as the austral winter approaches, about a dozen or so of of those teeth-setting crunchy frosts. So far this year we've had nothing even remotely resembling ice. There have been other changes too - to avoid going off-topic, I'll just note that I commented about them on Deltoid's June Open Thread, at tmie-stamp June 15, 12:57 pm.]
    0 0
  3. Worth to mention here, but Tamino has also posted on his blog about Arctic Sea Ice: http://tamino.wordpress.com/2012/06/17/sea-ice-update/
    0 0
    Moderator Response: [Sph] Hot linked.
  4. Bernard, actually when the ice disappears I'm quite confident that the skeptic response will be, 'So what? Everyone knew that was going to happen. It is perfectly normal. Happened back in the 1930s too. Natural cycle. Look, e-mails!' All of which is, of course, completely insane... but insanity will be pretty much all that is left for 'skeptics' at that point. BTW, the first 'SEARCH' ice extent predictions for the year have been released. These were submitted prior to the recent rapid decline, but all predictions (even Watts) are for far below normal September extent. PIOMAS is also showing the same sharp drop in volume anomaly (i.e. the volume decline is much greater than average) starting in May which has characterized the past few years. What we've been seeing with extent and area in June suggests that this volume trend is continuing.
    0 0
  5. @ shoyemore I notice that JAXA seems to have revised downwards the big breaks they were posting for the past few days, and the Arctic Oscillation has turned positive. You can disregard that latest data point that JAXA reports. It's very low every day, and then gets revised significantly the next day. I don't use it for the ASI updates. Here's another tip with regards to that last bit about weather patterns: If you go to the ECMWF weather forecast on Wetterzentrale you can click on N-Hem. and then the daily forecasts (24h, 48h, 72h, etc) at 500 hPa. This allows you to see a couple of days in advance where the highs and lows are going to be. In 5 to 6 days that low that is dominating right now, is forecast to get pushed back again, with highs taking over the Canadian Archipelago and part of the Beaufort Sea. I'd like to be cautious, but if this comes about, there could be some more big drops keeping 2012 in the driver's seat. We'll see. A 6 day forecast can change from day to day.
    0 0
  6. The NSIDC has an extra June update explaining the recent nosedive.
    0 0
  7. CBD@4: I *especially* love your subtle use of humor, in your post, by using the future tense; "will be." "...insanity will be pretty much all that is left for 'skeptics' at that point." Ar ar....{;=P
    0 0
  8. Neven, Thanks, can you explain those Wetterzentrale maps, please? What does T mean? I presume H is high pressure, and the colour is the pressure gradient. Not knowing German makes it difficult. I see Ireland has a massive gloomy spot over it. That figures - national team dumped unceremoniously out of the European Cup (soccer) with nul points.
    0 0
  9. shoyemore, I don't speak German, but from this I would guess that T is for trog (low pressure) while H is for hoch or hochdruck (high pressure). GPDM is short for geopotential decameters, while bodendruck is "pressure".
    0 0
  10. shoyemore, This explanation of how to read such maps is helpful (armed with T = low and H = high).
    0 0
  11. The T stands for Tief, I believe, which is German for Low. Looking at the SLP numbers also helps. Anything above 1013 millibar or hPa is high-pressure system, below is low-pressure. So when from one isobar (the white lines) to the other the pressure goes up (for instance from 1015 to 1020 to 1025, etc) there's a high-level pressure system there. I don't look at the letters and colours too much, mostly the numbers and the shape of the isobars (telling me the direction of the wind). Again, it's very crude, but it works reasonably well. Highs on the Canadian side of the Arctic, and lows on the Siberian side, also known as the Dipole Anomaly, make the Beaufort Gyre gyre, the Transpolar Drift Stream drift. The ensuing ice transport, combined with clear skies and eventually pulling in of warm Pacific waters through Bering Strait (as happened in 2007), makes for the fastest ice decrease in summer.
    0 0
  12. Thanks for that link, Sphaerica. That's a better explanation than I could ever come up with.
    0 0
  13. Neven & Sphaerica, Thanks guys. I am now fully armed for the melt season.
    0 0
  14. Now that you know what to look for, shoyemore, check out today's ECMWF weather forecast, click N-Hem. and then 144h onwards on the 500 hPa, SLP row. You see those huge high-pressure systems over the Canadian Archipelago? If those come about, the ice in the Northwest Passage is going to break up so hard.
    0 0
  15. The irony about the north passage opening up, is that it is attracting suggestions that there could be good prospects for oil. Maybe they can also mine coal on some of those frozen lands when the ice is gone?!
    0 0
  16. I forgot to say: anyone who wants to compare current ice cover to that of previous years, can have a look at the concentration maps on the Arctic Sea Ice Graphs website. It's a quick way to see how weird or unusual something really is, or just which regions are melting out faster or slower compared to previous years.
    0 0
  17. I have looked at this incessantly (really, I should get help) for years now. I have a list of bookmarks a mile long. I glance at but ignore the charts. I instead look at a number of different sites that show concentration and thickness. I also tend to try to watch the animations, to get more of a temporal/spacial sense of the change. And this year is NOT your father's Arctic ice melt. The starting point was very, very different, not in extent but in thickness, and the progression has been very different. I will not be at all surprised if the bottom completely drops out this year, but if it doesn't, it's only because it's laying the groundwork for the bottom to drop out next year. Two things matter (IMO): 1) The ice is now so thin and fragmented that wind and currents are making a major contribution to the process. This wasn't possible 20 years ago, because the ice was too thick and interconnected until too late in the season. 2) What really matters is each year's "annual progress" on the thick, mostly permanent ice off the north coasts of Greenland, Ellesmere Island and the Queen Elizabeth Islands. That ice looks to me like the foundation on which everything else rests. The end will come quickly when that fragments enough to drift out and be carried physically, by wind and current, in fragments, to places where it can more easily melt away. This year looks like it could be "that year."
    0 0
  18. Right there with you Sphaerica. One interesting thing with the thin ice this year was how early the Laptev Sea and Beaufort sea ice broke up. This actually appears to have been caused by relatively 'warm' water from the rivers (Lena and MacKenzie) feeding into those seas being sufficient to melt the ice. That's just shocking, especially for the Beaufort which used to be locked in thick ice. The projections showing that Arctic sea ice will continue to hold out for a few more decades (which are themselves a significant downward revision from the last IPCC projections) have seemed increasingly tenuous as the volume continued to disintegrate. If the volume trend continues, the ice will be gone (in September) within just a few years. As you note, the only thing preventing that at this point is the small core of older ice along the north edge of the Canadian archipelago. CryoSat II may have been launched just in time to observe the final few years of the Arctic disintegration... rather than to gather enough data to more accurately predict in what future decade that might occur.
    0 0
  19. The solstice occurred on the 20th (where I am) this year, but in some years it occurs on the 21st or 22nd. So could comparing to same day-of-year be adding noise? Should comparison be made instead to days relative to the solstice?
    0 0

You need to be logged in to post a comment. Login via the left margin or if you're new, register here.


The Consensus Project Website

THE ESCALATOR

(free to republish)


© Copyright 2024 John Cook
Home | Translations | About Us | Privacy | Contact Us