Climate Science Glossary

Term Lookup

Enter a term in the search box to find its definition.

Settings

Use the controls in the far right panel to increase or decrease the number of terms automatically displayed (or to completely turn that feature off).

Term Lookup

Settings


All IPCC definitions taken from Climate Change 2007: The Physical Science Basis. Working Group I Contribution to the Fourth Assessment Report of the Intergovernmental Panel on Climate Change, Annex I, Glossary, pp. 941-954. Cambridge University Press.

Home Arguments Software Resources Comments The Consensus Project Translations About Support

Bluesky Facebook LinkedIn Mastodon MeWe

Twitter YouTube RSS Posts RSS Comments Email Subscribe


Climate's changed before
It's the sun
It's not bad
There is no consensus
It's cooling
Models are unreliable
Temp record is unreliable
Animals and plants can adapt
It hasn't warmed since 1998
Antarctica is gaining ice
View All Arguments...


Username
Password
New? Register here
Forgot your password?

Latest Posts

Archives

The Last Interglacial Part Two - Why was it so warm?

Posted on 6 July 2011 by Steve Brown

NOTE: This is the second article of a five-part series on what we can learn from the Last Interglacial time period. Understanding this period may provide clues on how the environment may respond to similar conditions in the future. In the first post, we described the conditions that exisited during the Last Interglacial. In this post, we we examine two of the key factors that caused the conditions described in the first post. 

In the previous installment of this series on the Last Interglacial; also known as the Eemian in Europe, we learnt that it was a period that was warmer and wetter, with smaller ice sheets and higher global sea level.   Three of the the key factors in determining the conditions that existed during the Last Interglacial are:

  1. Changes in solar insolation, which is a measure of solar radiation energy received on a given surface area in a given time commonly expressed as average irradiance in watts per square meter (W/m2).
  2. Changes in the concentrations of greenhouse gasses in the atmosphere.
  3. Changes in the albedo of the Earth, which is a measure of how much energy from the Sun is absorbed due to changes in reflectivity of the Earth's surface, such as from changes in snow and ice cover.

The IPCC Assessment Report 4 describes palaeoclimatic proxy evidence from the Last Interglacial, which estimates that the largest warming then was in northern Greenland and Eurasia of ~3 to 5oC, though some individual sites may have been even warmer.  Models have determined that much, if not all this warming can be explained by increased insolation from orbital forcing as the Earth travels around the Sun, shifts its axial tilt and changes the amount of eccentricity in its orbit in regular cycles; effectively acting like a long-term climate pacemaker.  In itself, this additional warming from the Sun is too small and too regional to fully explain all the observed warming during the period.  It's likely that lowered albedo, increasing CO2 and other carbon feedbacks have amplified this warming from the orbital pacemaker.

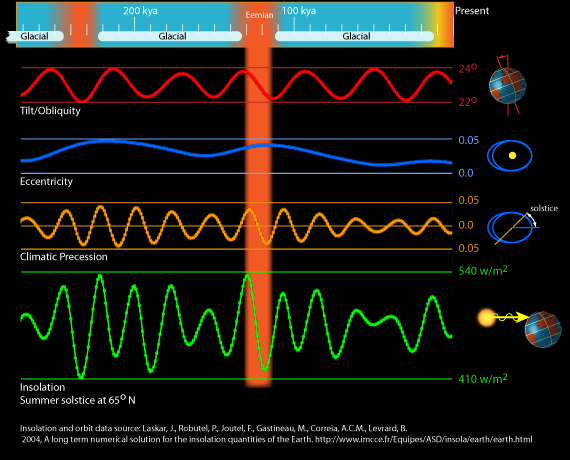
Figure 1 - LIG Orbital Parameters 

Figure 1: The precession, obliquity and eccentricity components of Earth's orbit around the Sun, plus the resulting changes in insolation at 65oN for the past 250,000 years. (illustration: jg at brightstarswildomar)

For the first half of the Last Interglacial (~130 to 123 Ka) orbital forcing produced a large increase in summer Northern Hemisphere insolation (IPCC AR4). The orbital eccentricity was higher, giving a more elliptical orbit.  The effects of precession, a wobbling of Earth's axis of rotation,  on insolation was also more pronounced.  These warm conditions   lasted around 11,000 years (Muller, 2009)  and summer insolation at 65oN was at a maximum at 126 ka (Berger 1978, as described in Born et al., 2009).  Modelling studies using Last Interglacial orbital parameters determined that precession was the main contributor to climatic change during the period.  Kaspar et al (2005) compared temperature proxy reconstructions with results from an Atmosphere-Ocean General Circulation Model utilizing  greenhouse gas concentrations and orbital parameters to simulate climate at ~125 ka.  The model results were consistent with the temperature proxy reconstructions and indicated that the differences in orbital parameters compared to today were sufficient to explain the higher temperatures over most parts of Europe in summer.  They argue that greater axial tilt and eccentricity of orbit, together with perihelion, Earth's closest approach to the Sun, happening during summer in the Northern Hemisphere, amplified seasonal insolation at 125 ka.  However, Muhs et al. (2002), from  a study of past sea-levels using Hawaiian coral dating found a much longer Last Interglacial period from ~136 to 115 ka., they argue that this indicates that orbital forcing could not be solely responsible for maintaining warm temperatures throughout the period.

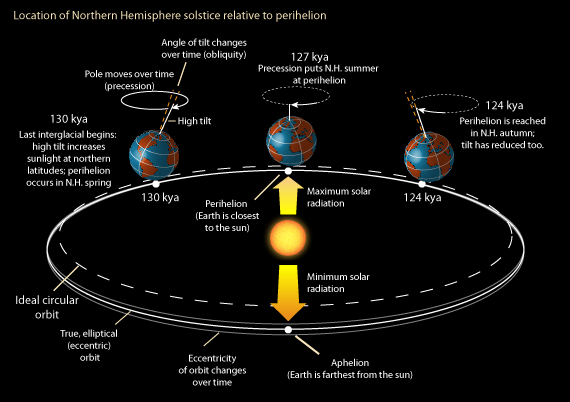
Figure 2 - Orbital Configuration and Insolation

Figure 2: Earth's orbital configuration during the Last Interglacial at 130 ka, 127 ka, 124 ka. (Illustration: jg at brightstarswildomar)

A variety of temperature proxy reconstructions suggest mean annual temperatures up to 4oC higher than today in northern Europe, northern latitudes of North America, and northern Asia.  The mean annual temperature rose up to 2oC higher in central Europe and the mid-latitudes of North America and Asia.  In lower latitudes the mean annual temperature was similar to the present day.  This means that the temperature gradient between northern latitudes and the equator would have been lower during the climatic optimum of the Last Interglacial, possibly due to variations in the angle of tilt of the Earth's axis.  During the early part of the Last Interglacial (~130 to 126 ka), this axial tilt was higher, which provided stronger insolation at high latitudes and weaker insolation at low latitudes.  Another difference is that perihelion occurs during Northern Hemisphere winter today, but during Northern Hemisphere summer in the early part of the Last Interglacial (Muller, 2009).

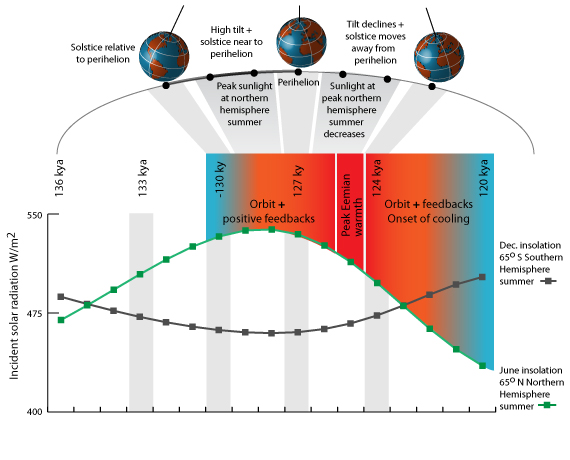
Figure 3: Orbital forcing in context ?

 Figure 3: Last Interglacial orbital focing in context (Illustration by jg at brightstarswildomar)

At 130 to 127 ka, the mean temperature of the warmest month in the East Siberian Arctic was estimated to be 4 to 5oC higher than present, mainly due to insolation being 13% higher than today.  This high mean temperature in the Arctic cannot be explained solely by increased insolation, but may have been affected by feedback effects from lower albedo due to reforestation and reduced sea-ice cover (Kienast et al., 2007).

Reconstructed atmospheric CO2 levels for the first 7,400 years of the Eemian were derived from stomatal index data obtained from tree leaves in a lake sediment section from Hollerup in Denmark.  Stomata  play a role in plant respiration and their density can provide an estimate of atmospheric CO2Rundgren et al. (2004) found that CO2 varied between 250 to 290 ppmv, with the remainder of the record more stable around 290 to 300 ppmv, which can be compared to the atmospheric CO2 at the preceding  glacial maximum of ~190 ppmv (Broecker 1998) and more than 390 ppmv today. 
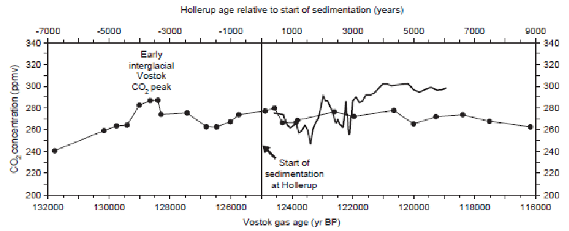
Last Interglacial CO2 Reconstruction 

Figure 4: Tentative matching of Vostok CO2 record and stomatal index derived CO2 record from Hollerup, Denmark (Rundgren et al, 2002)

The most important terrestrial controls of climate relate to albedo effects and changes in land surface, which determine the reflectivity of the Earth and how much energy from the Sun can be absorbed.  For example, reduction in ice-sheet extent can expose lower albedo soil, rock and vegetation, which enhances surface warming.  There was less glacial ice on Earth during the Last Interglacial compared to the present day, which suggests a significant reduction in the size of the Greenland and Antarctic Ice Sheets (IPCC AR4). This would support the view that an increase in land area exhibiting a lower albedo might have played some part in increased warming during the Last Interglacial.

Schurgers et al. (2007) performed computer simulations of Eemian climate to determine the effect of land surface changes.  They found that the main influence on climate was related to changes in the albedo.  In the Northern Hemisphere high-latitudes this was partially due to the albedo effect of the conversion of grasses to forest, with the indirect effect of forests on snow albedo being the major factor affecting absorption of total solar irradiation.  Large changes in surface albedo occurred in the western Sahara due to the appearance of vegetation between 128 and 120 ky.

Research by CAPE-Last Interglacial Project Members (2006), suggests the 4 to 5oC warming in the Arctic was the result of positive feedbacks from the intensification of the North Atlantic Drift bringing warm water from the Gulf Stream poleward and albedo efects from the reduction in sea-ice extent and the expansion of forests into Arctic regions.  These factors all enhanced the summer insolation forcing.  Greater coverage of vegetation during the summer potentially led to further warming through feedback effects of enhanced evapotranspiration and lower albedo (Klotz et al., 2003).

Today, we are observing a reduction in sea-ice and ice-sheet volume as a result of a warming climate, especially in the Arctic.  This ice melt and thermal expansion of seawater is creating an observable increase in global sea-level.  How did the warming of the Last Interglacial climate affect ice melt and sea-level rise?  We'll answer this question in Part 3 of this series on the Last Interglacial Climate....

0 0

Printable Version  |  Link to this page

Comments

Comments 1 to 18:

  1. I am going to disagree that the difference in insolation was not sufficient to cause the warmer Eemian Interglacial. We agree at the 14% higher summer insolation that took place 126,000 YBP. You state that TSI is not sufficient to account for the warming, but that ignores the geographical bias that currently exists for the temperature of the Earth based on where the peak energy intersects the Earth's surface. Under the current orbital parameters the peak energy takes place on January 5th. The minimum energy is taking place right around today (July 5th). The difference is about 6% in total TSI between those two points. So in about a month the Earth should be at it's coldest point of the year if TSI was the determining factor. It should be noted that today is the coldest day on the Moon because TSI is the main factor there. The Moon will be about 6K warmer on January 5th when it is closest to the Earth. So TSI only would dictate that the Earth behave in the same manner, but the Earth's temperature cycle is independent of TSI and is dependent on the season of the NH. When the NH is in summer, the Earth is the warmest. When the NH is in winter the Earth is the coldest. TSI does not dictate when the Earth is warmest or coldest, only the season of the NH. The 65N simply acts to amplify the effects of the natural temperature cycle that the Earth currently displays. That 14% higher summer insolation would have caused the summer time temperatures to be MUCH higher than the NH experiences today. Jones Annual Temperature Dr. Jones is the one that described the annual temperature swing of the Earth and it is strictly seasonally based and not TSI based. The Milankovitch cycle really just amplifies the natural cycle that exists each year by either increasing the decreasing the amplitude of the yearly cycle. The peak summer energy 126,000 years ago is more than sufficient to fully explain the much warmer temperatures at the time.
    0 0
  2. I'm afraid that orbital forcing cannot be used as an explanation in isolation for the warming of the Last Interglacial. Feedback effects from vegetation and albedo change as well as GHG composition of the atmosphere will make a contribution. If you read the Crucifix & Loutre paper that I link to, they find from modelling studies that albedo feedback from vegetation changes quadruple the direct effect of the orbital forcing.
    0 0
  3. TIS, I have some quibbles: a) "When the NH is in summer, the Earth is the warmest." By what measure, total heat content or atmospheric temperature? Oceans have a higher heat capacity than common rocks; it takes more Joules to heat them by mass. The same amount of energy received over the ocean would show less temperature change than it would over land. Plus, oceans tend to circulate more than rock. So, it makes a difference. b) "TSI does not dictate when the Earth is warmest or coldest, only the season of the NH." It would be news to me that a greater or lesser amount of energy coming in has no effect on the energy content (and temperature) of a body. If it is "only the season of the NH", then it is nothing else. c) I think you are arguing against TSI having an effect over many years by showing that it doesn't have much effect within a year. That doesn't make a great deal of sense.
    0 0
  4. Steve and Chris, Since the answers are related I will address you both. Chris misses the point that the Earth's overall temperature is in phase with the seasons and not in phase with the TSI. That makes the Earth's temperature dependent on the seasons and not the TSI. If the Earth's temperature was in phase with the TSI the warmest temperature would ALWAYS take place within a month of the perihelion. That is not the case. The standard measure of the Earth's temperature is the atmosphere. Chris takes issue the the Southern Ocean and comments on heat capacity, but that high heat capacity simply prevents as much change in temperature. Therefore the Earth is coolest when the SH is in summer even though the Earth as a whole gets the most energy. The data on the Earth being warmest is from the CRU. Hardly a skeptical bastion. That leads back to Steve. If you look at the temperature spike of the Eemian it ramps up to the peak temperature ~128,000 years ago and then dropped as insolation peaked. The main vegetation peak could not have happened that quickly. The forests of the Eemian dwarf those of today. They could not have filled the void that quickly. Far more likely from the reconstructed temperature data is that the vegetation filled in and caused the temperature drop that happened ~126,000 years ago. The question is does the positive (albedo) or the negative (evapotranspiration) dominate. Here is your conundrum. You require a far more complex theory to explain what is simply explained by insolation. 14% extra summer energy is significant in the NH. If insolation is the correct answer, that causes significant problems for your current theory of global warming. Hence you must find an alternate solution and must discard the simple and most probable conclusion. You disregard the current climate data (NH summer causes warmer Earth by 4C) in favor of the far more complex and unprovable solution. The solution is readily available. The Holocene experienced ~10C temperature change with a 50 W/m2 change in 65N insolation. The Eemian experienced a 71 W/m2 change which is ~14C change in temperature. That would also be how much the temperature warmed up in the early Eemian according to the EPICA data. Northern Hemisphere Climate Sensitivity
    0 0
  5. #4 - Your hypothesis will only work if you can provide a case that falsifies our knowledge of the radiative cross-section of CO2, Methane etc, as well as fundamental physical properties such as the specific heat of water and Planck's Law. If Earth's temperature is dependent on the seasons, why are winters warming faster than summers? Also, the standard measure of the Earth's temperature is not just the atmosphere, but the total heat content anomaly of the oceans and atmosphere. How we know global warming is still happening - Part 1 How we know global warming is still happening - Part 2 The human fingerprint in the seasons
    0 0
  6. Steve, I am aware of the situation with CO2. You are trying to get off topic. The topic is about the high temperatures of the Eemian and the high 65N insolation. Since you bring up CO2. I will clarify to other readers the situation and why the Eemian is so bad for the theory of global warming. The Eemian was 5C warmer than the Earth currently is with a max CO2 level of 285 ppm and it was really 270-280 for most of the time. But it had a temperature that the theory of global warming associates with almost 2 full doublings of CO2. So lets say the CO2 level for that temperature is 1150 ppm. The Holocene had basically identical pre-industrial CO2 levels, but a temperature that was 5C lower than the Eemian. So the purpose of the above article is to try to explain how the Earth was much, much warmer with CO2 levels that are lower than they are today. The reasonable and simple explanation is that 14% higher solar insolation is the cause. The problem is that the theory of global warming has discounted 65N insolation as being capable of causing the glacial/interglacial cycle. I am glad that you recognize the importance of this Steve. Many would not fully comprehend the significance of the very warm Eemian. I am pretty sure that this website very often uses the CRU temperature as an indication of warming. Even one of the articles that you linked to uses the CRU as 'evidence.' There are other methods, but throwing up a CRU temperature plot is very common and hence would be a standard measure of the Earth's temperature. You still have not discussed the issues I brought up in #4 about the high degree of correlation between insolation and temperature between the Holocene and Eemian. Which I point out might indicate that insolation plays a larger role than you are willing to allowing.
    0 0
  7. The global average temperature during the Last Interglacial was likely no higher than 1C. The figure of 5C of warming only applied to high northern latitudes due to the relatively high insolation. This is discussed in part 1 of the series. There is evidence for around 2m of sea-level rise contributed by the melting of the West Antarctic Ice Shelf. It's unlikely that the WAIS would have melted only because of higher insolation at 65N. I totally agree with you that orbital forcing and insolation has been the main driver behind the recent glacial/interglacial cycles, but it's not sound science to exclude all of the feedbacks and processes that would have amplified and distributed the warming around the globe. Reduced albedo, heat uptake by the sea and ocean currents played their part. The orbital forcing behind the last glacial termination peaked with the Holocene Climatic Optimum. For the past few thousand years our orbital configuration has been moving into a cooling phase, yet global temperatures are on the increase.
    0 0
  8. General note: sentient in the previous post “talked” about the MIS 11. It is worth noting that most researchers believe that: “MIS 11 can be considered an analogue for future natural climate changes.” ( Loutre, 2003.) Not Eemian. Rohling et al., 2010.: “MIS-11 is often considered as a potential analogue for future climate development because of relatively similar orbital climate forcing ...” “However [even the here], there is an obvious difference in that the current interglacial (Holocene) spans a single insolation maximum (summer, 65°N), while MIS-11 spanned two (weak) astronomical precessiondriven insolation maxima separated by a minor minimum (due to coincidence of a minimum in 400-ky orbital eccentricity with a maximum in the Earth's axial tilt ...” “In itself, this additional warming from the Sun is too small and too regional to fully explain all the observed warming during the period. It's likely that lowered albedo, increasing CO2 and other carbon feedbacks have amplified this warming from the orbital pacemaker.” Effect of CO2 can explain temperature changes during interglacials, but it is a relationship far more complicated than we think. “It is only when insolation and CO2 act together towards a cooling, i.e. they both decrease together, that the climate enters quickly into glaciation and that the interglacial may be short. Otherwise each forcing alone is not able to drive the system into glaciation and the climate remains in an interglacial state. The same situation applies for the future. However, we already know that CO2 and insolation do not play together. (Loutre, 2003.). By Rohling et al., 2010. “more controversial” is the possibility “variability in the planetary energy balance during Pleistocene glacial cycles was dominated by greenhouse gas and albedo related feedback mechanisms, and that the role of insolation was limited to only triggering the feedback responses (Hansen et al., 2008).” Why "more controversial" - could it be for the reasons referred here ( Schwartz et al., 2010 )? Is worth to draw attention - Rundgren et al., 2005. - on Figure 4 - "raw" data. Together with a possible range of deviations - fluctuations of CO2 are possible (and in a relatively short time) between 160 and 350 ppmv CO2. Changes in the Eemian p.CO2 may thus be significantly underestimated. Only by adopting this latest conclusion, We can answer the question of the Eemian - Why was it so warm? just like Hansen: “... greenhouse gas and albedo related feedback mechanisms ...”
    0 0
  9. Interesting facts to prove what is written in a post 1. The Inconvenient Skeptic; I found here: Evolution of the seasonal temperature cycle in a transient Holocene simulation: orbital forcing and sea-ice, Fischer and Jungclaus, 2011.
    0 0
  10. #9 - The paper you link to just provides further confirmation that some regions had continental climates during the Eemian due to the orbital configuration and Arctic sea-ice / albedo feedback. I touched on this in Part 1 of the series. I'm afraid it doesn't provide any support for #1.
    0 0
  11. TIS, You are failing to make the proper connections between energy (TSI is measured in energy) and the temperature of matter. There is not a uniform relationship between energy and temperature; different forms of matter require different amounts of energy to achieve the same change in temperature. There most certainly is a relationship between energy and temperature, but you are treating all matter the same and it is not. It takes more energy to cause the areas covered by water to change 1 K than it does to change the areas were land is exposed. What you keep pointing out with the yearly temperature plot is that there is more land area in the NH than there is in the SH. Yeah, so? You are saying that because oceans have a have a higher heat capacity, variations in TSI have no effect. I'm saying that graph you have linked includes effects of both higher heat capacity and TSI, (plus others as well) and clearly the differences in heat capacity dominate, but that does not mean the TSI has no effect. It isn't a 'one thing or the other' situation, and you are saying that it is. Maybe the reason that the NH curve goes 7 K above the mean in the summer, but only 6 K below the mean in the winter is partly to do with the earth receiving more TSI in the NH winter.
    0 0
  12. Hmm, that is not the only thing going on. The earth will spend more time near aphelion than near perihelion. So, the delta from the mean for both hemispheres will be greater on the aphelion side. Ah, so, not only will the hemisphere with the lower heat capacity (NH) show a greater variation than the other in general, but under current orbital parameters, that same hemisphere will spend more time in the greater W/m^2 orientation than the other. It is not at all surprising that the temperature graph looks the way it does, but that still does not mean that TSI has no effect.
    0 0
  13. Darnit, every time I think I get it, something else comes up. I'm looking at obliquity, eccentricity, precession. When those things conspire you see a maximum in the resulting total insolation at 65 N, and this and feedbacks yields the last interglacial. Right. Problematically, the previous interglacial before that (at about 240 years bp), occurs during a time when the orbital parameters combine to yield a minimum insolation at 65 N.
    0 0
  14. #13 - The insolation peak at 65N during the Last Interglacial occurred at around the termination from the previous glaciation. By the time that the warmest period occured (Eemian Climatic Optimum), the insolation was heading towards a minumim. A good analogy is that the warmest month in the NH is August, which is a couple of months after the Summer Solstice when insolation peaks at high northern latitudes. The climate system has the same inertia.
    0 0
  15. Okay, I can buy that. And applied to the interglacial before that, it makes some sense -- the interglacial begins after a peak in 65N insolation (but well after the obliquity peak, so the peak isn't as strong as the one that initiated the Eemian). The interglacial occurs despite a minimum in 65N insolation that shortly follows about 235 kya. So, let's say that (due to 'inertia') the minimum at 235 kya brings on the next glacial period (initiated about 222 kya). The question is, Why doesn't the maximum 65N insolation at about 220 kya initiate another interglacial sometime shortly thereafter? I suspect the answer is feedbacks, but I would like to be sure I understand it.
    0 0
  16. How warm was it? Paleoclimate Implications for Human-Made Climate Change:
    Paleoclimate data help us assess climate sensitivity and potential human-made climate effects. We conclude that Earth in the warmest interglacial periods of the past million years was less than 1{\deg}C warmer than in the Holocene. Polar warmth in these interglacials and in the Pliocene does not imply that a substantial cushion remains between today's climate and dangerous warming, but rather that Earth is poised to experience strong amplifying polar feedbacks in response to moderate global warming. Thus goals to limit human-made warming to 2{\deg}C are not sufficient - they are prescriptions for disaster. Ice sheet disintegration is nonlinear, spurred by amplifying feedbacks. We suggest that ice sheet mass loss, if warming continues unabated, will be characterized better by a doubling time for mass loss rate than by a linear trend. Satellite gravity data, though too brief to be conclusive, are consistent with a doubling time of 10 years or less, implying the possibility of multi-meter sea level rise this century. Observed accelerating ice sheet mass loss supports our conclusion that Earth's temperature now exceeds the mean Holocene value. Rapid reduction of fossil fuel emissions is required for humanity to succeed in preserving a planet resembling the one on which civilization developed.
    0 0
  17. What was the previous interglacial globally average incident solar radiation?
    0 0
  18. Steve #15 - You've raised a very interesting question, which I can't answer. It would make a very good topic for a future post, which I'll look into.
    0 0

You need to be logged in to post a comment. Login via the left margin or if you're new, register here.


The Consensus Project Website

THE ESCALATOR

(free to republish)


© Copyright 2024 John Cook
Home | Translations | About Us | Privacy | Contact Us