The Last Interglacial Part Three - Melting Ice and Rising Seas
Posted on 10 August 2011 by Steve Brown, jg
NOTE: This is the third article of a five-part series on what we can learn from the Last Interglacial time period. Understanding this period may provide clues on how the environment may respond to similar conditions in the future. In the first post, we described the conditions that exisited during the Last Interglacial. In the second post, we looked at the key factors for making it a warm period. In this post, we examine two of the most profound environmental impacts that resulted from the warm climate.
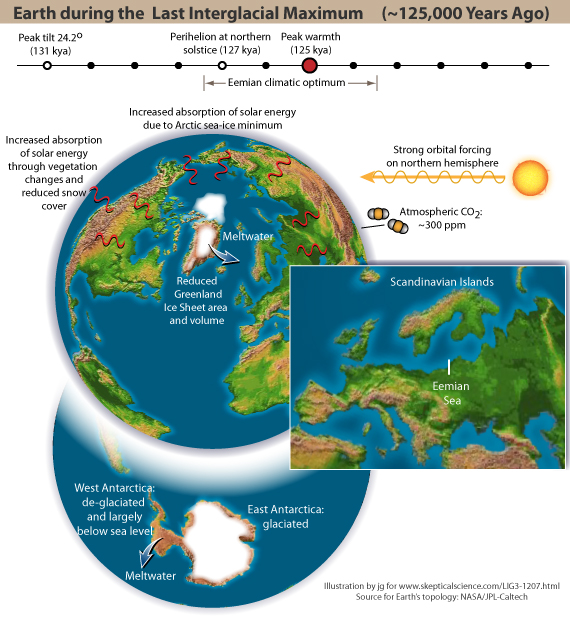
In the previous posts we learned that the Last Interglacial, also known as the Eemian in Europe, was significantly warmer than today in large regions of the Northern Hemisphere, and may have been around 1oC warmer globally. The main reason for this warmer climate was an increased amount of energy from the Sun being received at high northern latitudes due to Earth's orbital configuration, plus Earth had an increased capacity to absorb heat due to vegetation changes and reduced ice and snow cover. The period is also known for global sea level being several metres higher than today. So how high did sea levels get and why?
Contrary to what common sense might tell you, global sea-level is not the same everywhere and can vary by many metres from region to region. Seawater can bulge up in regions under local gravitational influence due to proximity of land masses, undersea mountains, or even due to changes in atmospheric pressure. Physical properties of the sea water such as temperature and salinity will affect its density and hence the volume it occupies. Sea level also depends on the actual amount of water in the oceans, which can be altered significantly during the course of glacial/interglacial cycles depending on the mass of water locked up in glaciers and ice-sheets.
The IPCC AR4 report describes evidence from a variety of sources that suggests either a partial or a complete disappearance of the Greenland Ice Sheet during the Last Interglacial, providing a contribution of 2 to 4 m of sea-level rise. This was likely over a period of several thousand years in conjunction with an Arctic summer warming of up to +5oC. There is uncertainty in the interpretation of Greenland ice core records, though it does seem likely that the Greenland Ice Sheet lost at least half of its volume and the top of the ice sheet in the Summit region may have been 500 m lower than the present day. Otto-Bliesner et al. (2006) simulated the behaviour of the Greenland Ice Sheet in response to the known climate forcings of the Last Interglacial. They found ice melt configurations consistent with palaeo-records of the Greenland environment, which suggest a sea-level rise contribution of 2.2 m to 3.4 m (Figure 1). The Greenland Ice Sheet melt is very sensitive to warm summers, which is what resulted from the particular orbital forcing configuration of the Last Interglacial.

Figure 1: Simulated Greenland Ice Sheet thickness maps. Configuration A gives a minimum sea-level contribution of 2.2 m. Configuration B gives a maximum sea-level rise of 3.4 m likely contributed by the Arctic. (Otto-Bliesner et al. 2006)
It's likely that summer sea-ice persisted in the Arctic Sea, though remains of plankton obtained from sediments on the Lomonosov Ridge suggest that there were extensive areas of open sea for periods of the Last Interglacial (CAPE-Last Interglacial Project Members, 2006). Other proxy records, mainly derived from marine sediment cores, suggest that there were warmer than normal seas in many parts of the oceans that contributed to the melting of Arctic sea-ice. Though melting sea-ice does not directly affect sea levels, it does result in more of the Sun's energy being absorbed by the oceans as there is no longer any reflective ice.
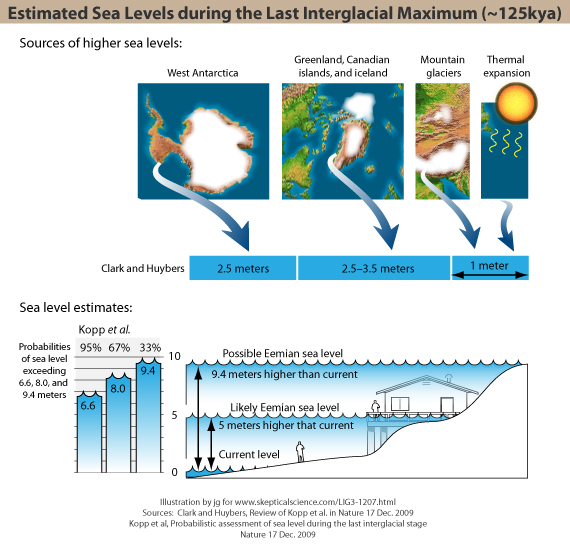
It's long been understood that global sea level reached over 5 metres above that of the present day, however some research published over the past decade has indicated that sea-level may have peaked at over 9 metres before the end of the Last Interglacial. Because the Greenland Ice Sheet melt is thought to have contributed to no more than 4 m of sea-level rise, it may imply a contribution from melting of the Antarctic Ice Sheet to account for the additional sea-level rise.
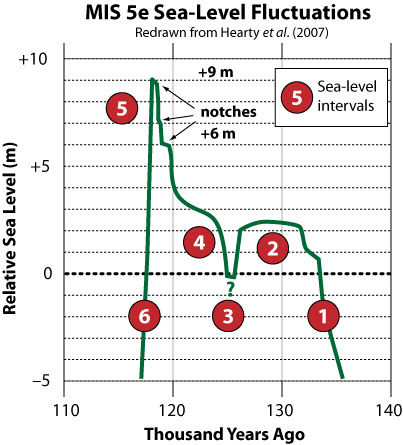
Coral reefs can provide a highly accurate measure of past sea-levels, as coral grows close to the surface where there is plenty of light and will always grow upwards with rising sea level. When sea-level reaches a maximum, erosional processes at the shoreline will leave tell tale marks that can be used to identify these maximum sea-levels. Coral can also be dated accurately using isotopic analysis, which means that the dates of sea-level maxima and minima can be derived with some precision. Figure 2 shows a reconstruction of a series of Sea-Level Intervals (SLI's) by Hearty et al. (2007), using geological and coral reef analysis from 15 sites worldwide. The brief regression at 125 ka [fig 2: SLI 3] seems to have reversed within 1000 years implying a decrease in polar ice possibly from the Greenland Ice Sheet. The rapid sea-level rise that then ocurred from 121 to 119 ka suggests to the authors a rapid collapse of the Greenland and West Antarctic Ice Sheets. They suggest that the associated rapid release of meltwater would have significantly altered the thermohaline circulation leading to enhanced temperature gradients between cool temperate latitudes and the hot tropics, which potentially led to intensified weather systems and increased storminess. Evidence in Barbados of intense storms, or possible local tsunami activity, is suggested by trees buried by dunes in living position and the deposition of huge boulders on top of Last Interglacial sediments (Hearty & Neumann, 2001; Hearty et al., 2007)

Figure 2: Reconstruction of Last Interglacial sea-level intervals 1 – initial postglacial rise at ~130ka, 2 - +2.5 m at 132-125 ka, 3 – brief regression at 125 ka, 4 – rise above +3 m between 124-121 ka, 5 – rises to +9 m from 121-119 ka, 6 – rapid retreat of sea-level at end of MIS 5e. (Hearty et al., 2007)
Some caution should be taken with these higher estimates of sea-level rise as assumptions have been made on the past rate of tectonic uplift at many of the sites used for sea-level palaeo-studies. Possibly the most useful assessment so far is by Kopp et al. (2009), who analysed a catalogue of sea-level indicators for the Last Interglacial and provided a statistical estimate that there is a 95% probability that global sea-level reached at least +6.6 m, and a 67% probability that sea-level was at least +8.0 m, but only a 33% probablity that it exceeded 9.4 m compared to the present.

Figure 3: Estimated sea levels during the Last Interglacial
Colville et al. (2011) analysed the sediment in cores retrieved from the Ocean bed that was transported to the sea from Greenland by glacial processes. They were able to isotopically identify the specific regions of Greenland that the sediment came from and hence were able to estimate the extent of the Greenland Ice Sheet during the Last Interglacial. Surprisingly, they find that much less of the Greenland Ice Sheet melted compared to earlier estimates and that the contribution to sea-level rise was no more than 2.2 m. This leads to the conclusion that the contribution from Antarctic ice-melt was much higher than previously thought. Another very recent paper by McKay et al. (2011) that was highlighted in a recent SkS post comes to a similar conclusion. This time, though, from a study that finds that the contribution to sea-level rise from the thermal expansion of seawater was much lower than previous research due to a lower estimate of sea temperature during the Last Interglacial, with an increased contribution from Antarctica to make up the balance. This raises the spectre of Antarctica being far more sensitive to melting than we thought.

Figure 4: An impression of how Earth might have looked during the Last Interglacial
Ocean circulation is pivotal in its role for transfering heat around the globe, as well as being a significant factor in regional climate and weather patterns. Did the large volume of cold freshwater that returned to the ocean from the melting ice sheets affect this circulation and influence changes to climate and weather patterns? We'll answer this question in Part 4 of this series on the Last Interglacial......


 Arguments


 0
0  0
0 Do the more recent data show more topography than this older satellite?


Comments