Climate Science Glossary

Term Lookup

Enter a term in the search box to find its definition.

Settings

Use the controls in the far right panel to increase or decrease the number of terms automatically displayed (or to completely turn that feature off).

Term Lookup

Settings


All IPCC definitions taken from Climate Change 2007: The Physical Science Basis. Working Group I Contribution to the Fourth Assessment Report of the Intergovernmental Panel on Climate Change, Annex I, Glossary, pp. 941-954. Cambridge University Press.

Home Arguments Software Resources Comments The Consensus Project Translations About Support

Bluesky Facebook LinkedIn Mastodon MeWe

Twitter YouTube RSS Posts RSS Comments Email Subscribe


Climate's changed before
It's the sun
It's not bad
There is no consensus
It's cooling
Models are unreliable
Temp record is unreliable
Animals and plants can adapt
It hasn't warmed since 1998
Antarctica is gaining ice
View All Arguments...


Username
Password
New? Register here
Forgot your password?

Latest Posts

Archives

Monckton Myth #4: Climate Sensitivity

Posted on 19 January 2011 by John Cook

Climate sensitivity is a measure of the change in global temperature if atmospheric CO2 was doubled. If there were no climate feedbacks, warming from doubled CO2 would be around 1°C. There are many lines of evidence that indicate climate sensitivity is around 3°C. In other words, feedbacks amplify the initial warming from rising CO2. However, Christopher Monckton disputes this. In Monckton's response to Steketee's article, he claims:

"Most climate scientists have not studied the question of how much warming a given increase in CO2 concentration will cause: therefore, whatever opinion they may have is not much more valuable than that of a layman. Most of the few dozen scientists worldwide whom Prof. Richard Lindzen of MIT estimates have actually studied climate sensitivity to the point of publication in a learned journal have reached their results not by measurement and observation but by mere modeling. The models predict warming in the range mentioned by Mr. Steketee, but at numerous crucial points the models are known to reflect the climate inaccurately."

Monckton's conceit (here and in numerous other presentations) is that estimates of high climate sensitivity come from models, while an estimate of low climate sensitivity, courtesy of Richard Lindzen, comes from measurements and observations. This is a false portrayal of the state of the science. There are many determinations of climate sensitivity based on measurements and observations. In fact, several studies use more complete satellite observations than those used by Lindzen and find high climate sensitivity.

To calculate climate sensitivity, Lindzen looks at sea surface temperature in the tropics along with satellite measurements of outgoing radiation (Lindzen et al 2009).  The change in outward radiation tells us how climate responds to changing temperature. Their analysis found that when it gets warmer, more outgoing radiation escapes to space which has a cooling effect. Lindzen concluded that negative feedbacks actually suppress surface warming and our planet has a low climate sensitivity of about 0.5°C.

However, a number of peer-reviewed papers have exposed fatal flaws in Lindzen's methods. His result of low climate sensitivity is heavily dependent on the choice of end points in the periods he analyses - slight changing of these end points gives widely varying results including positive feedback (Trenberth et al 2010).

In addition, what Lindzen is trying to do is calculate global climate sensitivity from tropical data. The tropics are not a closed system - a great deal of energy is exchanged between the tropics and subtropics. To properly calculate global climate sensitivity, global observations are required. Several studies have performed the same analysis using near-global data. One study found that small changes in the heat transport between the tropics and subtropics can swamp the tropical signal. They conclude that climate sensitivity must be calculated from global data (Murphy 2010).

Another study reproduced Lindzen's analysis and compared it to results using near-global data (Chung et al 2010). The near-global data find high climate sensitivity and the authors conclude that the tropical ocean is not an adequate region for determining global climate sensitivity. So Monckton's characterisation that measurements find low climate sensitivity does not give you the full picture. In actuality, Lindzen's data covers only part of the globe and more complete observations find high climate sensitivity.

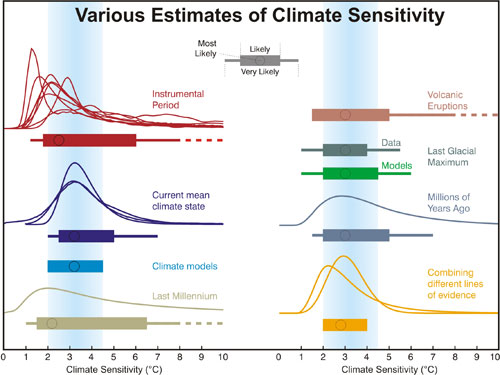
There is another important reason why we can be confident that negative feedbacks aren't our get-out-of-jail-free card to rescue us from global warming. Measurements of past climate change have not found negative feedback suppressing climate change. On the contrary, what we find in the Earth's past is dramatic climate change - positive feedbacks amplifying changes in temperature. A multitude of papers looking at different periods in Earth's history independently and empirically converge on a consistent answer - climate sensitivity is around 3°C implying net positive feedback.
Various estimates of climate sensitivity

Figure 1: Various estimates of climate sensitivity (Knutti and Hegerl 2008).

Monckton's depiction that high climate sensitivity is based on models rather than observation is false. A number of lines of evidence all paint a consistent picture - positive feedbacks will amplify the warming caused by greenhouse gas emissions.

0 0

Printable Version  |  Link to this page

Comments

Comments 1 to 39:

  1. According to direct observation of tropical clouds, by the CERES satellite, the Iris effect has a net *positive* effect on the energy balance of the tropics. i.e., though it does release a *small* amount of thermal energy, it lets in *more* energy from the sun. So there is a definite, fatal flaw right there. At least, that is how I read it.
    0 0
  2. Yes - it is one of those bizarre pieces of denier logic to simultaneously believe that (a) clouds will roll in to save us all and (b) there is nothing to worry about because the current climate change is less than the great changes of the past, without understanding that those two propositions are totally contradictory.
    0 0
  3. The deniers believe that clouds refection energy to space and the more clouds=more energy going to space. Marcus the research from Ceres satellites shows that not to be so...
    0 0
  4. Ah yes but the Iris Effect, specifically, is about a reduction of the cloud canopy in the tropics which-in turn-was supposed to have a net *negative* forcing effect-by releasing heat out to space. What Ceres showed was that (a) the amount of heat released had been overstated & (b) it was outdone by the amount of radiation being let in (which, of course, means more heat trying to get out)-thus Ceres shows the Iris effect will *not* protect us from increased warming-because it's a net *positive* forcing. Hence Lindzen has made a fatal error!
    0 0
  5. Original Post Poor Monckton - he just gets everything wrong doesn't he? Four Myths - four topics - and he is wrong wrong wrong each time. For AGW climateers with a statistical bent - could you calculate the odds of Monckton getting it wrong four times in a row, nay - make it five times in a row for I am sure that there will be a fifth Myth from the pen of John Cook tomorrow. Surely on pure chance - m'Lord gets something right occasionally.
    0 0
  6. Ken, This is another myth that deniers promote: that everyone should be correct half the time by chance. If you supoport a position that is incorrect, like Monckton does, then you are necessarily wrong most or all of the time. What is the big mystery about that? Also, when data is carefully reviewed, it is often revised to show warming and not cooling. That is because warming is what is happening. You would not expect the data to indicate cooling half the time because cooling is not happening. Deniers suggest that scientists are biased because the data always supports AGW. A better explaination is that AGW is what is occuring so that is what the data shows.
    0 0
  7. For once I agree with you KL - Monckton does tend to get everything wrong. Sadly he holds so many contradictory positions in his head it is staggering that it does not explode! For example - 'it's not warming' (scientists fidge the data), but the warming we see (observed by scientists) 'is natural anyway'... 'The MWP was warmer than present', yet somehow, 'climate sensitivity is low'... the list goes on. Monckton desperately pushes every single meme that is contrary to what the science says, which means of course by definition, his lordship is wrong pretty much every time, and tends to contradict not only the science but regularly himself.
    0 0
  8. Seeing that Lindzen's work has been shown to be fatally flawed, has he retracted it? If he hasn't, is there an obligation within the etiquette of the science community that he does so? If there isn't an obligation, is there any way of devising one? Until then, I rather suspect that his Lordship will continue peddling his sceptical wares despite the hard work of sites like this. In truth he would probably continue even if Linzen's work were retracted, but he would be very susceptible being exposed from his audience, and thus having all of his presentation called into question. P.S. BBC 2 has an Horizon Programme on raising the public profile of science next Monday evening (U.K. time). The trailer specifically mentions Climate Change, so it might be worth looking at for clues as to how we can raise the profile of the topic and thus lower the profile of the Moncktons of this world.
    0 0
  9. PPS, the BBC has something called 'iPlayer' which I believe lets one access BBC programmes from anywhere. (I get BBC radio with no problem here in Poland.)
    0 0
  10. 8, funglestrumpet, Lindzen would never, ever retract his work -- and there's no reason for him to do so. Although some responsible, respectable scientists might be inclined to do so, he's not required to, and I don't think doing so is in his nature. But people who work in the field know what has been discredited (or reinforced) by subsequent papers, and proceed accordingly. In this case, Lindzen and Choi came out with another paper in May 2010 (although I'm unsure if it was ever published), "correcting" (i.e. sidestepping/obfuscating) some of the flaws. I have not yet seen an official response to that paper yet (maybe because it was never officially published).
    0 0
  11. Feedback - response to a doubling of CO2 - but this is still subject to great debate. here is the claim that the IPCC report feedbacks are too little valued ... ... and here that more than twice as overestimated.
    0 0
  12. "could you calculate the odds of Monckton getting it wrong four times in a row" (Chimpanzees, typewriters and Shakespeare come to mind). You are assuming Monckton’s errors are random. The Monckton Myths series demonstrates that his errors aren’t random at all, but are part of a deliberate effort to deceive.
    0 0
  13. Sphaerica @ 10... I can't locate where I read this but I believe the case with Lindzen and Choi's response is that, it's turned into a bit of an embarrassment on the part of the journal (GRL) that published LC09 in the first place. As such, since the responses to LC09 have been so strong the journal is unlikely to publish LC10. Also, likely this is an indicator that Lindzen's response does not adequately address the critiques. Again, I can't locate where I read this so I may have it wrong.
    0 0
  14. Ken Lambert: For AGW climateers with a statistical bent - could you calculate the odds of Monckton getting it wrong four times in a row, nay - make it five times in a row for I am sure that there will be a fifth Myth from the pen of John Cook tomorrow. I suspect that you or another "skeptic" will sneer reflexively at the next finding that reinforces the consensus on AGW. What are the odds that most of the world's climate scientists have it wrong, and that the data keep supporting them? A lot lower, I'd say, than the odds that false premises like Monckton's would lead him consistently to false conclusions. Which is a long-winded way of saying that your comment is extremely silly.
    0 0
  15. lord_sidcup: You are assuming Monckton’s errors are random. The Monckton Myths series demonstrates that his errors aren’t random at all, but are part of a deliberate effort to deceive. Lambert's comment underscores the point that even if the science were far more uncertain than it is, the average "skeptic" is not someone from whom you'd want to take lessons on logic or statistics. Even if they turned out to be right, it would be much more like a lucky guess than the result of a coherent intellectual approach to the evidence.
    0 0
  16. Arkadiusz Semczyszak #11: Feedback - response to a doubling of CO2 - but this is still subject to great debate. For those who can't be bothered to click yet another of Arkadiusz Semczyszak's bizarre links, let the record show that his first link goes to a science blogger's account of Jeffrey Kiehl's recent Science paper. The second link goes to Marc Morano's interpretation of an anonymous blogger's interpretation of Lubos Motl's interpretation of Lewis Page's interpretation of Lahouari Bounoua et al (2010). (Page's approach is deconstructed at length here.) "Subject to great debate," indeed.
    0 0
  17. KL #5 and skywatcher #7 - Monckton actually did get one point right in his response to Stekelee - his #8. It's a minor point about how much atmospheric CO2 has increased over the past few years. He also made some correct (and some incorrect) statements in his point #23, but his correct statements were based on a strawman. Since the point of this series is to correct Monckton's Myths, and point #8 is trivial, we'll probably skip that one. When I do point #23, I'll point out Monckton's correct statements. As a few other commenters have noted, the fact that Monckton makes such an incredibly high percentage of mistakes should perhaps make people question relying on him as an accurate source of climate-related information. funglestrumpet #8 - Lindzen has admitted that LC09 contains a number of errors. He has also claimed that addressing these errors doesn't change the results, which frankly is simply untrue. I don't think his correction of the errors has been published yet, as Rob #13 notes.
    0 0
  18. Rob @13, "As such, since the responses to LC09 have been so strong the journal is unlikely to publish LC10." That would be very telling Rob. Also, when Andy Dessler decimated Lindzen last year, Lindzen was whining about having fixed L&C09. IIRC, that debate was held on 11 October 2010-- yet still nothing has appeared in GRL, or will be anytime soon according to their list of papers in press. It would be nice to know what is going here. Did the journal reject his "correction", or is Lindzen still stubbornly trying to convince the reviewers and editor that he has a case?
    0 0
  19. KL, Have you volunteered to be the peanut gallery on this thread, or are you actually going to try and contribute something of substance concerning Equilibrium Climate Sensitivity (EQS)? EQS is an important issue in climate science, and an issue that Monckton got horribly wrong (and I would argue not by chance either) by electing to believe Lindzen's extremely low estimate of transient climate sensitivity (which is not the same as EQS, it is lower than EQS). Given the importance of EQS, I do not think it is something for you to be glib about.
    0 0
  20. At least Monckton is true blue by drawing upon the likes of Lindzen. I think Wally Broecker put it best when it comes to climate sensitivity. 'The Climate System Is an Angry Beast, and We Are Poking at It with Sticks' The one question we all want to know. Just how far can we push the planet before abrupt climate change takes place?
    0 0
  21. Albatross: you can determine equilibrium climate sensitivity from the feedback parameter Lindzen and Choi calculate (by combining it with the other known feedback parameters, water vapour/lapse rate/albedo). L&C09 suggest the equilibrium value is low. Their method ignores much of the planet and their choice of dates seems to have no objective justification and their results are very sensitive to this: i.e. it's not rigorous. It's almost certainly wrong. Plus they got their calculations wrong and had to boost their answer by 60% or something anyway. (although, if they are right it's still not a problem, but I'm pretty confident they've been shown to be thoroughly wrong)
    0 0
  22. I think we need to be a bit careful with some assumptions here. The IPCC admits that cloud formation and its effects are little understood. What global warming does for cloud cover, and the effect that has on heat reflection and retentions is still unknown. There are plenty of reports giving theoretical predictions in all directions, but it's still a big unknown. I know that if I'm outside on a hot day, and a cloud covers the sun, there's a big reduction in the heal energy reaching me (I feel cooler). Therefore, logic tells me that more cloud cover is more likely result in cooling. Before you start to tell be about shifts in wavelength, heating the air near the clouds etc, sometimes it's good to just look at some simple observations and simple logic - if I stand in the sun, it's hotter than when it's cloudy. It will take a lot to convince me that increased cloud cover has a net warming effect.
    0 0
  23. Come on rhj. Stand outside on a winter night when there is cloud cover, and another winter night when there's no cloud cover. How likely is frost on each of those occasions?
    0 0
  24. rhjames - it's good to just look at some simple observations and simple logic - if I stand in the sun, it's hotter than when it's cloudy. It will take a lot to convince me that increased cloud cover has a net warming effect. And if you look out the window; is the Earth flat or round?. See the problem with so-called logic?
    0 0
  25. From what I have read here there are hazardous assumptions and errors creeping in to this. Cloud cover and localized air temperature rises go hand in hand because the clouds reflect radiation emitted by the local environment back down, this is an obvious positive feedback that has been known for a very long time, however this does not operate on a global level because we do not have global cloud cover. Further, it is a fact that increased cloud cover does in fact reflect more solar radiation back into space, ask any astronomer...you increase a planet's cloud cover, you increase it's albedo because more radiation is reflected back into space. However, and this is important, increased cloud cover may reflect heat back into space, but if you have a heat source below that cloud layer, then any heat emitted by that source will be reflected back to the heat source, in this case the surface of the planet acts as both the emitter and the receiver. Monkton is wrong, but he is also right, as are you Guys and Gals. The situation is not as simple as the article above makes it sound. A good example of BOTH sides of this argument is Venus. Earth has an average Geometric Albedo of 0.386 (Bond Albedo of 0.29) Venus has an average Geometric Albedo of 0.84 (Bond Albedo of 0.75) Earth's varies quite a bit, but that of Venus is reasonably stable. Everyone knows that Venus is much hotter than Earth, even taking into account it's closer position to the Sun than Earth. Venus reflects ~80% of the radiation it receives from the sun, against Earth's ~35%, but because the dense atmosphere acts like a blanket, heat is trapped and the planet has the hottest surface temps in the Solar System. This is a clear example of where both sides of this argument area actually correct. However I accept that way Monkton presented it was clearly wrong, and was an example of very poor science.
    0 0
  26. I believe LC09 accepted they made a mistake in the simple climate sensitivity equation, so their actual estimate was 0.82 K. But still most likely wrong, because they used an open domain and seemingly randomly selected time periods (they happened ot randomly select time periods that gave lower sensitivities). As for clouds, I think the article is right. There are many observational estimates. Dessler & Lauer have observations along with their model (they just looked at more complex models than the traditional sensitivity equation LC09 used). That's looking at cloud feedbacks, like LC09 did. The Knutti & Hegerl paper shows many estimates of sensitivity from the reaction of tempereature to forcing, which is an observational estimate of the ENTIRE sensitivity, and not just individual feedback factors. Also, the only way we know of that could make a low sensitivity is clouds. And we've looked hard for a negative cloud feedback for decades and not found one.
    0 0
  27. #26 MarkR, more generally than clouds, sensitivity will be determined by the water vapor distribution http://wacmos.itc.nl/?q=node/22 WV will determine clouds which will have a large impact on sensitivity, but WV independent of clouds is just as important for determining the net radiative balance.
    0 0
  28. Eric #27 - at this point we have a pretty good idea how strong of a positive feedback water vapor will be. It's easier to measure and assess than the cloud feedback. At this point the only way climate sensitivity could be low is if there's a strong negative cloud feedback (which isn't looking very promising, based on recent studies).
    0 0
  29. Dana1981, WV is easy to measure, but very hard to predict. The prediction basically depends on the response of various phenomena to CO2 caused warming. For example it was widely predicted in GCMs that meridional circulation would decrease, backed up with observations: http://www.springerlink.com/content/p2hk155368r814l7/ Now two strongly negative AO winters have developed contrary to the model predictions and observed trend. WV is much more dispersed (uneven) in a meridional flow regime as my current below zero dewpoint is testament to. Changes in upper troposphere WV in the tropics are also unknown as convection patterns change with CO2 warming. However I should not have suggested in #27 that the WV changes are independent of cloud changes, they are heavily correlated.
    0 0
  30. Eric #29 How about we try to put some numbers on cloud and direct albedo going forward. The TSI (divided by 4)is about 340W/sq.m at TOA and total reflection (cloud and direct albedo) is quoted as about 100W/sq.m (30%) leaving about 240W/sq.m energy flux to play in the biosphere. AGW theory says that there is an average 0.9W/sq.m positive warming imbalance which means that for a net 240W/sq.m incoming, 239.1W/sq.m goes out. How accuragely do we measure the roughly 100W/sq.m ie; 30% reflected? How do we project that measurement forward to cycle models? eg; let us assume that the 30% is measures to +/-1% accuracy; therfore it could be 30.3% or 29.7%. In real terms 101W/sq.m or 99W/sq.m. This example tolerance +/-1W/sq.m is higher than the imbalance (0.9W/sq.m) postulated. Are we measuring these numbers to that accuracy and how would these vary in a higher WV or higher CO2 environment for input to climate models??
    0 0
  31. People keep referencing Lindzen 2009, but they addressed the criticisms and largely re-did the whole thing in Lindzen 2010 and the end result was pretty much the same.
    0 0
  32. Ken, considering that some models predict more positive AO http://www.cccma.ec.gc.ca/papers/jfyfe/PDF/FyfeBoerFlato1999a.pdf and some say more negative due to ice loss http://journals.ametsoc.org/doi/pdf/10.1175/1520-0442%282004%29017%3C0890%3ATARTRA%3E2.0.CO%3B2 the AO response is a prime example of a climate change paradox: http://www.agu.org/pubs/crossref/2005.../2004GL021752.shtml Natural variations in albedo are over 10% in summer in the Arctic alone https://www.cfa.harvard.edu/~wsoon/MattCronin-Mar21-07-d/WangKey03-ArcticClds+TfromAVHRR.pdf strongly correlated with AO. It is even more difficult to predict the cloud and albedo changes in the NH land masses without knowing the AO sign. I have to ask the question: what is the solution to this prediction problem? Assume the models are correct and AO will become positive? Assume it will become negative in early winter due to ice loss and add that feature to the models? Assume it varies randomly and add random variation to the models?
    0 0
  33. RW1@31 Can you give a specific reference for Lindzen 2010? The only one I could find appears to be still using AMIP models and hence does not address one of the key criticisms of Lindzen and Choi (2009).
    0 0
  34. Dikran (RE: 33), Lindzen2010
    0 0
  35. RW1@34 Yes, that is the one I found, and they use the AMIP models, so they haven't addressed the criticisms levelled at Lindzen and Choi (2009). The SSTs in the AMIP models are forced from the observations, which means that the system no longer conserves energy; hence any argument that is based on energy budget will be invalid. Lindzen argues that only the AMIP models have the same SSTs as the ERBE obeservations, but so what? The assumption of conservation of energy is broken so the argument is invalid. This error was pointed out to them. Also isn't this paper from the procedings of a symposium, and hence (a) it was lightly peer reviewed (if at all) and (b) there is no mechanism for formal comments papers like there would be for a journal paper (c) it is very recent, which means that it hasn't been scrutinised by the research community yet (a good way of telling if a paper is any good is to look at its citations, if nobody cites it, it is generally because it is either uninteresting or incorrect).
    0 0
  36. RW1 - I've read the Lindzen and Choi 2010 paper as well. While submitted to JGR, it hasn't been published, hasn't made it through peer review yet, and I don't know if it will. They are still using a simple geometric extension of their tropical data to the rest of the globe (they refer to the well debunked method of L&C 2001), whereas Trenberth 2009 notes ENSO variations move an order of magnitude more energy between tropic and subtropic regions than their calculated imbalances. And Murphy and others have shown that using global data sets even with L&C's methods show much higher climate sensitivities. Having read each version of their paper, I don't believe they have addressed even a fraction of the serious issues pointed out to them.
    0 0
  37. @Dikran: "(a good way of telling if a paper is any good is to look at its citations, if nobody cites it, it is generally because it is either uninteresting or incorrect). This advice is beginning to break down, as, due to the intense pressure to let the deniers have published papers (like letting your kid brother play ball even though he isn't coordinated enough but MOM said you had to let him play). Now we have these sub-par papers (McShane, Lindzen (according to commentary here), a recent paper that purports to show Antarctic warming at 1/2 of previous levels, etc.) and future denier papers will heavily cite these papers in order to run them up the credibility scale. It is the inevitable result of playing the "no peer reviewed papers" trump card. What is missing, quiet simply, is thet desire for honest results. The deniers are an entire industry that wants the answer to be "no warming; if warming, natural causes only" - and they will do anything to accomplish this, including perverting peer review. In fact they have already begun. In two years time deniers will be touting their "body of evidence" in peer reviewed journals. In 5 years time it will be true. Note - I use the term denier here quite intentionally. There are many skeptics who provide honest analysis of what we know we don't know (or think we know but don't). Trenberth being the Platonic ideal of a skeptic with his "travesty" comment. Even Pielke Sr. is using scientific method and the proven peer review process to establish (or see destroyed) his claims regarding ocean heat.
    0 0
  38. actually thoughtfull@37 I don't think the journals are feeling the pressure to publish papers that question AGW to the extent that bad papers are getting published because of it. Peer review is only a basic sanity check, so bad papers get published occasionally anyway. This is especially true when there is a heirarchy of journals and if your standards are low enough, your papers will get published regardless of how bad they are (the bottom end is little more than vanity publishing). However, even when they do get published, they don't generally attract many citations (other than in papers that point out the error), so looking at the citations is still a reasonable indication of whether a paper is of any value. There will undoubtedly be dodgy papers from mainstream climatologists as well, but you will be less likely to hear about them as they weren't preceded by a press release.
    0 0
  39. Re: Adelady Re RHJames, :-) I've been outside on many, many nights, summer and winter, and the effect of clouds is so readily apparent to me that I wonder about those who only talk about clouds during the day. Regarding Monckton and how often he is correct: Even a broken clock is right twice a day.
    0 0

You need to be logged in to post a comment. Login via the left margin or if you're new, register here.


The Consensus Project Website

THE ESCALATOR

(free to republish)


© Copyright 2024 John Cook
Home | Translations | About Us | Privacy | Contact Us