


 Arguments


Confusing Greenland warming vs global warming
What the science says...
This argument uses temperatures from the top of the Greenland ice sheet. This data ends in 1855, long before modern global warming began. It also reflects regional Greenland warming, not global warming.
Climate Myth...
Most of the last 10,000 years were warmer
Even if the warming were as big as the IPCC imagines, it would not be as dangerous as Mr. Brown suggests. After all, recent research suggests that some 9,100 of the past 10,500 years were warmer than the present by up to 3 Celsius degrees: yet here we all are. (Christopher Monckton)
This argument is based on the work of Don Easterbrook who relies on temperatures at the top of the Greenland ice sheet as a proxy for global temperatures. That’s a fatal flaw, before we even begin to examine the use of the ice core data. A single regional record cannot stand in for the global record — local variability will be higher than the global, plus we have evidence that Antarctic temperatures swing in the opposite direction to Arctic changes. Richard Alley discussed that in some detail at Dot Earth last year, and it’s well worth reading his comments. Easterbrook, however, is content to ignore someone who has worked in this field, and relies entirely on Greenland data to make his case.
Most of the past 10,000 [years] have been warmer than the present. Figure 4 shows temperatures from the GISP2 Greenland ice core. With the exception of a brief warm period about 8,200 years ago, the entire period from 1,500 to 10,500 years ago was significantly warmer than present.
This is Easterbrook’s Fig 4:
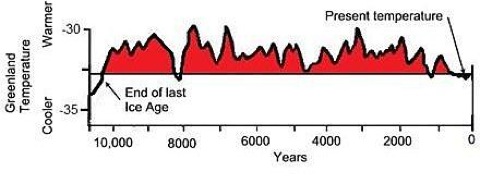
It’s a graph he’s used before, in various forms, almost certainly copied and altered from the original (click image below to see source: the NOAA web page for Richard Alley’s 2000 paper The Younger Dryas cold interval as viewed from central Greenland, though DE credits it as “Modified from Cuffy and Clow, 1997″, misspelling Kurt Cuffey’s name in the process:

Easterbrook continues:
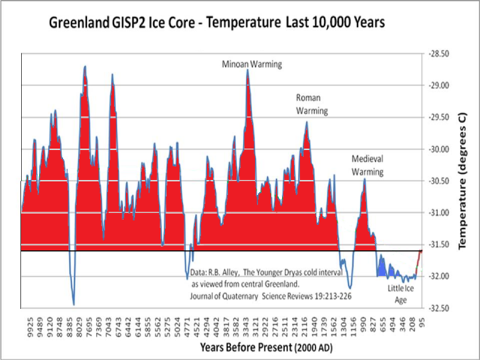
Another graph of temperatures from the Greenland ice core for the past 10,000 years is shown in Figure 5. It shows essentially the same temperatures as Cuffy and Clow (1997) but with somewhat greater detail. What both of these temperature curves show is that virtually all of the past 10,000 years has been warmer than the present.
This is his Fig 5:
Easterbrook plots the temperature data from the GISP2 core, as archived here. Easterbrook defines “present” as the year 2000. However, the GISP2 “present” follows a common paleoclimate convention and is actually 1950. The first data point in the file is at 95 years BP. This would make 95 years BP 1855 — a full 155 years ago, long before any other global temperature record shows any modern warming. In order to make absolutely sure of my dates, I emailed Richard Alley, and he confirmed that the GISP2 “present” is 1950, and that the most recent temperature in the GISP2 series is therefore 1855.
This is Easterbrook’s main sleight of hand. He wants to present a regional proxy for temperature from 155 years ago as somehow indicative of present global temperatures. The depths of his misunderstanding are made clear in a response he gave to a request from the German EIKE forum to clarify why he was representing 1905 (wrongly, in two senses) as the present. Here’s what he had to say:
The contention that the ice core only reaches 1905 is a complete lie (not unusual for AGW people). The top of the core is accurately dated by annual dust layers at 1987. There has been no significant warming from 1987 to the present, so the top of the core is representative of the present day climate in Greenland.
Unfortunately for Don, the first data point in the temperature series he’s relying on is not from the “top of the core”, it’s from layers dated to 1855. The reason is straightforward enough — it takes decades for snow to consolidate into ice.
And so to an interesting question. What has happened to temperatures at the top of Greenland ice sheet since 1855? Jason Box is one of the most prominent scientists working on Greenland and he has a recent paper reconstructing Greenland temperatures for the period 1840-2007 (Box, Jason E., Lei Yang, David H. Bromwich, Le-Sheng Bai, 2009: Greenland Ice Sheet Surface Air Temperature Variability: 1840–2007. J. Climate, 22, 4029–4049. doi: 10.1175/2009JCLI2816.1). He was kind enough to supply me with a temperature reconstruction for the GRIP drilling site — 28 km from GISP2. This is what the annual average temperature record looks like (click for bigger version):

I’ve added lines showing the average temperatures for the 1850s (blue) and the last 10 years (red), and the difference between those is a warming of 1.44ºC. I’ve also added the two most recent GISP2 temperature data points (for 1847 and 1855, red crosses). It’s obvious that the GRIP site is warmer than GISP2 (at Summit Camp). The difference is estimated to be 0.9ºC on the annual average (Box, pers comm).
Let’s have ago at reconstructing Easterbrook’s Fig 5, covering the last 10,000 years of GISP2 data. It looks like this (click for bigger version):
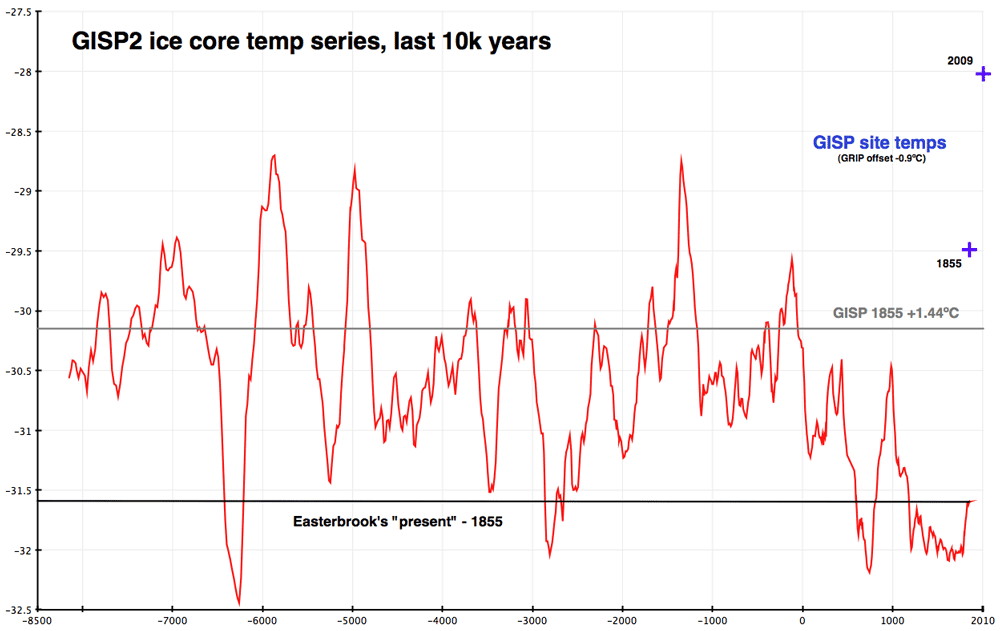
The GISP2 series — the red line — appears to be identical to Easterbrook’s version. The bottom black line shows his 1855 “present”, and it intersects the red line in the same places as his chart. I’ve added a grey line based on the +1.44ºC quantum calculated from the GRIP temperature data, and two blue crosses, which show the GISP2 site temperatures inferred from adjusted GRIP data for 1855 and 2009.
Two things are immediately apparent. If we make allowance for local warming over the last 155 years, Easterbrook’s claim that “most of the past 10,000 [years] have been warmer than the present” is not true for central Greenland, let alone the global record. It’s also clear that there is a mismatch between the temperature reconstructions and the ice core record. The two blue crosses on the chart show the GISP site temperatures (adjusted from GRIP data) for 1855 and 2009. It’s clear there is a calibration issue between the long term proxy (based on ∂18O measurement) and recent direct measurement of temperatures on the Greenland ice sheet. How that might be resolved is an interesting question, but not directly relevant to the point at issue — which is what Don Easterbrook is trying to show. Here’s his conclusion:
So where do the 1934/1998/2010 warm years rank in the long-term list of warm years? Of the past 10,500 years, 9,100 were warmer than 1934/1998/2010. Thus, regardless of which year ( 1934, 1998, or 2010) turns out to be the warmest of the past century, that year will rank number 9,099 in the long-term list. The climate has been warming slowly since the Little Ice Age (Fig. 5), but it has quite a ways to go yet before reaching the temperature levels that persisted for nearly all of the past 10,500 years. It’s really much to do about nothing.
1855 — Easterbrook’s “present” — was not warmer than 1934, 1998 or 2010 in Greenland, let alone around the world. His claim that 9,100 out of the last 10,500 years were warmer than recent peak years is false, based on a misunderstanding or misrepresentation of data.
The last word goes to Richard Alley, who points out that however interesting the study of past climate may be, it doesn’t help us where we’re heading:
"Whether temperatures have been warmer or colder in the past is largely irrelevant to the impacts of the ongoing warming. If you don’t care about humans and the other species here, global warming may not be all that important; nature has caused warmer and colder times in the past, and life survived. But, those warmer and colder times did not come when there were almost seven billion people living as we do. The best science says that if our warming becomes large, its influences on us will be primarily negative, and the temperature of the Holocene or the Cretaceous has no bearing on that. Furthermore, the existence of warmer and colder times in the past does not remove our fingerprints from the current warming, any more than the existence of natural fires would remove an arsonist’s fingerprints from a can of flammable liquid. If anything, nature has been pushing to cool the climate over the last few decades, but warming has occurred.
See also: MT at Only In It For The Gold. My thanks to Richard Alley and Jason Box for their rapid response to my questions.
NOTE: This rebuttal is an edited version of a blog post first published by Gareth Renowden at Hot Topic.
Intermediate rebuttal written by Gareth
Update August 2015:
Here is a related lecture-video from Denial101x - Making Sense of Climate Science Denial
Last updated on 4 August 2015 by MichaelK. View Archives


Mike Hillis @74.
You are claiming that "the OP claims that there is no isotope proxy after 1855 because of this reason (ie that "it takes decades for snow to consolidate into ice."), which is utterly wrong."
The OP does assert this reason but specifically saying "the first data point in the temperature series (is) from layers dated to 1855." Thus your "isotope proxy" must mean a 'temperature series' and we are specifically discussing such a series that is also δ18O-based. I contend there is no such temperature series presenting post-AD1855 data and challenged you @70 to show there was one.
You claim @74 to have already shown such a data series @58 above.
But do you not see the problem? That data presents GISP2 δ18O data. It is titled "GISP2 Oxygen Isotope Data." It does not present a temperature series.
The reason it is not GISP2 Temperature Series Data is because it is no simple job to convert that GISP2 δ18O data into temperature data. Calibration using borehole temperatures & gas analysis and the data smoothing used through the ice core would become highly problematic if somebody wished to make use of the δ18O data within the firn & snow layers.
And I cannot take seriously your suggestion that AD1855 is some form of limit of interest for a study of the Younger-Dryas event. Perhaps in Alley (2000) you can see some reference to data more recent than 10,000yBP. Myself, I cannot.
While the reason for the Alley (2004) data ending in AD1855 is not greatly significant to the error of Easterbrook addressed by the OP, the reason given for AD1855 being the end-date may not be strictly correct but it is in no way "utterly wrong."
Wrong and utterly wrong are the same thing. Remove it. And thank me for pointing out the error net time, instead of gish galloping.
[RH] Please improve your tone of commenting. As pointed out before, neither Tom nor MA are gish-galloping. They're merely explaining the relevant science.
Mike Hillis @77.
As I demonstrated @70, your input onto this thread has been remarkable in its content. The one significant contention you had not eventually retracted prior to #70 was there challenged and you have thus far failed to present any meaningful response to that challenge.
I was generous @76 in conceding that your complaint did include pointing to an explanation within the OP that to my eyes "may not be strictly correct" but I do not @76 concede that that explanation is "wrong." If you still consider that it is "wrong" or "utterly wrong," you really should present reasons for considering it so and not resort to unsubstantiated assertions. That is what the SkS comments policy requires of you. "If you think our debunking of one of those myths is in error, you are welcome to discuss that on the relevant thread, provided you give substantial reasons for believing the debunking is in error." (My bold)
MA Rodger @78, I have done some further investigation and found out that Mike Hillis is correct on one key point. Specifically, when comparing the Alley (2004) data to the Washington University measured samples data, it becomes evident that the first few samples in the Alley data are at approximately:
(All values other than the first rounded to the nearest meter.)
The issue here is that while all values are well inside the diffusion zone (below the first 20 meters of firn) where diffusive and gravitational diffraction of isotopes occurs, it is not until the 14th (or possibly 13th) value that we find a value below the close off depth at which the firn closes to form bubbles in the ice (specified as 72 meters fo GISP 2 in table 1 of Schwander et al (1997)). Arguable the 8th through 13th values come from the non-diffusive zone of the firn, where "air is not able to equilibriate with the overlying diffusive zone because of the tortuous nature of the firn" (Schander et al 1997), and hence where included air is effectively sealed from the atmosphere even thought not yet enclosed in ice bubbles. It remains that the first seven values are from the diffusive zone where air content is essentially modern, though with some diffraction of heavier isotopes. Ergo it is not possible that the explanation given in the OP (and by myself @ 53) for the 1855 terminal data of the Alley (2004) record as related to the closure of the firn is correct, even in principle.
Of even greater concern is that the Alley values do not allign precisely with the "measured values". Given that Alley (2000a) and (2000b) (of which Alley (2004) is the data record) are derived from Cuffey and Clow (1997), who derive their oxygen isotope data from Grootes et al (1993) of which the "measured values" are the record. It may be that this is because the measured data has been updated for some of the later studies of which it represents the cached data. However, annually resolved oxygen isotope data were available as early as 1995 (indeed, earlier given time from submission to publication), so that is unlikely to be the reason.
The discrepancy is more likely to be due to the fact that in Alley (2004) "Data are smoothed from original measurements published by Cuffey and Clow (1997)" (my emphasis). That being the case, the 1855 terminal data point may include data from later than 1855, as well as earlier. I say "may" because at that point at that time in the "measured values" there are several values per annum so that the smoothed values may come from entirely within 1855, and are unlikely to include values earlier than 1861 (based on the interval to the next value). Regardless, I think the nature of the smooth, and if possible the original data values need to be clarrified with Richard Alley, and the OP corrected to account for that information. This is even more necessary than the need to delete the straight forwardly erronious claim that "The reason is straightforward enough — it takes decades for snow to consolidate into ice".
While I don't mind admitting errors, I must admit some chagrin to discover that Mike Hillis has made true claim based on invalid reasoning (ie, the assumption that only oxygen isotope data goes into the temperature determination). In particular, air pressure in enclosed ice was used to confirm the altitude correction in Cuffey and Clow (1997), for which the relevant data clearly does not come up to the present (see Raynaud et al (1997) figure 1). Evidently no such correction can have been made for the most recent data in the record, but Mike Hillis certainly did not know that.
In passing, my discussion above presents evidence that shows a couple of his more recent claims to be false. His claim @75 that "the core study at the University of Washington was started around 1997" is shown to be egregiously in error, given that the first published paper from that core study was in 1993. His explanation that "Alley stopped his temperature data at 1855 in his paper on the Younger Dryas, not because that's the latest data he had, but more likely because he was writing about an event at the beginning of the Holocene and anything after 1855 was not relevant to the Younger Dryas" is also shown to be false. Alley (2004) does not represent just the data for Alley (2000b), which discusses the younger Dryas, but also Alley (2000a), and more importantly Cuffey and Clow (1997) which discusses the temperature record from the GISP 2 ice core, and which therefore had every reason to be brought as close to the present as possible.
Here we go again with the air bubbles. We are measuring the oxygen isotopes in the ice crystals, the O in the H2O, not in the O2 of the air bubbles. Nobody cares about the air bubble entrapment when measuring the isotopes in the ice. You keep talking about the isotopes in the gas bubbles. Do you think that air passing in and around snowflakes and uncompacted firn somehow changes the isotope contant of the snow? Are you suggesting the 18O and 16O in the ice diffuse differently into the air during sublimation of the ice? Not going to happen. Or maybe the 18O and 16O in the oxygen of the air diffuse into the ice somehow, and differently for the two species? I doubt it, but so what if they did? The isotope content of the O2 in the atmosphere has been stable for millions of year, and any change it effects on the 18O/16O ratio of the ice would be the same for every age of ice, and it would make no difference whether the air was trapped or not. Gravitational diffraction of isotopes? You can diffract light, how the heck can you diffract an isotope? I think you made that up. It's not a typo because you said it twice. You can't diffract an isotope with gravity. Makes no sense.
If what you are talking about is dating the air bubbles trapped in the ice, or analyzing the atmospheric gas content over time, via those bubbles, that's one thing, and yes the air in the ice is newer that the snow it's trapped in, because of diffusion, but this is not related to paleothermometry. To get a temperature proxy, isotopes are measured by taking ice, firn, or snow from the cores, and melting them, and testing the isotopes in the water. Nothing is done with the air during that test. The oxygen is passed to CO2 and bombarded with electrons so they have a charge, and the charged CO2 is accelerated past a magnet which bends the path, and the CO2 with 18O goes one way and the regular CO2 goes the other way.
As for measuring the total gas content of the ice related to altitude, that's another thing, which I never mentioned, purposely. Here's how it works anyway...The atmosphere is thinner with altitude so less air will be trapped in high altitude snow, so Cuffey and Clow measured total gas content released from the ice as it melted (not pressure of the air bubbles, as you say. Pressure? Nobody measures pressure of gas bubbles in ice. They melt the ice.) They found that the elevation of the Greenland Summit did not change at all during the Holocene. So why would they use total gas content of the ice (not pressure) to adjust for elevation? I will quote you now:
"Evidently no such correction can have been made for the most recent data in the record, but Mike Hillis certainly did not know that"
Really? I certainly did not know that? I did not know they would never adjust for elevation that did not change? Hmmmm.
Mike Hillis - I've looked over this thread a couple of times, and I one major question for you:
What is your point?
The archived and published temperature data for Alley 2000, using "...ice-isotopic ratios, borehole temperatures, and gas-isotopic ratios" (emphasis added), indeed starts at 1855 and goes back, entirely appropriate for examining the Younger Dryas cold period - the entire point of the Alley 2000 paper.
Gas-isotopic ratios aren't usable until the firn packs, borehole temps near the surface become increasingly noisy due to local weather, and most of all, Alley wasn't using paleo data for the last few hundred years of temperatures. Whether or not it's possible to extract paleotemperatures from the top few meters of recent snow is simply immaterial - you don't need paleotemperatures when there's an existing instrumental record, and Tom Curtis and others have correctly pointed out that recent years aren't in the published data from that ice core. Easterbrook, Monckton, and others (mis)using the Alley 2000 and GISP2 data made fundamental dating errors in their arguments, local temps aren't global temps, and so the myth discussed in the OP is, indeed, busted.
IMO you made some extremely strong and unsupported claims against the OP in your first post ("this fabrication"), and have since been dancing around the corrections provided to you; trying to retain some kind of issue to be "shocked" about. As far as I can see there is no issue with the OP, and you are now arguing about (possible) data of no interest to Alley 2000, data that wasn't collected or published, data irrelevant to either the paper or to the dating errors made by (among others) Easterbrook and Monckton.
Arguing about the number of angels that could dance on the head of a pin would be just as relevant to the opening post. If you have an actual issue with the OP, please state it - otherwise, you're just making noise.
Tom Curtis @79,
I agree that the Alley (2004) data is almost certain to have used post-AD1855 data and that such data (indeed even the measurements at AD1855) would not be from layers that had by the time of their sampling been truly 'consolidated into ice'. Yet I do not believe that the data used by Alley (2004) included all the data up to that measured at AD1987. That is why I hedge my bet @76 & suggest the post 'may not be strictly correct'.
Note too that the "reason" which is described as being "straightforward enough" concerns either (1) why the data that Easterbrook was "not from the top of the core" or (2) why it comes "from layers dated to 1855." Which it is? That is not clear.
The one circumstance that would make this "reason" wrong in any circumstance would be if the reason was wholly a need to smooth the data. That is if all the data was used up to "the top layer" but this resulted in the latest data point being AD1855, then the length of time for 'consolidation into ice' is an irrelevance & the "reason" given by the post would be incorrect.
My reasons for believing that some data has not been used from the most recent layers is that plots of the Alley (2004) data and a smoothed plot of the d18O data to 1987 appears to show that the AD1855 data point would have given a higher value if all the post-AD1855 data was used (ie the Alley (2004) rise 1970-1855 of 0.4ºC is too small given the full data). I suspect that up to 100 years may have been shorn from the measurements and their absence is preventing temperature calculations for years later than AD1855. Also, one worrying feature of the latest data is the increase in inferred annual temperature cycle, an increase that starts to show itself for measurements from the 1890s. And other calibration data which relies on ice formation will become more raggedy as the layers of consolidated ice are left behind.
Such "reasons" would amply explain why the 'top of the core' was not used (as (1) above). I consider however that it is not semantically true for (2) as the "layers" are not dated to AD1855 but rather it is the average of the usable layers (that have been adequately consolidated) that date to AD1855. Add in a discomforting amount of supposition in this discourse, and the matter does require a mention.
Mind, I would not consider the audience of Mike Hillis as approporiate for this matter. He may feel he has hit the target but in truth he tramples the target. As stated @79, his reasoning is invalid.
For him, the point to mention is that his interpretation of this ice core data surely shows that the four warmest summers of the years for which we have adequate data (the last 1,000 years) apparently occurred in the last 10 years of GISP2 ice/snow data with half the top 30 warmest summers occuring since 1950. So would he be happy proposing such a hockey-stick-like finding? Or would he wish to revise his position?
Correction @82 - (ie the Alley (2004) rise 1750-1855 of 0.4ºC is too small given the full data).
Mike Hillis @80, yes, "here we go again with the air bubbles". Just because you do not understand the mechanisms involved does not mean they are invalid, nor that they have not been properly explained in Alley (2000a) and (2000b), as noted @69 above.
Specifically, Alley (2000a) states:
Alley (200b) states:
Reference 8 in Alley (2000a) is just Severinghaus, Sowers, Brook et al., (1998), which states:
Your gross misunderstanding of the process involved clearly shows that you did not read the linked references (which are only the scientific articles we are discussing in the first place). Your strongest argument appears to be your invincible ignorance.
By 2010 this method was sufficiently refined that Kobashi et al (2010) and Kobashi et al (2011) could use it to construct an independent GISP 2 paleo temperature record. In 2000, however, Alley only used it as a supplement to his basic d18O paleothermometer. But because he used it as a supplementary thermometer, the depth at which the nitrogen and argon isotopes can be used to effectively provide a temperature record becomes important.
I will note that I have incorrectly used the term "diffraction" when I should have used the term "fractionation". That is a massive error compared to your identifying the wrong isotopes, the wrong method, and falsely claiming the gas isotopes would equilbriate with the ice isotopes that it must obviously prove your point /sarc
Your compete befuddlement with regard to the gravitational fractionation as a paleothermometer is as nothing compared to your comments on total gas content. You are very specific that "[Cuffey and Clow] found that the elevation of the Greenland Summit did not change at all during the Holocene." This is a point you are so secure on that you make it the foundation of your claim that you had the relevant knowledge to exclude any possible elevation correction in the recent record.
It even has some basis in Cuffey and Clow, who state, "The corresponding elevation (relative to sea level)
histories show a near-constant Holocene elevation". The only problem is that the full sentence states, "The corresponding elevation (relative to sea level) histories show a near-constant Holocene elevation for AL = 50 km, and a decreasing Holocene elevation for larger retreats (Figure 2b)." (My emphasis) This relates to the discussion of three assumptions about modeling of elevation based on marginal retreats of the ice. As is clear, they are only committed to "near-constant Holocene elevation" if marginal retreats match the 50 km assumption, however they find that:
They go on to say:
In otherwords, "[Cuffey and Clow] found that the elevation of the Greenland Summit did not change at all during the Holocene" only if you assume they found marginal retreats nearly a third less than those they actually found, and totally ignore the gass content data, which was reproduced in Vinther et al (2009):
So, your defence against my claim that you certainly did not consider elevation changes is to assert that Cuffey and Clow did not find any elevation changes so that your failure to consider them was entirely justified. By that defence you prove that you did not consider elevation changes, which Cuffey and Clow found to exist, and which gas data show to have fluctuated significantly in recent times (see GRIP total gas content in the graph above). You thereby prove, not only that you are wrong about the elevation changes, but that you indeed did not consider them as I originally asserted. Your defence merely proves my assertion justified. LOL
For the record, the most recent air content data for the GRIP ice core is 169 BP (ie, 1781), and indicates an elevation at the Greenland Summit over 100 meters above current levels (as seen above).
Also for the record, I note that Mike Hillis continues to argue by mere assertion; and has now resorted to asserting findings for scientific papers that are directly contradicted by those papers. Just how much sloganeering is permissible at Sks?
MA Rodger @82, the sentence, "The reason is straightforward enough — it takes decades for snow to consolidate into ice" is quoted from the OP, and is now shown to not be straight forward, but straight forwardly false. From the OP, the "reason" is the reason why 1855 is the terminal point of the data. If the reason for that terminal point is a smoothing of the data, that may be a sufficient reason for the 1855 terminal point, and would also be reason as to why the 1855 represents a function of actual data both prior to and after that date. From the description of the data, that is at least part of the reason as to why the terminal point in the data is 1855 rather than 1987 (the terminal point of the d18O data). There may, however, be some further reason as to why data used in the smooth was terminated prior to 1987 as well.
I am not convinced that the smooth did not us all the post 1855 data. That is because any increase in the post 1855 data is likely to have had a equivalent increase in pre 1855 data for that data point. Had data to 1987 been used, then data from 1723 would have been used in generating the smoothed 1855 data point. The lower temperatures in 1723 relative to 1855 would have approximately balanced the higher temperatures in 1987 relative to 1855.
Easterbrook used Cuffey and Clow 1997 who I cite presently:
"In this paper, we treat our calibrated isotopic history as synonymous with temperature"
and
"We have found the calibrated d18O record to be a good proxy for environmental temperature.....with the following calibration: T = 3.05 d18O + 75.4 for t = 8,000 years,"
and 3 similar calibration equations for different levels of t, with no factors in any of the equations other than the ice isotopes d18O. No factor for any adjustments for elevation using total gas content in the bubbles, and although these were discussed in the paper, the discussion was limited to why this information could not be used. No mention of gas isotopes in the equations either, and although I appreciate your correction of your use of the word "diffraction" when you meant "fractionation" of the gas isotopes, the bubbles were still not used. As much as you stretch your arguments to the several imagined or pretended ways the bubbles were used, extending even to the citing of papers written years after Easterbrook's, they were not.
And since the bubbles were not used, the time it takes for consolidation of snow into firn and ice is not germain to the proxy used by Easterbrook.
And as much as MA Rogers tries a "gotcha" gambit by pointing to the Alley paper, claiming that he used the gas isotopes in the temperature proxy, Easterbrook used Cuffey and Clow, who never did.
In other words, the phrase in question in the OP, about how it takes decades for the snow to consolidate, should be removed. For my reasons, not yours.
And this says nothing about the main problem with the OP, which is the elephant in the room, namely, the claim that ice cores are only a local proxy of paleotemperature. Easterbrook correctly uses it as much more than a local proxy, as does Alley, who says in "Two Mile Time Machine"
p. 114 "Much of the world's climate is coupled to that of Greenland"
p. 121 "The surface of the north Atlantic was cold whenever Greenland was cold, and the north Atlantic surface was warm whenever Greenland was warm."
Anybody can see that Greenland is not the source of the moisture that falls on it. Furthermore, the snow that falls on Greenland is not due to condensation of water vapor, but the deposition (the opposite of sublimation) of water vapor, in other words, from the vapor state directly to the solid. Since there is no liquid phase in between, in the formation of snow, the fractionation of condensation is not relevant in snow production. Only the fractionation of freezing. And since the freezing point of water and that of 180 water are only 0.23C apart, there is very little fractionation at the precipitation site, compared to the much greater fractionation due to evaporation, because of the much greater difference in the boiling/condensation points between the two species. It follows that the temperature proxy demonstrated by the ice cores reflects temperatures at the evaporation site much more than at the deposition site.
Mike Hillis @87/88.
I see you're back with two new bold assertions.
(F) You tell us "Easterbrook used Cuffey and Clow." Your statement directly contradicts the OP (a point you fail to mention) which points out that while Easterbrook claims his Figure 4 is "Modified from Cuffy and Clow, 1997," it is in truth "a graph ... almost certainly copied and altered from ... Richard Alley’s 2000 paper." With regard to Figure 4, you are ignoring the nature of that 'modification'. Mind, you may be describing other data presented by Easterbrook but if so it would help greatly if you could identified what data it is that you are blathering about. If it is graphs other than that Figure 4, it will be interesting as the graphs presented by Easterbrook in that particular thesis are a seriously odd set.
(G) You are now suddenly telling us with some emphasis of the GISP2 ice core data "Easterbrook correctly uses it as much more than a local proxy, as does Alley." Again you contradict the OP and even contradict yourself. Concerning what is meant by "much more than a local proxy," Easterbrook is on record presenting GISP2 data as showing "global warming," a position you are presumably telling us is "correct." Alley, as the OP says, considers this wrong, saying in the citation"no single temperature record from anywhere can prove or disprove global warming, because the temperature is a local record, and one site is not the whole world"He describes in that citation how and when a local record can be used for wider regions, but note the point he makes is that using GISP2 as a global record (à la Easterbrook) is utterly wrong.
Easterbrook is an old man. He went to school (and taught school) when the spaghetti graphs looked like this:
https://www.ipcc.ch/ipccreports/far/wg_I/ipcc_far_wg_I_chapter_07.pdf
And everybody knew that most of the Holocene was warmer than today (back then). In those days, the temperature reconstructions (same link) showed only 0.4 C rise from the depths of the LIA to today (then). Now, due to all the GISS and NOAA data tampering, the erasure of the 1970's cooling, etc. they are saying 0.8 C or more. But 0.8 isn't enough for alarmists so they project another 2.0 or 3.0 degrees in the next 10 years and add it to the hockey stick to scare everybody, but we won't get into that. (-Snip-)
Easterbrook is wrong about the GISP2 being global, it's NH, as there is very little circulation between the two hemispheres. Werner et al 2001 shows that 96% of the snow that falls on Greenland comes from the NH and only 4% from the SH. Link here: http://epic.awi.de/18985/1/Wer2001b.pdf with similar percentages for Vostok in reverse.
Easterbrook says global, Alley says north Atlantic, Werner says NH. One thing we do know is that NONE of the moisture that falls on Greenland comes from Greenland, so it is anything BUT a local proxy. If you think Greenland ice cores only tell the temperatures of Greenland, you are quite mistaken.
Still digesting my comment about deposition vs condensation? All these scientists are treating snowfall in Greenland as if it results from condensation. Am I the only one smart enough to see why this is utterly and stupidly wrong? No, meteorologists all know it, and work with this daily (in the winter).
[RH] Accusations of data tampering snipped. Please go back and read the SkS commenting policies. This is not allowed on this website. Also warning snipped comment for tone.
Please note that posting comments here at SkS is a privilege, not a right. This privilege can be rescinded if the posting individual treats adherence to the Comments Policy as optional, rather than the mandatory condition of participating in this online forum.
Please take the time to review the policy and ensure future comments are in full compliance with it. Thanks for your understanding and compliance in this matter.
I would say dO18 as a local temperature measurement is well established in theory and in measurement. See here especially the figure comparing dO18 temperature to Greenland temperature.
scaddenp @90,
Your assessment of δ18O data is surely indisputable.
Mike Hillis @89,
I note that unsnipped @89 you restate what I branded @70 as your proposition (E), an unsupported assertion that the climate myth addressed by the OP is no myth. That is you tell us that, apparently, once "everybody knew that most of the Holocene was warmer than today" and add (now snipped) the implication that you believe (why we know not) that they were correct in that erstwhile position. All very "grassy knoll."
On more particular matters, if I read you right, while you said previously "Easterbrook correctly uses it (ie GISP2 ice core δ18O data) as much more than a local proxy, as does Alley," what you now mean is that "Easterbrook is wrong about the GISP2" and that Alley, who doesn't actually agree with Easterbrook's use of theGISP2 ice core δ18O data after all. is also himself wrong as he is happy to see the GISP2 ice core δ18O data as “a local record“ of temperature at “one site,” an idea that you brand as being “utterly and stupidly wrong.” So you thus presently consider that they are both utterly wrong. (I'm not sure if the use of adjectives “utterly” and “stupidly” are intended to have meaning or have purely an expletive role as you are on record informing the world that “wrong and utterly wrong are the same thing.”) Whatever, both Easterbrook & Alley are now wrong but for different reasons.
Instead, we now have a replacement for your now-defunct proposition (G) which is:- (H) “One thing we do know is that NONE of the moisture that falls on Greenland comes from Greenland, so it (ie. GISP2 ice core δ18O data) is anything BUT a local proxy.” That is, you are saying the data does not provide a record of the site's temperature history. Noting the comment @90, best of luck with that.
sacddenp, your link to the graph:
http://www.iceandclimate.nbi.ku.dk/images/images_research_sep_09/GRIP_93_pit.png
shows correlation between Greenland ice core temps and d18O, on a monthly basis. That means higher temperatures in July, for example, than April. This of course applies to everywhere in the Northern Hemisphere.
If the ice isotope proxy corresponds to temps in Greenland, and not everywhere else in the NH, then we can consider it a local proxy. It does not.
Now let's get back to my point about how snowfall results, not from condensation, but rather from deposition, which I point out is a much weaker fractionation force, for the reason I stated, than evaporation/condensation. This means the main fractionation happens at the evaporative source.
Mike, I am in SH, but I am pretty sure that a temperature range of -10 to -45C determined bydO18 is representative of Greenland and not the NH.
Your assertion that fractionation is primarily at evaporative source does not appear to be supported in literature (here and here for example).
Source:
If you have new research that contradicts, then please provide a cite.
Mike Hillis
Here is some more info from the same site scaddenp linked to. Interesting stuff. Read particularly the link about deuterium excess.
Wikipedia has a brief discussion here.
This paper also discusses this and the fact the 18O and Deuterium are well correlated with surface temperatures at the depositing location whereas deuterium excess is correlated with temperatures at the evaporative source.
As the first link points out, D excess actually allowed the glaciologists to detect a transition in the source temperature in the ice core record that occurred within 1-3 years!. This is interpreted as a change in weather patterns so the water was coming from a different location. This rapid transition in the ice core record is actually used as the marker to define the start of the Holocene.
Your point about deposition vs condensation and that thus the main fractionation occurs at the evaporative source seems to be drawing too long a bow. That assumes that the only precipitation that occurs after initial evaporation all occurs as the final fall of snow. When in fact, as the schematic on my first link indicates, precipitation would likely occur at multiple stages over the journey of the moist air mass, much ot it as rain. Hail also would be based on condensation based fractionation. Snow that forms around water droplets would be a compound of deposition and condensation fractionation. Only snow that forms from pure deposition around CCN's woukld be pure deposition fractionation.
So the picture is much more of a hybrid than what you suggest.
With Deuterium excess available to determine the proportion of fractionation due to evaporation, that leaves the pure 18O and deuterium readings available tothen unpack the fractionation that occurs over the journey of the air mass.
Importantly, there is one piece of evidence suggesting ice cores are regional/local not hemispheric, which is average residence time for water in the atmosphere. This is estimated at around 9 days. In contrast intra-hemispheric mixing time - how long air takes to mix around within one hemisphere - is estimated at 1-2 months. This strongly suggests that most evaporated water falls out again on scales below hemispheric.
And if are dO18 values of -25 to -45 in greenland ice core are supposed to be representative of NH, then how are these values (-6.8 to -8.6) in Fig 1B in this paper of dO18 measurements from Central Alps not also representative?
I am unsure Mike Hillis what point Hillis is arguing with respect to the GISP2 d18O proxy. Is it that it represents "much of the world's climate", or that it represents Northern Hemisphere temperatures, or that it represents North Atlantic temperatures. Whichever is the case he is shown to be wrong by the ice core records. Consider for example the difference between GISP2 and Guliya (from the Tibetan plateau) as shown in this graph of various polar and tropical ice cores:
It is quite clear that if either is representative of the Northern Hemisphere, then both should be highly correlated given that both are NH ice cores. But clearly they are not. Ergo neither is reprentative of NH temperatures. Still less are either representative of "much of the world's" temperature.
By similar reasoning, neither can GISP2 be representative of North Atlantic temperatures. Here are the Holocene d18O records of six Greenland ice cores:
As all draw their precipitation from the North Atlantic, if all represented North Atlantic temperatures they would by isomorphic. Again, clearly they are not, having distinctly different holocene slopes and inflection points. In particular DYE-3 shows a warming trend through the Holocene, while Agassiz and Renland show a more rapid cooling trend. Camp Century warms until 5-6 thousand years before 2000 AD, while the other records show much earlier (although not synchronous) inflection points.
A similar point can be made from the famous Global Warming Art Graphic:
The wide divergence of shapes of the curves preclude any from being a proxy of global temperature except on the coarsest of resolutions. However, even the GISP2 (light blue), North Atlantic sediment core (specified as yellow, but which I see as a very light lime green), and European pollen data (orange) show distinctly different shapes, even though all are Northern Hemisphere records, and all are significantly influenced by North Atlantic temperatures.
Part of Mike Hillis' problem is that North Atlantic temperatures do not vary synchronously. While one part of the NA may be warming, another may be cooling As the precipitation on Greenland comes from a small part of the North Atlantic, not the whole of it; that means Greenland ice cores can only represent the temperature of the whole of the North Atlantic, but only small parts of it. In the case of GISP2 and GRIP, zone of the North Atlantic from which precipitation is drawn varies, shifting to a more southerly (and distant) location when the North Atlantic Oscillation is negative. That means the GISP2 record cannot even be of a single region within the NA (based on Hillis's suppositions), but from two different locations with distinct mean temperatures, leading to an exagerated temperature seesaw based on changes in the NAO.
Further, even close locations such as GISP2 and GRIP (just 28 kms apart) show variations in the detail of the d18O record (See figure 3 here). This may not be due to site specific factors, however. Of five ice cores from the GISP site, the cross correlations over the period 1770-1987 show a high value of 0.552 and a low value of 0.464 (Table 1 here). GISP2 shows a correlations ranging from 0.408 to 0.549 to those GRIP cores. Interestinly White et al show the highest correlation with the mean of the 6 stacks to be with the mean of the coastal temperature record, with a correlation of 0.471 (Table 2, above link). The individual isotope records have correlations ranging from 0.172 to 0.502 (mean: 0.363, data from Table 1). For comparison, there is only a 0.279 correlation to the annual NAO index. The later suggest to me that temperatures over the Greenland Ice Sheet are a more significant factor in the d18O record then are sea surface temperatures at the site of evaporation, although that is still a significant factor.
Hello,
Does anyone have any idea whether such climate optimum is predicted in future, is it even possible to predict such occurence?
Cheers.
Redrum @97 ,
best if you define the meaning of "such climate optimum".
"Optimum" is a term which is in much danger of being very subjective and bordering on useless for discussion. To look at it more closely would require a careful examination of plant/animal evolution, and of course the present rapid rate of global warming (in relation to biological adaptation of species).
If I were pressed to give a facile comment, I would say that global climate conditions at year 1950 AD might represent somewhere close to (biological) optimum. You will have noted from the OP's article and various commentaries on it (including graphs), that 1950 climate is rather similar to the broad span of the mid-Holocene.
And that the large and continuing rise in temperature since 1950 does push the global climate well above the earlier Holocene warm plateau — and much more of that hotting-up is yet to come [to our detriment]. So unfortunately, the "Optimum" is receding well into the past, and with little likelihood of being regained in the next few thousand years.
@11 NikFromNYC on 21 May, 2011 Your "Oh wow,...it becomes suggestive that there is a very good chance that recent warming may be a peak that is about to plunge back down, masking greenhouse warming for up to a century or more". So I'm typing this on October 28, 2017 so how did that plunging back down of GMST for the last 6 years work out for you NikFromNYC ? Time to get back to us all.
[DB] That participant of whom you speak recused themself from further participation here, years ago. Due to their complete unwillingness to adhere to the Comments Policy.
Greenland has been loozing a lot of its ice lately (2017-2018)
Could it be because of this underground thermal activity.They do have nateral hot water pools in greenland.
https://theplanetd.com/bathing-at-the-top-of-the-world-greenland/
[JH] Link activated.