Climate Science Glossary

Term Lookup

Enter a term in the search box to find its definition.

Settings

Use the controls in the far right panel to increase or decrease the number of terms automatically displayed (or to completely turn that feature off).

Term Lookup

Settings


All IPCC definitions taken from Climate Change 2007: The Physical Science Basis. Working Group I Contribution to the Fourth Assessment Report of the Intergovernmental Panel on Climate Change, Annex I, Glossary, pp. 941-954. Cambridge University Press.

Home Arguments Software Resources Comments The Consensus Project Translations About Support

Bluesky Facebook LinkedIn Mastodon MeWe

Twitter YouTube RSS Posts RSS Comments Email Subscribe


Climate's changed before
It's the sun
It's not bad
There is no consensus
It's cooling
Models are unreliable
Temp record is unreliable
Animals and plants can adapt
It hasn't warmed since 1998
Antarctica is gaining ice
View All Arguments...


Username
Password
New? Register here
Forgot your password?

Latest Posts

Archives

Comparing past climate change to recent global warming

What the science says...

Statistical analysis of the rate of warming over different periods find that warming from 1970 to 2001 is greater than the warming from both 1860 to 1880 and 1910 to 1940.

Climate Myth...

It warmed just as fast in 1860-1880 and 1910-1940

“In fact, the rate of warming from 1975-2001, at 0.16 °C per decade, was the fastest rate to be sustained for more than a decade in the 160-year record, but exactly the same rate occurred from 1860-1880 and again from 1910-1940, when we could not possibly have had anything to do with it.” (Christopher Monckton)

Let’s have a look at some warming rates of the periods of interest from several different temperature records:
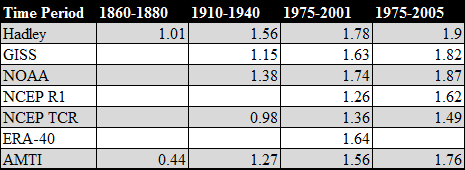

Table 1: Rate of warming for given indices in °C/century.

First we can conclude that Monckton's statement that 1975-2001 was the fastest warming rate for longer than a decade is absolutely wrong as a much higher rate is demonstrated for 1975-2005 in row 5. Secondly, to compare the three periods in Table 2, the only index which covers that period is Hadley, making his 1.6°C per century number wrong for 1975-2001 as it is actually much higher at 1.78°C per century.
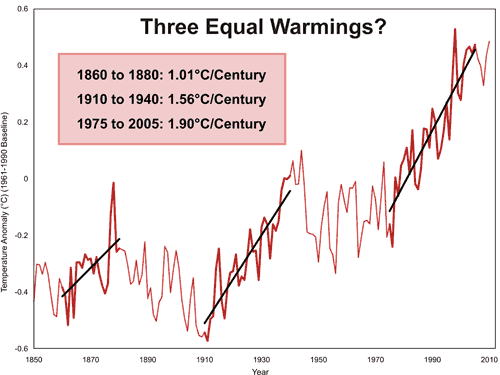
 

Based upon the evidence presented here, he cannot support his statement that 1860-1880 had a similar warming rate as it was demonstratively lower than the 1975-2001 warming rate and nearly half the 1975-2005 rate. Finally, regarding the 1910 to 1940 warm period, evidence presented here suggests that only 1 out of the 4 major indices indicates a rate of warming within 0.25°C per century and none within 0.2°C. His claim that the rates are similar is dubious at best.

Last updated on 31 January 2011 by robert way.

Printable Version  |  Offline PDF Version  |  Link to this page

Argument Feedback

Please use this form to let us know about suggested updates to this rebuttal.

Comments

Prev  1  2  3  4  5  

Comments 101 to 109 out of 109:

  1. KR@99 While it is technically possible to change your IP, and Poptech has admitted to being a computer system administrator (or something similar)I do not think that Adam is the same person. They employ alot of the same arguments and technique but the tone is different. I have encountered these same arguments and methods from people I know are not Poptech. Adam != Poptech in my opinion, but they are are equally wrong.
  2. I'm pretty convinced this is Poptech based on a Mises rant that I dragged out of him one day.
  3. First of all, I just like to make it clear that I am not poptech. We are two different people. "No, you were repeating my claim (about Greenland) and then extending it in a single leap to apply to the whole of GHG climate science." Sphaerica, so to be clear, are you saying that there isn't empirical evidence that humans are causing Greenland warming, but you believe that there is empirical evidence that humans are causing global warming? Is that what you're saying, because we seem to be going around in circles here. Muoncounter, might I remind you that it works both ways for you as well. If you believe that using less stations won't significantly affect the readings, then according to your own logic, the data would have been pretty reliable 60 years ago as well. Dikran and muoncounter, once again have you even read the paper I provided? The difference between surface and satellite data, started around 20 years ago, corresponding with the adjustments made to the global surface temp network. Here is a very detailed document, which discusses the problems with the surface temperature record: Surface Temperature Records: Policy Driven Deception? And read the following paper: 'Unresolved issues with the assessment of multidecadal global land surface temperature trends' by Roger Pielke Sr et al published in the 'Journal of Geophysical Research' (2007) ""co2 was much higher 60 years ago" That's just plain wrong. Enough said. " That was a typing mistake. I meant to say that CO2 is much higher than it was 60 years ago. Anyway, this is going nowhere. I keep having to endure cheap insults, and in this discussion, everyone just keeps going around in circles. I think that anything worth discussing on this thread has now long gone. Unless there is something worth discussing, then I don't really see any point in carrying on. This will be my last comment, unless I need to come back for any particular reason. Goodbye.
  4. PS: This may not have anything to do with what we've been discussing, but I've noticed that in this article you claim to have rebutted the skeptic argument that it warmed the same rate from 1860-1880 and 1910-1940. I just wanted to point out to you that Phil Jones himself has confirmed that the three periods of warming were indeed exactly parallel to each other. So in your "rebuttal" you're actually contradicting a prominent AGW scientist, who has confirmed the skeptical argument. http://news.bbc.co.uk/1/hi/sci/tech/8511670.stm A - Do you agree that according to the global temperature record used by the IPCC, the rates of global warming from 1860-1880, 1910-1940 and 1975-1998 were identical? An initial point to make is that in the responses to these questions I've assumed that when you talk about the global temperature record, you mean the record that combines the estimates from land regions with those from the marine regions of the world. CRU produces the land component, with the Met Office Hadley Centre producing the marine component. Temperature data for the period 1860-1880 are more uncertain, because of sparser coverage, than for later periods in the 20th Century. The 1860-1880 period is also only 21 years in length. As for the two periods 1910-40 and 1975-1998 the warming rates are not statistically significantly different (see numbers below). I have also included the trend over the period 1975 to 2009, which has a very similar trend to the period 1975-1998. So, in answer to the question, the warming rates for all 4 periods are similar and not statistically significantly different from each other. Here are the trends and significances for each period: Period Length Trend (Degrees C per decade) Significance 1860-1880 21 0.163 Yes 1910-1940 31 0.15 Yes 1975-1998 24 0.166 Yes 1975-2009 35 0.161 Yes
  5. #104 - Adam My trollometer just went off the scale! Adam, you say: "I just wanted to point out to you that Phil Jones himself has confirmed that the three periods of warming were indeed exactly parallel to each other." What a world of difference there is between 'exactly parallel' and what Phil Jones actually said: "the warming rates for all 4 periods are similar and not statistically significantly different from each other." http://news.bbc.co.uk/1/hi/sci/tech/8511670.stm I find it strange that somebody would state what Phil Jones said, and then proceed to post a proof that he did not say it!
    Response: [Dikran Marsupial] Unless, like many, Adam doesn't understand what statistical (in-)significance actually means.
  6. PPS: logicman he is saying that the difference between the rates of warming for the three periods of warming are not statistically significantly different from each other i.e. the rate of warming was the same for each one. Saying the rates were statistically significantly different would have confirmed what was said in this post, but he did not say that. He simply admitted there is no statistical difference between the three periods of warming. I'm not entirely sure what you're trying to show in your comment logicman.
    Response: [DB] "i.e. the rate of warming was the same for each one." Making this leap is where your logic fractures. [Dikran Marsupial] In this context, the test of statistical significance basically implies only that we can't rule out the possibility that the rates are the same, not that they actually are the same. Tests of statistical significance are conceptually rather subtle, and widely misunderstood, even amongst scientists and even statisticians!
  7. He also provided the data, which showed the warming rates were the same. You can clearly see it below Phil Jones' statement.
  8. Andrew... He provided three trends that were statistically significant. That's not the same.
  9. Excuse me... Four periods that were statistically significant.

Prev  1  2  3  4  5  

Post a Comment

Political, off-topic or ad hominem comments will be deleted. Comments Policy...

You need to be logged in to post a comment. Login via the left margin or if you're new, register here.

Link to this page


The Consensus Project Website

THE ESCALATOR

(free to republish)


© Copyright 2024 John Cook
Home | Translations | About Us | Privacy | Contact Us