


 Arguments


Recent Comments
Prev 994 995 996 997 998 999 1000 1001 1002 1003 1004 1005 1006 1007 1008 1009 Next
Comments 50051 to 50100:
-
Tom Curtis at 09:38 AM on 10 January 2013The Y-Axis of Evil
With reference to Philip Shehan's comment, this is the image used by Boehm to argue that temperature increases are responsible for the increase in CO2. The essential function used is the isolate function, which removes the trend and resets the mean of the series to zero. This has been illustrated here, with the "isolated" data offset for ease of comparison. As such, Boehme has joined a long list of deniers who have "proved" that temperature increases cause the rising trend of CO2 concentration by first removing that trend from the analysis. Shehan thinks such arguments raise serious ethical concerns, but that is not a permitted topic of conversation on SkS. I will note that Boehme rescales the CO2 data by a factor of 0.25. That means, even if we accept his premise, each degree rise in temperature will only cause a 4 ppmv increase in CO2. With temperatures rising by approximately 1 degree C since the pre-industrial revolution, that means at best he has shown that 4 ppmv of the 110 ppmv increase in CO2 is due to increased temperatures. Yet again we have a denier thinking only sufficiently to give himself a convenient sound bite, and not carrying the analysis through to see its full implications. That is, of course, because people who do carry the analysis through cease to be deniers (if they ever were). -
Philip Shehan at 09:05 AM on 10 January 2013The Y-Axis of Evil
A comment I have just posted on the WUWT thread for which the link is provided at comment 38 I refer to his post of January 9, 2013 at 11:37 am I recognise that this comment is decidedly "ad hominem' in the sense of being highly critical of Boehm personally as opposed to his adeas but I beleive the remarks are entirely justified being an reasonable description of his conduct and in the interest of exposing Boem's conduct I request it be posted. D Boehm Stealy [snip] I have previously drawn attention to your manipulation of Wood for trees data sets to flatten the appearance of the temperature data sets. Your conduct [snip] . Your chart in your post purports to be a plot of Muona Loa CO2 output and Hadcrut3 temperature data. It is nothing of the sort. As the WTF website states your use of the Isolate function means that you are plotting the noise after subtraction of the data, not the data itself. [snip]Moderator Response: TC: Ad hominens snipped. -
Tom Curtis at 09:04 AM on 10 January 2013Temperatures Continue Up the Escalator
Klapper @38, a person who is not a "simpleton thinker" does not stop their analysis when they have a convenient sound bite in support of their position. Thus, when they notice, for example, that the switch from generally negative ENSO conditions in the late sixties and early seventies to generally positive ENSO conditions may have contributed to the positive trend over that period (it did), they not only note that fact but find somebody who has quantified the effect; or if they have the skills, quantify it themselves. Doing so, they would find Lean and Rind 2012 and see that the ENSO contribution was minimal compared to the anthropogenic contribution to the rise in temperatures after 1975: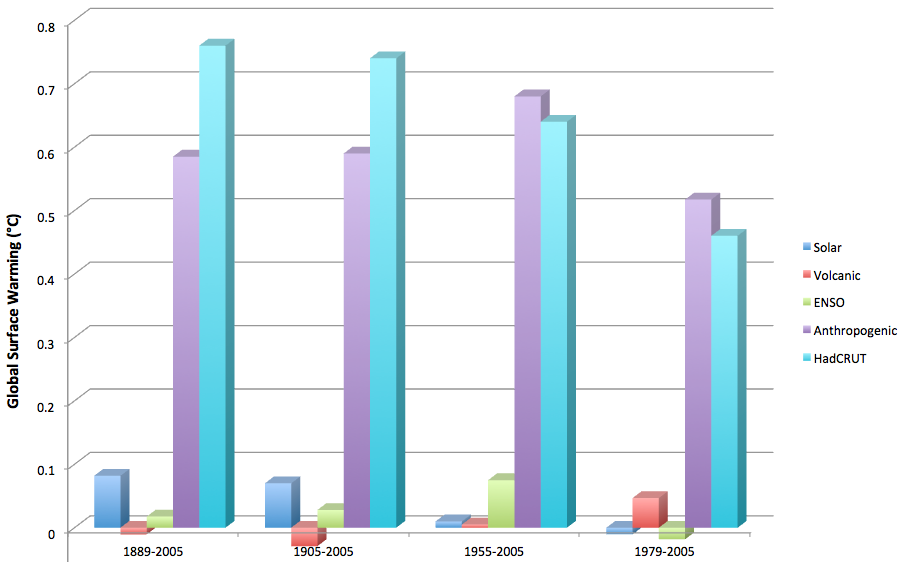 (Note in particular the 1955-2005 contributions.)
The problem is that while ENSO's contribution to global temperatures is large relative to the change in temperature due to AGW over short periods (say 16 years) it is small relative to the contribution over extended periods.
(Note in particular the 1955-2005 contributions.)
The problem is that while ENSO's contribution to global temperatures is large relative to the change in temperature due to AGW over short periods (say 16 years) it is small relative to the contribution over extended periods.
-
Alexandre at 08:39 AM on 10 January 201316 ^ more years of global warming
Heeeey... you guys are getting better and better. -
perseus at 07:47 AM on 10 January 201316 ^ more years of global warming
Great work everyone, and well timed! -
Bob Loblaw at 07:44 AM on 10 January 2013Water vapor is the most powerful greenhouse gas
Yes, KR's explanation is better. I was looking at the text in the rebuttal where it said "carbon dioxide contributes 32 W/m2 (Kiehl 1997). These proportions are confirmed by measurements of infrared radiation returning to the Earth's surface (Evans 2006).", and got messed up by the "earth's surface" part. Of course, with no atmosphere at all, there isn't any IR towards the earth's surface, but that still doesn't apply to an atmosphere with no CO2... which would have downward-direct IR at the surface. I was hasty, and messed up. The point that you need to be careful about surface vs. TOA fluxes is valid, but I'm not explaining the actual numbers that were asked about. -
dana1981 at 07:39 AM on 10 January 201316 ^ more years of global warming
By the way, there's a myth pervading the media that this year's Met Office global surface temperature prediction shows that global warming has 'stalled'. We'll have a post with a specific rebuttal to those articles tomorrow, which makes use of Kevin's video. -
Tom Curtis at 07:36 AM on 10 January 201316 ^ more years of global warming
Few presentations cut through the obfustication, contradictions and worse that constitute denier talking points as succinctly and clearly as this. Well done Kevin C; and well done also to Daniel Bailey for his excellent voice over. The sheer quality of this presentation will spark, I have no doubt, another round of conspiracy theories as the deniers refuse to admit that this work was done entirely by volunteers determined to cut through their bullshit to allow people to see the truth of global warming. -
Anne-Marie Blackburn at 07:36 AM on 10 January 201316 ^ more years of global warming
Brilliant work, Kevin. Good contribution, Daniel ;) Take a bow. -
Albatross at 07:36 AM on 10 January 201316 ^ more years of global warming
Superb. That the "skeptics" and those in denial have to keep pushing this particular meme speaks to their desperation. The sad part is that unless the media and public are educated/informed about such nuanced issues the "skeptics" will be able to keep trying to push this meme. Even as we speak Monckton and his enablers are scheming as how to cherry pick those time windows of time that produce statistically insignificant temperature trends. Unbelievable but true. So, hopefully this video can be used by the media to educate and inform the public. That way, people will turn a blind eye to ridiculous "skeptic" antics and efforts to obfuscate and the informed public will also be in a position to expose the disingenuous games of fake skeptics whenever they try and push it again. I sincerely hope that this video goes viral. -
Brian Purdue at 07:32 AM on 10 January 201316 ^ more years of global warming
Wow! What a video and post! This will have the pseudoskeptics boiling, but will educate the public on what the real “16 years” facts are. -
Rob Honeycutt at 07:30 AM on 10 January 201316 ^ more years of global warming
You have a great speaking voice, Daniel. -
Rob Honeycutt at 07:29 AM on 10 January 201316 ^ more years of global warming
That rocks!! -
Tom Curtis at 07:29 AM on 10 January 2013Water vapor is the most powerful greenhouse gas
Bob Loblaw @132, the 32 W/m^2 is the CO2 contribution to the net difference between surface upward longwave radiation and top-of-atmosphere upward longwave radiation, and hence its contribution to the total greenhouse effect as measured at the TOA. As such, KR's account of the situation is accurate. I initially skimmed your post and did not pick up that your account differed from that of KR and myself. As previously noted, the estimate of Kiehl and Trenberth (1997)given in the intermediate article has since been superceded by the estimate given by Schmidt et al, (2010). -
Composer99 at 07:27 AM on 10 January 2013Observed Warming of the Ocean and Atmosphere is Incompatible with Natural Variation
From the OP:So how do greenhouse gases accomplish this ocean heating? This is discussed in this SkS post, but briefly; greenhouse gases radiate heat (longwave radiation) back toward the surface and, although they cannot penetrate into the ocean itself, they warm the uppermost surface of the thin cool-skin layer. The thermal gradient in this [the cool-skin] layer dictates the rate of heat loss from the (typically) warmer ocean surface, to the cooler atmosphere above. When greenhouse gases increase, more longwave radiation is directed back at the ocean surface, which warms the cool-skin layer, lowers the thermal gradient, and consequently reduces the rate of heat loss. The sum effect is that the oceans trap more of the sun's energy and therefore warm over time. [Emphasis mine.]
Correct me if I am wrong: the thermal gradient in question is the gradient between the cool-skin layer and the ocean layers beneath it, correct? Could the paragraph cited be amended slightly to include this added precision? Personally speaking I feel the passage is ambiguous with regards to which thermal gradient is being reduced (especially since a warmer cool-skin ocean layer would have, as far as I am aware, a stronger thermal gradient with the atmosphere). -
Daniel Bailey at 07:19 AM on 10 January 201316 ^ more years of global warming
Nice job, Kevin! -
dana1981 at 07:18 AM on 10 January 201316 ^ more years of global warming
Super cool video guys, great job. Hopefully it gets spread far and wide to a large audience! -
Tom Curtis at 07:13 AM on 10 January 2013Water vapor is the most powerful greenhouse gas
AlanSE @132, as noted by Bob and KR, the 32 W/m^2 is the total strength of the greehouse effect from CO2, whereas the 8 W/m^2 is the change in the total strength of the greenhouse effect as atmospheric concentration increases from 278 to 1000 ppmv. I notice in reading the graph from Science of Doom, you use the highest estimate of radiative forcing (IPCC 1990). Subsequent to the publication of the IPCC first and second reports, Myrhe showed that models where then overestimating the forcing from doubling of CO2. The correct value is 6.85 +/- 0.68 W/m^2 for an increase in CO2 from preindustrial levels to 1000 ppmv. Further, since the intermediate article above was last updated, Schmidt et al, (2010) (PDF) have come up with a more accurate estimate of the all sky CO2 contribution to the GHE of 29.5 W/m^2 for 1980 concentrations. That will have increased by 0.8 W/m^2 since then, to 30.3 W/m^2. A further increase of CO2 concentration to 1000 ppmv will increase the CO2 contribution by 5.0 W/m^2 relative to 2010 levels, taking the total CO2 contribution up to 35.3 W/m^2. It should be noted that most of the non-CO2 contribution to the total greenhouse effect comes from water and clouds, which would largely disappear from the atmosphere given a lack of CO2, and hence constitute a feedback rather than a forcing. I should also add that while the formula given by KR above is accurate for calculating change in forcing for levels of CO2 found in the atmosphere over the last 600 million years, but becomes inaccurate for very low levels of CO2 and so cannot be used to calculate the total contribution. -
Water vapor is the most powerful greenhouse gas
AlanSE - The 32 W/m^2 value is for the difference between no CO2 at all and current values. 8 W/m^2 is for two doublings of CO2, with a logarithmic effect, estimated at: ΔForcing = 5.35 W/m^2 (ln [CO2_new/CO2_previous]) or ~3.7 W/m^2 per doubling of CO2. So these are indeed two different numbers for two different situations. The ΔF of 0ppm -> 390ppm does not equal the ΔF of 250pp -> 1000ppm, in particular since at low concentrations of a greenhouse gas (near zero) it will have a linear rather than logarithmic effect.Moderator Response: [DB] Fixed link. -
Bob Loblaw at 05:59 AM on 10 January 2013Water vapor is the most powerful greenhouse gas
AlanSE: Took a bit to find the 32 W/m^2 - it in the intermediate version of the rebuttal, which disappears when you go to the third page of comments. ...but to answer the final question you have: yes, they are different things. The 32 W/m^2 value refers to what is coming back down to the surface from the atmosphere. The other numbers (8 W/m^2 for 1000ppm CO2 - you'll also see other references that mention about 4 W/m^2 for doubled CO2, i.e. 600ppm) refer to the change in flux at the top of the atmosphere (i.e. the exchange with space). It is this latter value that creates the imbalance that leads to global warming - reduced losses to space require a warmer system to restore balance with absorbed solar. The failure to distinguish between surface fluxes and top-of-atmosphere fluxes is a common error. -
william5331 at 05:50 AM on 10 January 2013Observed Warming of the Ocean and Atmosphere is Incompatible with Natural Variation
As mentioned, the oceans are mainly warmed by short wave radiation (light) penetrating and being absorbed by the water. Hence, the amount of cloud cover is a very significant factor in how much ocean warming we will see. Clouds are seeded, to a significant extent by the dimethyl sulphide release by marine phytoplankton. What happens when the overturn of the ocean is decreased as the Arctic Ocean becomes more and more ice free. Phytoplankton production decreases and with it, cloud seeding. Will we go into a period of cloudless heat waves punctuated by very strong hurricanes when surface water becomes so warm that such storms are inevitable. In the present transition period, the ocean overturn should be stronger, if anything, as a lack of insulating ice cover allows very fast freezing of Arctic waters in the fall. At some point, though, so much heat will be absorbed by the Arctic ocean that the total amount of ice created each winter will plummet. -
dana1981 at 05:44 AM on 10 January 2013Temperatures Continue Up the Escalator
Note also that we've got some excellent posts on this very subject that will be posted in the next day or so. Stay tuned. -
dana1981 at 05:43 AM on 10 January 2013Temperatures Continue Up the Escalator
I do agree that ENSO amplified surface warming in the '90s and dampened surface warming in the '00s. That's why we look at long-term trends rather than these short-term 'steps' which contain a lot of noise. As KR @45 notes, this discussion is a great demonstration of the Escalator. -
AlanSE at 05:43 AM on 10 January 2013Water vapor is the most powerful greenhouse gas
Near the beginning of this article it gives "carbon dioxide contributes 32 W/m2" But that's not right, is it? I looked at the paper, and yes, the numbers are in there. But just a cursory look at what else is out there gives different information. http://scienceofdoom.com/2010/02/19/co2-an-insignificant-trace-gas-part-seven-the-boring-numbers/ This data is extremely straight forward and extremely well quantified, but they give 8 W/m^2, even at 1000 ppm of CO2. No where near 30 W/m^2. So what's going on? Are these two sources reporting figures that represent different things? -
shoyemore at 05:39 AM on 10 January 2013A Brief Note on the Latest Release of Draft IPCC Documents
Lars & CBDunkerson, #7 & #8 Here is another example. The removal of lead from petrol has had a remarkable spin-off - about 50% of the decrease of violent crime in urban areas since the 1970s can be statistically ascribed to reduction in lead poisoning. Kevin Drum: America's Criminal Element: Lead Just this year, Tulane University researcher Howard Mielke published a paper with demographer Sammy Zahran on the correlation of lead and crime at the city level. They studied six US cities that had both good crime data and good lead data going back to the '50s, and they found a good fit in every single one. In fact, Mielke has even studied lead concentrations at the neighborhood level in New Orleans and shared his maps with the local police. "When they overlay them with crime maps," he told me, "they realize they match up." Can you imagine how this would have gone if the connection had been made BEFORE the lead ban? As it was, the industry fought the EPA regulations that brought about the change, and of course had their own tame scientists to back them up. -
Temperatures Continue Up the Escalator
While the discussion with Klapper has been entertaining (not), it is an incredibly clear demonstration of the very denial meme that the Escalator graph illustrates. A trend (particularly of a cherry-picked short term) isn't significant, isn't proven, isn't "real", unless there is enough data to separate either the longer term warming trend or the null hypothesis from the noise. Claims to the contrary indicate (IMO) ignoring statistics in favor of beloved talking points. And yet 'skeptics' repeat this myth, over and over again ad nauseum, claiming significance where it doesn't exist. The Escalator graphic is a fantastic, readily comprehensible debunking of the myth, and SkS is to be complimented for it. -
Bob Loblaw at 05:08 AM on 10 January 2013Temperatures Continue Up the Escalator
Klapper (at various points): "I didn't argue the latest 15 year trend was statistically significant" ...and therefore you are admitting that you have no justification for claiming that it is "real". "they [AOCGCMs] are "tuned" to replicate the warming from 1975 to 2000 via feedbacks as if it is solely due to GHGs" ...balderdash. Climate modelling does a very serious job in trying to include known significant forcings. What is your source for this claim? Whatever it is, you need to find better sources. "I think my other point in posting here is to show your community that skeptics are not the simpleton thinkers they are made out to be on this forum." ...you are not doing a very good job at this, either.Moderator Response: [DB] Unless Klapper has new evidence passing statistical significance testing, this matter is now closed, as it detracts from the OP of this thread. Thanks to all participants for your efforts. -
Philippe Chantreau at 05:02 AM on 10 January 2013Temperatures Continue Up the Escalator
This is a case of DNFTT. For fun we could also pick the 15 years periods with very high warming, there are quite a few. The same endless "conversation" happened with R.P. Sr. on the same subject, and he evaded every pointed question on significance. The way to treat these data are well known and when you do that, you obtain what the escalator shows. It's quite simple. Klapper's distraction is a pile of BS, just like R.P. Sr.'s argument. The issues of statistical significance and cherry picking of end points have been analyzed to death. Klapper's nonsense has been adressed adequately. Until he has something interesting to say, he should be ignored. -
Dikran Marsupial at 04:32 AM on 10 January 2013Temperatures Continue Up the Escalator
Klapper Whether you are aware of it or not, you are making exactly that claim when you say "My point is that the flattening in temperature growth is real". If you want to claim that the flattening is real (rather than being merely an artefact of the noise), you need to show that the observed trend is statistically inconsistent with the underlying rate of warming having remained the same, and the difference being down to noise. You have not done so, so you should not be making the claim. -
Klapper at 04:28 AM on 10 January 2013Temperatures Continue Up the Escalator
#30 Bob Loblaw #32 DSL #33 Dikran ....statistical significance.....I didn't argue the latest 15 year trend was statistically significant (not for SAT anyway), however as this warming pause gets longer it may become so soon.Moderator Response: [DB] At this point, per Dikran's and Philippe's summary comments below, this issue is now closed. Barring statistical significance testing by you for support, subsequent such claims by you will be moderated out due to "sloganeering". -
Rob Honeycutt at 04:16 AM on 10 January 2013Temperatures Continue Up the Escalator
Klapper... At risk of running off topic here, I would suggest that the reason those terms get used here frequently is because we are dealing with a wide range of people rejecting the scientific consensus on anthropogenic global warming. We address people who flat out reject the greenhouse effect. We address people who think CO2 is not a well mixed gas in the atmosphere. We address people saying that all the temperature records are doctored (except when they find something in the data that supports their preferred position). I could go on and on. There is skepticism inherent in the scientific process. SkS works hard to address the places where people are claiming to be "skeptical" but are, in fact, only working to reject the overwhelming scientific evidence. Those are fake skeptics, and in more extreme cases, deniers. (I can't think of any other way to accurately characterize someone who flat out rejects the radiative properties of CO2 other than to say they are in denial.) -
Rob Honeycutt at 04:02 AM on 10 January 2013Temperatures Continue Up the Escalator
John @ 37... That's what I'm continually pointing out to skeptics. Where is the statistically significant cooling trend? Don't give me this "flat temps" stuff. Where is the actual cooling? Even the "mid-century cooling" trend from 1940 to 1970 is not statistically significant: GISTEMP -0.015 ±0.051 °C/decade (2σ). -
Klapper at 03:51 AM on 10 January 2013Temperatures Continue Up the Escalator
#28 Dana1981 My point is that the flattening in temperature growth is real. The Met Office prediction to the end of 2017 just recently published shows more sluggish growth. You make the point that all natural factors are working against warming right now. It is true that the average MEI is negative since 2000 or so which would suppress temperature growth (average about -0.1). It was also more strongly negative from 1950 to 1975 or so (-0.3). However, it was strongly positive from 1975 to 2000 (+0.4). Consider the possibility that if warming is being now suppressed by ENSO, it was being aided by ENSO in the period 1975 to 2000, so that some part of that warming is not due to GHGs. The problem for the AOCGCM models is that if there is a natural cycle in ENSO, they don't know about it. Therefore they are "tuned" to replicate the warming from 1975 to 2000 via feedbacks as if it is solely due to GHGs. If that is not true they are possibly overpredicting the warming rate going forward. I think my other point in posting here is to show your community that skeptics are not the simpleton thinkers they are made out to be on this forum. There should be room for alternative interpretations without generating the "fake skeptic/denier" type of name calling. -
Kevin8084 at 03:10 AM on 10 January 2013Putting an End to the Myth that Renewable Energy is too Expensive
Pretty good post in terms of debunking ALEC. Ali TT (#33) makes some very good points. I'd add that the analysis overlooks the fact that retail prices vary dramatically throughout the U.S. depending on the market structure -- about half the states operate in a deregulated wholesale power market where prices are set by the marginal unit(highest cost unit needed), the other half operates a "traditional" cost of service market where prices are set to pay for the entire built system. So Heartland's analysis is not valid, but the rebuttal could be stronger if it included this fact. Re CCS, in terms of meeting steep reduction targets, there is a lot of well regarded economic analysis which has looked at the least cost pathway to decarbonize the energy system. CCS nearly always shows up as a necessary component of this. In a system which uses a carbon price to provide the incentive, the cost of CCS has a large impact on what the market price of emissions would be. Expensive CCS, high carbon price. Cheaper CCS, lower carbon price. The reason for this is that the models, which include the cost impact of investment and operation of various technologies on the entire system, deploy some CCS before other techs (like electrification of vehicles for example). These models now show that CCS would also be installed on generating units that use natural gas. The reason the Southeast doesn't have renewable policies, beside the politics, is that their resources aren't that great and the cost issue is important to them. They don't have good wind and solar isn't fantastic -- too many cloudy/overcast days. Check out a solar insolation map for the U.S. Unlike Germany, with a very poor solar endowment, they care a lot about having low costs power. I rely on this site for good science. There is a wealth of peer-reviewed, high quality energy and economic analysis out there done in the context of a low-carbon mitigation strategy. Check out work by folks at MIT, RFF or even EPRI to start, which can lead you to other good research. Back of the envelop analysis as we have in this post is fine when pressed for time, but there is some well developed energy/economic research you can use as well. -
Bob Lacatena at 03:09 AM on 10 January 2013A Brief Note on the Latest Release of Draft IPCC Documents
Actually, Composer, they're more than that. Deniers are demonstrating time and again that they are completely devoid of morals and driven by fanatic ideology. Hacks (CRU). Leaks (IPCC). Impersonations (Monckton). Accusations. Threats. Lies. Personal attacks. Time and again, their actions reek of desperation, but demonstrate a completely amoral approach to the issues. You have to look at people who behave that way, and who demonstrate zero restraint, credibility or civility, and ask yourself, what exactly motivates such barbaric behavior? It's sure not a desire to arrive at the truth, because the only things missing from the denier's list of actions is actual, substantive, defensible research contributing to the understanding of the science. -
Composer99 at 01:09 AM on 10 January 2013A Brief Note on the Latest Release of Draft IPCC Documents
It has become increasingly clear to me that pro/semi-pro climate denialists and their pseudoskeptic enablers among the general public have nothing left but grasping at straws and "a tale / Told by an idiot, full of sound and fury / Signifying nothing." These leaks of IPCC draft documents are just more straw grasping. -
Lars Karlsson at 01:07 AM on 10 January 2013A Brief Note on the Latest Release of Draft IPCC Documents
Apologies for the (fruit-themed) namecalling. I suppose I should leave that to experts like Donna Laframboise (namecalling seems to be her only competence). -
Bob Lacatena at 00:29 AM on 10 January 2013Greenhouse effect has been falsified
high treason, A brief word of advice. "Thought experiments" such as yours often yield "obvious" and "logical" results. This comes in part because it is so easy and obvious, which in turn is because it is able to ignore a lot of inconvenient details, like actually doing the math, or establishing a source of energy. In your case, consider that while compression of a gas may heat that gas, after the compression stops, and the gas radiates its heat away, additional energy is required to maintain that temperature. The simple act of keeping the gas under pressure does not maintain the temperature. Ah ha, you say, but what about the sun? Yes, no matter how you define the system, the sun keeps the planet at an average radiating temperature consistent with the energy absorbed (255K). The problem then becomes, in your model, to determine where the temperature thresholds are, and how the planet radiates energy as a 255K body, while maintaining much higher temperatures at the surface of the earth. Unfortunately, when you actually do the math, you will find that your theory fails. The temperature at the surface would be nowhere near the actual temperatures that we see. Therefore, some other factor is at work. Gee, I wonder what that is? -
Bernard J. at 00:07 AM on 10 January 2013A Brief Note on the Latest Release of Draft IPCC Documents
I'm starting to think that these unauthorised releases might be the best thing for scuppering denialism. What better way to find any little niggle in the report than to have people who are desperate to sink it go through it with a fine-tooth comb. The very fact that all they can come up with (and this includes the Spencers and Lindzens as well as the Watts and the Moncktons) are a few minor insignificances is itself a resounding affirmation of the high quality of the consensus science's work. And if the denialists haven't been able to demonstrate anything serious by the time of formal publication, they are implicitly endorsing all of the science contained therein that they haven't challenged prior to release. Basically, the denialists are on notice. They now have the opportunity to do their worst - if they don't they're screwed, and if all they can come up with is smoke and mirrors, they're still screwed. We'd definitely know if they come up with something resembling a real counter to the consensus science, but so far there's only been that familiar sound... A far better strategy would be to release the best they have a week or so before the official release date, and attempt to hype their 'gotchyas' before the sensible world managed to respond. Now all they'll have is the unsatisfied feeling that they arrived to the party prematurely... -
John Brookes at 23:32 PM on 9 January 2013Temperatures Continue Up the Escalator
"Skeptics" generally say they expect cooling to start soon. So they should be more than happy to take evens for a bet about whether the current decade will be hotter than the previous one. But they aren't. So they don't really believe the warming will stop. They just pretend not to know what is causing it. -
CBDunkerson at 22:48 PM on 9 January 2013A Brief Note on the Latest Release of Draft IPCC Documents
Lars, that quotation is a great example of the complete break with reality at the heart of the climate denial movement. Ozone depletion - When scientists called for action on this it was the deniers who said that fixing the problem would require "forsaking industrialized society". The Montreal Protocol was fought tooth and nail because it would 'destroy the global economy' and 'have no impact'. The protocol passed... the ozone layer has begun recovering... the economic impact was so trivial as to be unnoticeable. Acid rain - Once again, it was the denial industry which insisted the problem didn't exist and could not be fixed without economic catastrophe. Once again the reality is that the 1989 revisions to the clean air act have resulted in a 65% reduction in acid rain and the economic impact nonexistent. Indeed, the extra costs to polluters to prevent both acid rain and ozone depletion is more than offset by the economic benefits of preventing that damage. The net economic impact of solving these problems has been positive. Ditto if we ever get around to putting the brakes on global warming. The claim that environmental problems can only be solved by giving up modern technology, individual freedom, et cetera is a lie that deniers have told themselves so often that they take it as inviolate truth even in the face of observed reality to the contrary. That Laframoise could even write that addressing ozone depletion and acid rain would require the end of industrialized society after solutions to both had been implemented without any such consequence shows just how deeply ingrained this delusion is. -
Dikran Marsupial at 22:35 PM on 9 January 2013Temperatures Continue Up the Escalator
@JasonB note that the SkS trend calculator properly accounts for the autocorrelation, so it is easier to find long periods with no statistically significant trend. For example, GISTEMP gives a statistically insignificant trend from 1996 to present using this method. The jump from "trend is not statistically significant" to the "trend is zero" is indeed invalid. If a trend is statistically significant, it just means that the observed trend would be highly unlikely IF the underlying trend was zero. So if it is insignificant, it just means that it would not be highly unlikely to observe the measured trend IF the underlying trend were actually zero. Note the conditionality, it only allows you to make statements about what you might or might not expect to see IF the underlying rate of warming was zero. Now you could make the subjective judgement (which is not compatible with the ususal frequentist hypothesis testing framework) that if the measured trend is not highly unlikely if the underlying trend were actually zero is equivalent to saying that the measured trend is evidence that it is possible that the underlying trend is actually zero. However, even then, the lack of a statistically significant trend only means that you can't rule out the possibility that the underlying trend is zero, which is hardly a ringing endorsement of the claim being made by the skeptics. -
Esop at 22:29 PM on 9 January 2013Temperatures Continue Up the Escalator
#21 (Dana): Yep, that is the one. Should add 2012 data. -
JasonB at 20:16 PM on 9 January 2013Temperatures Continue Up the Escalator
That's amazing Dikran, I hadn't noticed that you could get such a long stretch before, and it leads right up to the supposed "pause"! 1979 - 1998: 0.110 ± 0.113 °C/decade (2σ) 1979 - 2012: 0.158 ± 0.048 °C/decade (2σ) So in the 19 years prior to the point when global warming supposedly stopped, the trend was not statistically significant but had a most likely value of 0.110 °C/decade; after it supposedly stopped, the trend increased to 0.158 °C/decade and became very statistically significant. Hmm... Of course, the longer trend lies within the uncertainty interval of the shorter trend, so this isn't evidence that it's changed, merely a warning to those who would make the leap from "trend is not statistically significant" to "trend is 0", which is very different. -
Dikran Marsupial at 18:30 PM on 9 January 2013Temperatures Continue Up the Escalator
Klapper O.K., try the trend in GISTEMP from 1979 to 1998, which the SkS trend calculator gives as 0.110 ±0.113 °C/decade (2σ), so there you have a period of about 19 years without a statistically significant warming trend. That shows that there is nothing that unusual about the current "hiatus". Now how about addressing the point of whether any of your analysis provides statistically significant evidence of the modelled trends being inconsistent with the observations, or whether there is statistically significant evidence of a change in the underlying rate of warming. -
Lars Karlsson at 17:27 PM on 9 January 2013A Brief Note on the Latest Release of Draft IPCC Documents
Laframoise -[snip]-. From her silly little book, chapter 24: ”No matter what they said the problem of the moment was – over-population, ozone depletion, acid rain, global warming – environmentalists have long advocated the same basket of solutions. These solutions amount to humanity forsaking industrialized society and a good measure of individual freedom. Apparently the answer is a return to Eden – to a slower, greener, more, ‘natural’ pace of life that embraces traditional values rather than mindless consumerism.”Moderator Response: mod - no name calling please -
Rob Honeycutt at 14:50 PM on 9 January 2013A Brief Note on the Latest Release of Draft IPCC Documents
Terranova... Well, it would even be nice if those who divulged the AR5 information would confess that it was unethical behavior! -
dana1981 at 14:34 PM on 9 January 2013A Brief Note on the Latest Release of Draft IPCC Documents
I don't want to get into a comparison of unethical behaviors. The point is that these leaks are in violation of a confidentiality agreement in a transparently desperate effort to generate controversy where none exists. If contrarians are so eager to see the draft IPCC reports they should just sign up to be reviewers. -
Terranova at 14:25 PM on 9 January 2013A Brief Note on the Latest Release of Draft IPCC Documents
Dana, In your opinion is this more, or less, or not even comparable to Gleick's confessed unethical behavior? FWIW, I agree that if there is a confidentially agreement, it should be adhered to. -
DSL at 14:05 PM on 9 January 2013Temperatures Continue Up the Escalator
Noting all the while that statistical insignificance isn't equal to general insignificance. After all, a trend of .083C per decade is still 20x the rate of Paleocene-Eocene Thermal Maximum warming.
Prev 994 995 996 997 998 999 1000 1001 1002 1003 1004 1005 1006 1007 1008 1009 Next


