


 Arguments


Recent Comments
Prev 996 997 998 999 1000 1001 1002 1003 1004 1005 1006 1007 1008 1009 1010 1011 Next
Comments 50151 to 50200:
-
JasonB at 20:24 PM on 3 January 2013Putting an End to the Myth that Renewable Energy is too Expensive
Doug H, I'm not so pessimistic about our chances of being able to maintain close to our current standards while also raising the rest of the world to something similar for a few reasons, which I'll have to expound on somewhat briefly due to time constraints: 1. We are currently very wasteful with energy, precisely because it is so cheap. There is plenty of scope for improvement that actually has negative cost. 2. People make a big deal about the cost of renewable electricity and the cost of deploying infrastructure but fail to keep things in perspective. The current generating cost of electricity from coal in my state is only about 1/4 of the retail price; the rest is transmission costs, retailing costs, profit margins, etc. Even if renewables were four times as expensive as coal (which they aren't) it would still only double the retail price, and the cost of electricity makes up a pretty small percentage of my overall expenditures as it is. I've been buying free-range eggs for years despite being much more expensive than cage eggs in the beginning; I'm willing to make the same sacrifice with my power.For example, broadacre farming currently relies upon powerful tractors and no replacement for internal combustion engines in such tractors has, as yet, made its presence felt.
Note that many of the largest trucks used in mining and diesel-powered trains have been "hybrids" for decades before the Prius came along — the diesel motor drives a generator that, in turn, drives electric motors that drive the wheels. Electric motors rule! There's no problem making an electric tractor (and, in fact, if it were large enough I wouldn't be surprised if it was electric, just like the trucks and the trains); the problem is energy storage. Hydrocarbons are a great way of storing energy — so great, in fact, that even when electric motors are being used, people are willing to put up with the low efficiency of the internal combustion engine driving a generator just so they can use them with an electric motor. BTW, the problem with hydrocarbons is not the fact that burning them releases CO2; the problem is that the CO2 that is released was sequestered for millions of years, so it is being added to the system. Synthetic hydrocarbons, made from CO2 freshly drawn from the atmosphere, are carbon-neutral. Synthetic hydrocarbons and alcohols are an interesting possibility that would allow us to keep much of our existing infrastructure. Batteries aren't great but they're workable; for years I've been using LiPo-powered helicopters rather than alcohol or petrol powered ones due to the benefits of electric motors in operation. I think there are plenty of reasons to be optimistic about our ability to change without great reductions in living standards if we make the change early enough for the world we are faced with to not be too different to what it is now. What I'm pessimistic about is whether we will choose to do so. -
littlerobbergirl at 19:29 PM on 3 January 2013Putting an End to the Myth that Renewable Energy is too Expensive
Im interested in those two outliers on fig 2 - the high cost one and the high renewables one do you know which states they are? Could be useful as worst and best case examples. -
littlerobbergirl at 19:10 PM on 3 January 2013The Dirt on Climate
Interesting post, nice diagrams, thanks. Interesting point Tom, but could there have been snow falling on permanent sea ice around antarctica at 65 s? Your pic shows loads of ice. -
Doug Hutcheson at 18:54 PM on 3 January 2013Putting an End to the Myth that Renewable Energy is too Expensive
JasonB @ 6, the underlying problem exercising many minds, as I see it, is how to maintain our present life-styles in a low-carbon economy. To my mind, maintaining our life-styles is incompatible with zero emissions, given the state of current technologies. In many cases, adaptation to a low-carbon economy will require us to forgo some of the things we take for granted today. For example, broadacre farming currently relies upon powerful tractors and no replacement for internal combustion engines in such tractors has, as yet, made its presence felt. Thus, broadacre farming will continue to rely on the combustion of liquid fuels: if appropriate liquid fuels cannot be sourced, broadacre farmers will adapt by going out of business. In the same vein, if low-carbon electricity generation becomes intermittent, we will be forced to adapt by not expecting 24/7 delivery of electricity to our homes and workplaces. People who depend upon 24/7 electricity to power their life support systems will adapt by dying. It may sound harsh, but it is the reality of the future we are facing. The question is: can we maintain our current life-styles in a low-carbon economy? The answer is: almost certainly, we can't. Once we accept the reality of a future less convenient than today, we can move past the stumbling block of how to feed, clothe and house 10 billion people by 2050, by realising that a low-carbon future will not be able to sustain a population that large, using presently available technology. Instead of worrying about how to take today's good life into tomorrow, we should be looking at how best to use the more limited energy sources of the future. Deploying nuclear power plants may solve the 24/7 electricity conundrum, but it will not solve the problem of the farm tractor and its ilk. -
andrewfez at 16:52 PM on 3 January 2013Food Security: the first big hit from Climate Change will be to our pockets
Thankee vroomie, villabolo, Mal, Doug, Daniel and anybody i missed for the replies. Based on your replies, it seems that places around 45 degrees latitude are going to be popular. The BBC video mentioned above that showed the forest farming sounds like a good idea; especially if you can substitute chestnuts for rice, regarding carbohydrates. I try to use nuts for breakfast/lunch a few times per week as a substitute for animal protein; I have no idea if that's sensible or not, concerning nutrient substitution. -
JasonB at 16:11 PM on 3 January 2013Putting an End to the Myth that Renewable Energy is too Expensive
Something that has occurred to me in the past is that there are countries like Australia, China, and the US, where the population centres are concentrated largely in the east and the ideal locations for solar thermal (i.e. deserts) lie to the west. The key feature of this, of course, is that peak power demand is often in the late afternoon/early evening, when the solar thermal plants a few timezones to the west will still be generating substantial output (especially with a few hours of storage). The trick is to get that power to the customer. According to Wikipedia there are > 2,000 km HVDC power lines already (two 3 GW lines 2,500 km long are under construction in Brazil); that's more than enough to connect Sydney and Melbourne to some very sunny areas in Australia. :-) -
JasonB at 16:00 PM on 3 January 2013Putting an End to the Myth that Renewable Energy is too Expensive
Doug H, like you, I am fairly ambivalent on nuclear power, neither strongly in favour nor against. What annoys me, however, is the way the nuclear energy proponents misrepresent both nuclear and renewables. For an example of the former, note that they base costs on projected costs [*] of new conventional plants, but base benefits on hypothetical future fast breeders and thorium reactors, which are still a long way off commercial use and have highly uncertain costs. ([*] Never actual costs, of course, because every instance of massive over-runs so far is either a one-off that will never happen again, or the fault of overly burdensome regulations caused by irrational hysteria...) For an example of the latter, there is the land area required (as if that in and of itself is an issue — ignoring the fact that wind turbines can co-exist with other land uses, rooftop solar doesn't require any extra land, and large scale solar thermal is best placed in very low-value land areas), the material required (one popular Australian pro-nuclear site worked out how much steel and concrete was required and then essentially said "Look how much that is, QED" without mentioning that both represented just a few percent of global production capacity), and the intermittency. There is no doubt that large-scale penetration of unreliable power sources creates new challenges to be overcome; however the perfect is often the enemy of the good, and we can scale up penetration quite a long way before it becomes a big issue, all the while gaining the benefits of averted CO2 emissions. If we are expected to believe that all the historical problems with nuclear will be solved if only we start working on them now, then surely the same applies to engineering our grids to work effectively with high penetrations of renewables? The other thing they often overlook is the discrepancy between nuclear supply curves (or, more accurately, flat lines) and demand curves that dramatically reduces the attractiveness at high penetrations; that discrepancy needs to be resolved somehow — historically, using pumped hydro, or through large scale grid interconnects in the case of France — and many of the energy storage solutions that solve the problem for nuclear would also work for intermittent renewables. In the meantime, we have studies from Germany that showed how wind power actually lowered electricity costs (and, interestingly, that anti-wind article at The Conversation even said "Large volumes of wind generation entry have also contributed to a substantial lowering of the South Australian wholesale spot price" but thought it was a bad thing) and a study from California I posted about here before that showed how rooftop solar combined with solar thermal can dramatically increase wind penetration due to the complementary supply curves combined with the flexible output characteristics of solar thermal plants vs coal and nuclear. My view is that we should build wind and solar as fast as we can and let nuclear see if half a century of massive subsidies has managed to make it economically viable on its own yet. By all means subsidise wind and solar to the same degree that nuclear power has enjoyed over the years if you wish to level the playing field. :-) -
chriskoz at 15:59 PM on 3 January 2013Putting an End to the Myth that Renewable Energy is too Expensive
Your cost analysis, Dana, is simplified by the fact that you provide the average costs only. As a side note, I don't knoiw if your actual $ are wholesale or consumer prices. If consumer, then they seem quite cheap, at least comparing to the prices in most AUS states, where I live. The actual cost of electricity producton may vary wildly. The baseload is reliable and cheap. Peak time may be several times more expensive. We know that the technical problem with renewables is ake the as reliable to compete with baseload coal, which is reliable because the techology is well established (100y old) and very cheap because the various externalities including climate change are excluded. I'd like to see some more detailed analysis how renewables compete with baseload coal in both price and reliability. Perhaps solar (either theral or PV) could ultimately become our baseload power if we argree the grids become international (the "daylight" states selling power to "nighttime" states) but I guess that last condition is just in my dreams: I don't even know the feasibility of the power transport over such big distances in the first place. -
Doug Hutcheson at 15:13 PM on 3 January 2013Putting an End to the Myth that Renewable Energy is too Expensive
dana1981 @ 3, to my mind, we should use whatever safe technology we have available, as the cost of not replacing fossil fuels is far more important to our collective futures than the cost efficiency of any one technology. If someone could come up with a demonstrably safe design for nuclear generation, I would be happy to include it in our future energy mix. That is my 'all the above, excluding fossil carbon' approach to future electricity generation. Delay is our worst enemy. -
dana1981 at 14:59 PM on 3 January 2013Putting an End to the Myth that Renewable Energy is too Expensive
GillianB @2 - I added the suggested text. Doug H @1 - at the risk of turning the comment thread into a nuclear power discussion (which I hope doesn't happen, but tends to occur), it's a bit ironic for nuclear power backers to criticize the cost of renewable power, because new nuclear projects always run way over budget and schedule, and often default on their loans at taxpayer expense. I'd support nuclear power if it could be cost-effective, but right now that's not the case. And an individual nuclear plant is so expensive that you have to put a lot of eggs in that high-risk basket. Renewables are a much safer bet. -
GillianB at 12:47 PM on 3 January 2013Putting an End to the Myth that Renewable Energy is too Expensive
Thanks for this excellent summary of key facts. As ALEC is very active at the state level as well as the national level, I suggest a minor edit to the sentence "..and then pass it along to legislators who will introduce and attempt to implement their bills in US Congress" to include State Legislatures as well as US Congress. Cheers... -
Doug Hutcheson at 12:23 PM on 3 January 2013Putting an End to the Myth that Renewable Energy is too Expensive
I have been following an at times vitriolic comment thread at The Conversation, on the topic Wind is no answer if it leads to higher emissions. The premise of the article is that wind generation is intermittent and requires fossil-fuelled backup generation capacity. To my surprise, almost none of the comments attacks the fundamental idea that CO2 emissions are a bad thing. The interesting argument on the comment thread is between pro- and anti-nuclear proponents, with the pro-nuke crowd claiming that renewables are too expensive and their intermittencies create costly engineering problems for the distribution network, so the logical thing is to start a crash programme of building nuclear generators, instead of spending resources on wind, solar, tide etc. capacity. Sadly, by strenuously opposing renewables, the pro-nuke crowd are playing into the hands of the do-nothing, BAU, burn-baby-burn crowd. I'm not sure where I stand regarding nuclear generators. On the one hand, I see the dangers of catastrophic failures, such as happened at Chernobyl and Fukashima. On the other hand, I know that great strides have been made in engineering and safety aspects, as well as the ability of newer designs being able to use spent fuel from earlier designs currently in operation, thus eliminating the dangerous waste products of existing nuclear plants. On balance, I am sceptical of the ability of humanity to rush the building of new nuclear plants, while maintaining the highest standards of safety, so I am uncomfortable with the prospect of rapid deployment. This caution, however, does nothing to solve the problem of renewables having intermittent generation capability. -
dana1981 at 11:47 AM on 3 January 2013Contrary to Contrarian Claims, IPCC Temperature Projections Have Been Exceptionally Accurate
peggy @30 - all projections are based on a certain GHG emissions scenario. In Figure 12 they used the IPCC FAR 'business as usual' scenario discussed towards the top of the post. -
Doug Hutcheson at 11:28 AM on 3 January 2013It hasn't warmed since 1998
Simon @ 243, Bob Carter's Gish Gallop is still worth reading, as an example of faulty reasoning by someone who should know better. His opposition to AGW seems rooted in his politics, rather than in his superior understanding of the evidence. No doubt, this polarised view is being passed on to his students. Sad to see. -
curiousd at 10:50 AM on 3 January 2013Contrary to Contrarian Claims, IPCC Temperature Projections Have Been Exceptionally Accurate
In regards to my comment 29 above, despite John Cook's valient efforts to help me out in cyberspace, my graph still did not plot! This is a polite website but perhaps an "Oh Piffle!" is o.k. However, I was able to post my plot onto http://tinypic.com/r/29faz45/6 -
peggy at 10:46 AM on 3 January 2013Contrary to Contrarian Claims, IPCC Temperature Projections Have Been Exceptionally Accurate
A simple question on the IPCC predictions, in fig.12 for example- do they hold GHG constant or do they also include a social policy prediction? If so, what CO2 level are they designed around? No doubt the answer is in the references, but such critical information should be presented with the predictions. I speak as a casual reader with a PhD in biology. -
curiousd at 10:37 AM on 3 January 2013Contrary to Contrarian Claims, IPCC Temperature Projections Have Been Exceptionally Accurate
In regard to above comments about multiple data sets, perhaps a clearer case can be made to help prove the point by indeed combining many data sets extending over a long time period but then linearizing the expected relationship between CO2 and temperature by plotting aveage temp anomaly versus log base 2 ( Concentration CO2 by year / Concentration CO2 in 1850). I have used the averaged temp anomaly since 1850 in the SKS temperature trend calculator to do this, including CO2 from Law Dome data plus Keeling. Then I performed this linearization. Here is the result: The statistical analysis of my data processing program shows that an uncorrelated relationship between these variables has a probability of less than 1 in 10,000. The R value is strong at 0.91
Moderator Response: [DB] Fixed image.
The statistical analysis of my data processing program shows that an uncorrelated relationship between these variables has a probability of less than 1 in 10,000. The R value is strong at 0.91
Moderator Response: [DB] Fixed image. -
Tom Curtis at 07:45 AM on 3 January 2013The Dirt on Climate
To raise the obvious point, glacials (by current understanding) commence when weak Northern Hemisphere summer insolation fails to melt the winter snows, thus leaving high albedo snow cover throughout the summer. That snow cover then accumulates to form ice sheets; but it is the high albedo during the period of maximum NH insolation that reduced global temperatures. The mechanism does not work in the SH for the simple reason that, in the relevant latitude, snow in the SH falls into the ocean where it simply melts. As a result, NH, not SH insolation drives the transitions between glacial and interglacial - a point acknowledged by Hao et al by their use of June insolation at 65 degrees North to indicate the likely onset and termination of glacials (figure 3). Prima facie, this mechanism is inconsistent with an increase of Antarctic glaciation preceding an increase in NH glaciation. Given that ice sheet extent in Asia was very limited due to arid conditions (see diagram below), it seems far more probable that delay in onset of winter monsoon dominance is a regional effect rather than a hemispheric effect, ie, that it is not indicative of the timing of NH glaciation.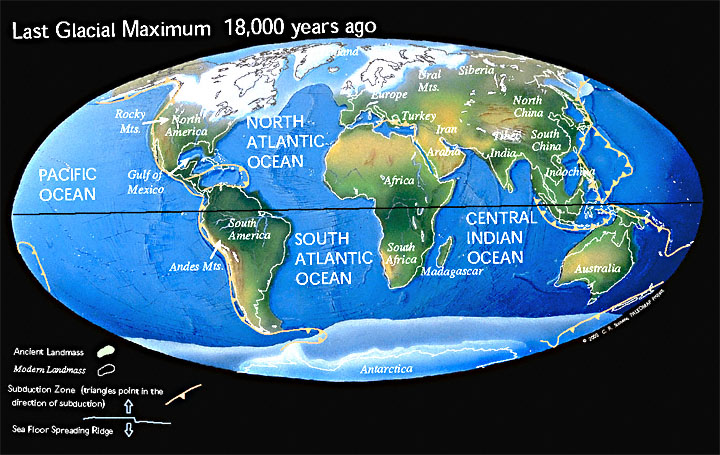 Of course, there may be some odd effect here picked up by the climate models and loess, but we need significantly more detail to assess it.
-
Andy Skuce at 03:16 AM on 3 January 2013The Dirt on Climate
Thanks for this informative post, jg. And great diagrams, too! -
Simon8049 at 22:33 PM on 2 January 2013It hasn't warmed since 1998
The link to Bob Carter's Telegraph article no longer works. It has moved to: There IS a problem with global warming... it stopped in 1998 -
JasonB at 15:49 PM on 2 January 2013Arctic Sea Ice Extent: We're gonna need a bigger graph
This has always struck me as a bizarre complaint. Spend any time on WUWT and you'll see numerous posts positively dripping with hatred towards those who dare try to present data in a graph with a scale they disapprove of. Isn't that why the values are shown on the axes? Even Excel, the fake sceptics' statistical analysis tool of choice, defaults to automatically adjusting the axes values to best fit the data when you use it to create a graph. And why stop with the Y axis? Surely the X axis should start at "0", too? Let's see, instrumental record ~150 years, X axis scale ~14 billion years, you'd need a sheet of paper 4 km long to have the entire instrumental record represented by a single pixel at 600 dpi on that graph. :-) -
Bernard J. at 15:15 PM on 2 January 2013It hasn't warmed since 1998
DB at #238. Thanks for the tweak. I'm not sure what the issue is with my addie - I tried mailing it from my institutional address, and there was no problem. I shall have to remain intrigued, and wondering... ;-) -
Bernard J. at 15:12 PM on 2 January 2013Food Security: the first big hit from Climate Change will be to our pockets
That's torn it Daniel - there'll be a rush on now. You might want to ask the moderators to deleted the pot! ;-) -
villabolo at 13:23 PM on 2 January 2013Food Security: the first big hit from Climate Change will be to our pockets
@35, Thanks for the link Daniel. -
Daniel Bailey at 11:04 AM on 2 January 2013Food Security: the first big hit from Climate Change will be to our pockets
Like all things with real estate: it depends on the location. Acreage with frontage (inland lake or Lake Superior) costs more. As do more "urban" parcels (by most standards, even cities in the UP are not "urban"). A quick search brought up this site where one can find a specific parcel more to their liking. Cheaper parcels seem to run between $4,000 and $6,000 per acre. Frontage...varies. But the views are spectacular... -
villabolo at 10:23 AM on 2 January 2013Food Security: the first big hit from Climate Change will be to our pockets
Daniel Bailey @#32: "And by urban standards, land is quite cheap right now. And there's over 600 square miles of it." Daniel, how much per acre? -
Rob Honeycutt at 10:15 AM on 2 January 2013Arctic Sea Ice Extent: We're gonna need a bigger graph
As an example of Tom's point, go look at pretty much any graph of the Dow Jones Industrial Average or the NASDAQ for the prior, say, 24 month. You will never see such a graph starting with zero. Go to Google Finance and experiment with different time periods. The Y axis will automatically scale with the range being displayed. If you don't do this then, as Tom says, you run into troubles trying to discern any changes. -
villabolo at 10:07 AM on 2 January 2013Food Security: the first big hit from Climate Change will be to our pockets
Doug H. #31: "Wherever you go, be sure to arrange strong defenses against those gun-toting desperadoes who would try to take your safe place away from you by force. Remember, if the climate changes as projected by models, the bad guys are going to be migrating to more comfortable climes, along with everybody else. This time around, the meek are unlikely to inherit the Earth." Well put, but individuals and family groups will be insufficient to arrange a strong defense against roving gangs. If we are to survive we need to organize in eco-villages/Arco-Santi like communities. 500 or more people, in a cohesive community, will allow for maximum efficiency of horti-permaculture as well as self defense. I suggest networking with such survivalist like minded people for a possible future relocation. A sense of community is of utmost importance. -
Tom Dayton at 05:00 AM on 2 January 2013Arctic Sea Ice Extent: We're gonna need a bigger graph
No, william, it is neither necessary nor desirable to always start the graphs at 0. Scaling should be appropriate to the purpose of the graph's readers. If you want to maximize the readers' ability to discern changes in the graph, you should make the graph fill the space as much as possible. {...snip...}Moderator Response: [KC] Inflammatory snipped -
william5331 at 04:41 AM on 2 January 2013Arctic Sea Ice Extent: We're gonna need a bigger graph
The Y axis on ice extent and ice volume graphs should always have started at 0. {...snip...}Moderator Response: [KC] Inflammatory snipped. -
Tom Dayton at 02:00 AM on 2 January 2013It hasn't warmed since 1998
Punksta, even based purely (and therefore inappropriately) on statistics, the +0.14 C trend of the last 16 years is the most likely "true" value--the expected value. 0 is not the most likely value. Nor is +0.13, nor is +0.15. But trend values close to +0.14 are more likely to be the "true" value than trends far from it are. Statistical significance merely provides one estimate of the probabilities of those different trend values. Nor is there anything magical about the 95% confidence level; it is merely a traditional value. The 94% confidence level encompasses only values closer to the 0.14 most likely value. Statistics does not dictate what the confidence level should be. The situation outside of statistics dictates that. If you must make a decision based on your best estimate of the true value, you must weigh the costs and benefits of acting based on the several incorrect and correct decisions you might make based on that best estimate. You leaven those costs and benefits with the probabilities of the various errors and correct decisions. But even if you do make such a sophisticatedly thorough judgment, you are a fool if the statistics are the only knowledge you use to make your decision. Knowledge of physical processes such as causality, and a plethora of other factors, should be even more important in your decision. Statistics is merely one tool in a very large scientific toolbox. This failure of pure statistics to provide clear answers is not at all unique to climatology. I used to do massively complex ANOVAs in a completely different field, and usually had difficulty dissecting the complex relationships because the component, less complex statistical tests rarely were significant at the same probability level for them to logically support the overall, complex test. In other words, a naive perspective on the entire set of tests would be that they were internally inconsistent and therefore nonsensical and impossible. That's a similar phenomenon to what folks here have pointed out to you: Often all the short time intervals fail to reach significance at the same probability level as the longer time interval. That's why real scientists do not base their judgments solely on statistics, and even to the extent that they do rely on statistics, they do not rely on a naive, high school level of statistics. -
Tristan at 00:18 AM on 2 January 2013It hasn't warmed since 1998
Neat image Bernard! -
Bernard J. at 23:19 PM on 1 January 2013It hasn't warmed since 1998
I should probably explain the approach that I used to determine the intervals I derived for the post above. All I did was enter various start years until I obtained for each of the end years a minimum-sized interval where there was no way to describe a negatively-sloped line through the whole range. It's not the best way to derive the info, but it was quick and it's a good approximation and I didn't want to waste time with something that has been debunked countless times in the past. -
Bernard J. at 23:13 PM on 1 January 2013It hasn't warmed since 1998
Punksta seems to come from a long, long, long line of denialists who are ignorant (often deliberately so...) of the fact that a minimum amount of time is always required to be able to identify a signal emerging from inherently noisy data. I have two points, in addition to the many others made above, to put to this person. The first is an exercise in thinking (yes, I am being optimistic...): 1) If there had been no "statistically significant" warming for twelve years, does this disprove a relationship between CO2 and warming? If there had been no "statistically significant" warming for ten years, would this disprove a relationship between CO2 and warming? Five years? Two? What is the basis for claiming that there is no relationship between CO2 and planetary warming? 2) using the trend calculator to which many people have directed Punksta, I constructed a graph showing how many years prior to a particular year are required to identify a statistically significant warming trend at the 2 %sigma; (~95%) level. It's quick and dirty - I didn't muck around with the autocorrelation period and I only used GISTemp - but it's enough to demonstrate for any year in the last three decades how many years of prior data was required to observe a "statistically significant" warming trend. The graph itself shows two further things:
1) there is nothing unusual about the current period required to identify statistically significant warming - indeed, over all there is a trend to the period becomng shorter.
2) prior to 1981, the post-World War II hiatus (significantly attributable to aerosols) triples the period required to identify warming. However, there was warming occurring then too, but it was being compensated for by other factors. This did not alter the physics of greenhouse gases though, and the same is the case today - CO2 is still warming the planet.
[I apologise for thumb-nailing the image. Try as I might, my efforts to use the width tag would not produce a visible graph.]
Moderator Response: [DB] Improved image width. Bernard, I tried to email you the proper image width code but the message proved undeliverable.
The graph itself shows two further things:
1) there is nothing unusual about the current period required to identify statistically significant warming - indeed, over all there is a trend to the period becomng shorter.
2) prior to 1981, the post-World War II hiatus (significantly attributable to aerosols) triples the period required to identify warming. However, there was warming occurring then too, but it was being compensated for by other factors. This did not alter the physics of greenhouse gases though, and the same is the case today - CO2 is still warming the planet.
[I apologise for thumb-nailing the image. Try as I might, my efforts to use the width tag would not produce a visible graph.]
Moderator Response: [DB] Improved image width. Bernard, I tried to email you the proper image width code but the message proved undeliverable. -
Daniel Bailey at 12:48 PM on 1 January 2013Food Security: the first big hit from Climate Change will be to our pockets
Well, I'm reluctant to mention it (because I don't want to make it a target destination), but the Keweenaw Peninsula portion of the Upper Peninsula (UP) of Michigan would make an excellent long-term destination. Connected to the mainland portion of the UP via the lift bridge at Houghton/Hancock, the Keweenaw (also called Copper Country) is separated from the "mainland" UP by a natural "moat" and (counting Lake Superior) is completely surrounded by fresh water. The climate is harsh still in winter, but continued warming will greatly lengthen the growth season, fresh water is virtually inexhaustible, it's defensible (just drop the bridge and it's an island), it has abundant forest and farmlands and there's still copper and other ores (albeit deep) in the ground. Basically, one of the few areas in North America that figures to have its climate improve over the next couple of centuries: winters will grow milder, with snow becoming less of an issue [the record is 390" in 1979] and even less common [about 24" thus far this winter]; summer heat will still be ameliorated by the enormous thermal inertia of the big lake. And by urban standards, land is quite cheap right now. And there's over 600 square miles of it.
-
Doug Hutcheson at 12:42 PM on 1 January 20132012 in Review - a Major Year for Climate Change
Regarding Whitehouse, how refreshing it is to see a politician telling the plain, unvarnished truth! Tony Abbott and the Australian Tea Party wannabes, are you listening? (Cue sound of crickets ...) -
Doug Hutcheson at 11:51 AM on 1 January 2013Food Security: the first big hit from Climate Change will be to our pockets
andrewfez @ 25, you asked "Where do you guys think the 'best' place in America is going to be to survive/thrive at around 2050?" Wherever you go, be sure to arrange strong defences against those gun-toting desperadoes who would try to take your safe place away from you by force. Remember, if the climate changes as projected by models, the bad guys are going to be migrating to more comfortable climes, along with everybody else. This time around, the meek are unlikely to inherit the Earth. -
Mal Adapted at 11:33 AM on 1 January 2013Food Security: the first big hit from Climate Change will be to our pockets
Vrooomie:I'll say an area centered roughly around Bend, OR: decent glacial soils, reasonably temperate, year-round, and good precip.
Hmmm, Bend's climate makes agriculture challenging, on account of a pretty short growing season (90 days is optimistic), and not enough moisture without irrigation. It will get warmer, but it may or may not get wetter. Precipitation models currently show wetter winters, drier summers in that area. Having lived in the inland PNW, I'd pick Moscow, ID or Cle Elum, WA myself. -
dana1981 at 11:01 AM on 1 January 20132012 in Review - a Major Year for Climate Change
It's a travesty that a senator named Whitehouse isn't in the White House! Especially given that he's one of the few American politicians who understands and is willing to speak out about the biggest threat we face. -
chriskoz at 10:54 AM on 1 January 20132012 in Review - a Major Year for Climate Change
I'll start the first comment in 2013 on the positive note: I've heard voices "senator Whitehouse for whitehouse". I sincerly wish those rumors (sic!) were true and Whitehouse won in 2016... I clearly see Obama accepts the science but he is too affraid (or maybe disempowered/corrupted) to act on it. But from the video of Whitehouse's great (perhaps historic) speech, we must say he wouldn't be affraid to act strongly and perhaps vindicate US to the leading position in GW mitigation. -
John Mason at 09:33 AM on 1 January 2013Food Security: the first big hit from Climate Change will be to our pockets
Commiserations to all growers too! I couldn't reach my garden today - half a mile of raging floodwater stood between me and it. A slug-free New Year to you all, those of you I know and do not know. Best wishes - John -
padruig at 08:04 AM on 1 January 2013The Y-Axis of Evil
While compressing or expanding an axis (as well as clipping and truncating data sets) is an old tactic frequently used in advertizing. When I see this, I just get out my red pencil and shift into 'peer review' mode. Typically, published journal articles do not present results in absolute temperatures but instead compare temperature to an average datum period which variance from is considered an anomaly. These average periods, in the US are from 1961-1980 and in the UK and Australia is 1961-1990, are intended to even out seasonal influences as well as the larger periodic cyclic processes such as ENSO (El Nino Southern Oscillation) and the AO (Arctic Oscillation) Comparing temperature anomalies gives a bit more value in making comparisons and it also makes the statistical hurdles a bit less challenging. As a point of reference here in the United States, most of our meteorological services are provided by NOAA and the National Weather Service. These agencies along with DoD, NASA, GISS, NFS, NPS, BLM are just a few of many agencies conducting climate studies as these changes affect our policy making. -
SoSethSays at 06:41 AM on 1 January 2013The Y-Axis of Evil
By the way, the source of the graph is NOT from the US Bureau of Meteorology that D. B. claims; it is quite evidently (by the domain) from the Australian Bureau...and shows a rising graph in any scale.Moderator Response: [DB] Note that the chart depicted in Fig 1 itself notes that it is derived from US Bureau of Meteorology data, NOT from a reproduced work originally from the US Bureau of Meteorology. -
Nick Palmer at 06:07 AM on 1 January 2013Contrary to Contrarian Claims, IPCC Temperature Projections Have Been Exceptionally Accurate
The degree sign on a PC can be got by using alt 167 ºººº -
CBDunkerson at 04:43 AM on 1 January 2013Misleading Daily Mail Article Pre-Bunked by Nuccitelli et al. (2012)
Punksta, you're treating '16 years without statistically significant warming' as if it means there has been little or no warming. It doesn't. It means the time period chosen was too short to prove statistical significance. You acknowledge that the 30 years prior to that showed warming... but there were numerous 16 year periods within that 30 year duration which did not show statistically significant warming. Thus, the current 16 year 'hiatus' as you call it could be part of an unchanged warming trend. Indeed, the past 30 years (including that 16 year 'hiatus') do show statistically significant warming. So do the past 20 years. Choosing a time period too short to establish a statistically significant trend and then arguing that it means anything is inherently nonsense. Show me a statistically significant 'cooling' trend and we'll talk. Chopping the ongoing warming trend to a duration short enough to avoid statistical significance is just flim-flammery. -
CBDunkerson at 04:31 AM on 1 January 2013It hasn't warmed since 1998
Punksta, suppose that air temperatures went up for 30 days in the Spring, but then for the next 16 days there was no statistically significant warming. Meanwhile the oceans continued to warm slightly. Would you argue that this was conclusive proof that the cycle of the seasons was not causing the warming of the oceans or the previous warming air temperatures? This is a direct parallel to your argument 'against' global warming and ought to make clear why it is wrong. There was a study about a year ago that found the minimum period needed to establish a statistically significant trend in global temperatures was about 17 years. They could have saved the effort and noted that 'skeptics' so frequently use 'no warming for 15 / 16 years' to surmise that the boundary must be a year higher. Put another way... there hasn't been a statistically significant 'cooling' or 'flat' global temp anomaly trend since the 70s. -
dana1981 at 04:13 AM on 1 January 2013Misleading Daily Mail Article Pre-Bunked by Nuccitelli et al. (2012)
Punk @73 - your first point isn't wrong because CO2 isn't causing global warming (it is), it's wrong because the greenhouse effect doesn't work by "warming CO2 in the atmosphere". That's not an accurate description of the greenhouse effect. -
villabolo at 03:47 AM on 1 January 2013Food Security: the first big hit from Climate Change will be to our pockets
andrewfez @ #25 "I keep hearing food prices will double in real terms by 2030..." Food prices are likely to double before 2030. That estimate sounds like it based on linear models taking only temperature rise into account. Commodities, however, tend to jump in price in a non-linear fashion e.g. oil prices in 2008. 2020 is when the arctic is bound to get ice free in the summer and the great alterations in weather will affect crops. It's safe to assume that the Arctic meltdown is not included in whatever model was used to calculate those prices. Nor are drenching thunderstorms. -
citizenschallenge at 02:10 AM on 1 January 2013New research from last week 52/2012
Thank you Ari for all the work you've put into this. It is important for folks to have a source of reliable news, when it comes to the steady flow of scientific papers and information. it's been useful and very valuable! Happy New Year -
vrooomie at 01:51 AM on 1 January 2013Food Security: the first big hit from Climate Change will be to our pockets
andrewfez@25: Keeping this focused on food security, and tossing in a bit of geological data to gin up a SWAG about your question? I'll say an area centered roughly around Bend, OR: decent glacial soils, reasonably temperate, year-round, and good precip.
Prev 996 997 998 999 1000 1001 1002 1003 1004 1005 1006 1007 1008 1009 1010 1011 Next


