


 Arguments


Recent Comments
Prev 1003 1004 1005 1006 1007 1008 1009 1010 1011 1012 1013 1014 1015 1016 1017 1018 Next
Comments 50501 to 50550:
-
VictorVenema at 01:48 AM on 27 December 2012West Antarctica warming more than expected
As Tom Curtis @2 already noticed, the legend: "On this map, the color intensity indicates the extent of warming around Antarctica." is wrong. The figure shows the correlations of the measurements at Byrd with reanalysis data as the text at the colorbar states. Anyway, I would interpret this study with care. There were changes in the instrumentation and location, which may cause non-climatic temperature changes. Especially in such a hostile environment. The supplemental information suggests that there were only corrections for calibration problems and drift and that they did not search for inhomogeneities in the data by comparison with neighbouring stations. This may also be difficult as the figure suggests, but does not show, that the station at Byrd does not correlate well with its neighbours. I do not have access to the paper itself, but I would expect that there are thus likely non-climatic changes in the time series. -
John Mason at 01:04 AM on 27 December 2012Food Security: the first big hit from Climate Change will be to our pockets
Good to see I'm not alone in my experiences of 2012. Some people I know simply gave up but I think it's well worth continuing to experiment to see what can take such a mix of conditions. At present, Swiss chard looks a good candidate, once you get the young plants past the most slug-vulnerable stage. Keep the comments coming in, growers! Bernard, you are of course right: history is littered with examples, the Year Without a Summer - 1816 . -
Bernard J. at 00:53 AM on 27 December 2012Food Security: the first big hit from Climate Change will be to our pockets
It would only take a couple of years of this sort of climatological mayhem to be repeated globally for the planet to plunge into serious trouble. Surprisingly few people seem to be aware of what is lurking just around the corner, and at this stage there's a rapidly diminishing range of responses available... -
BWTrainer at 00:46 AM on 27 December 2012Matt Ridley Risk Management Failure Deja Vu
"...although we would still have to take serious steps to prevent human greenhouse gas emissions from rising so much that even a low sensitivity scenario would result in extremely dangerous levels of global warming" I wish this article would've discussed this further (maybe another article?). The deniers conveniently ignore that we're on pace to possibly quadruple atmospheric CO2 levels in the next century, complicated by the potency of methane as we move more towards natural gas, so we're still screwed even with an unlikely low sensitivity. -
Bernard J. at 00:43 AM on 27 December 2012Matt Ridley Risk Management Failure Deja Vu
The only difficulty I can see is that you need to have taken flying lessons to really understand the significance.
A bit like the various sciences associated with climate change, in some ways... -
Bernard J. at 00:40 AM on 27 December 20122012 SkS Weekly Digest #51
William, the problem is that a large part of the inaction that has manifested has originated with the activity of deniers. If fora such as Skeptical Science did not work strenuously to rebut the denial campaign, all that will be left for the rest of us to do will be to "document the changing climate"... -
chris at 23:28 PM on 26 December 2012IPCC Draft Report Leaked, Shows Global Warming is NOT Due to the Sun
col8, taking your paragraphs one by one: 1. Not true. The IPCC has considered all of the scientific evidence on factors having potential to contribute to climate change/warming including all solar contributions that are under study in the scientific community. The significant number of papers published on real and potential GCR effects are all obviously considered in arriving at periodic IPCC assessments as inspection of the references cited in the IPCC reports shows. A major reason for rejecting the CRF effect as relevant for contemporary warming is that the CRF has trended in a slightly cooling direction as temperatures have risen markedly during the last 50 years. 2. You’ll need to provide some evidence for those assertions! There is very little evidence that the GCR component of the solar output is responsible for any apparent correlations between climate-related proxies and solar-related proxies. Since the solar effect of the CRF marches pretty much in lock-step with the other solar variabilities (solar irradiance, sunspot number, solar open flux etc.) any apparent correlation is just as likely to be due to the solar irradiance component of the solar variability. Obviously CRF variability cannot be relevant for contemporary warming since the CRF has trended in a slightly cooling direction as temperatures have risen markedly during the last 50 years 3. The cloud chamber experiments including the CERN CLOUD study have very little to say about the possibility for a GCR effect on Earth climate/surface temperature variability. The fact that high energy particles created in a particle accelerator can induce the condensation of potential nucleating species is not a particular surprising result, and doesn’t have very much at all to say about the possibility that CRF variations in the real world significantly affects cloud formation in a manner that is significant for long term and persistent changes in the climate/warming. 4. Dragic et al.’s data relates to apparent correlations between rare CRF spikes (Forbush Decreases or FD) and diurnal temperature range (DTR) in Europe. At least two groups have subsequently addressed Dragic’s interesting observation. Erlykin and Wolfendale cast some doubt on Dragic’s statistical analyses, but do find some evidence for a 13 day and/or 27 day lagged response of DTR to FD. These authors conclude that these weak correlations are more likely due to solar irradiance changes. There is also the problem that these lags (13 day) are really too long to be related to the putative CRF effect on cloud formation. Laken et al performed an analysis of 60 years worth of DTR and solar activity and found no evidence for the link purported by Dragic et al. Both groups show that some apparent correlation between solar activity (aka CRF but not necessarily so!) and DTR in subsets of data like that of Dragic et al. is likely to be found simply by chance. There are probably more than two dozen related analyses of the potential CRF climate/temperature link. The overall conclusion is that there is no decent evidence for supposing such a link is significant for climate/temperature variation in the real world. One needs to assess all of the scientific data and analyses (that’s what the IPCC do!) rather on relying on the occasional paper that conforms to a preferred view. And one should definitely look at the papers that cite your “preferred” paper, since if something is problematic, it will likely come to light subsequently. 5. But it can’t be significant since the warming of the last 50-odd years has occurred during a period when the CRF variation has been mildly in the cooling direction… 6. Looked at objectively, Svensmark’s “mechanism” has a pretty poor record in fact. etc ... -
CBDunkerson at 22:32 PM on 26 December 2012Models are unreliable
JackO'Fall, setting aside the scientific issues (which others have dealt with extensively) I find your economic argument bizarre on a few different levels. First, you argue that 'fixing a broken window does not improve the economy'. Let's take the situation on a grand scale... hurricanes break lots of windows. You argue that cannot possibly lead to economic improvement... yet reality shows that the reconstruction boom after major hurricanes has greatly benefited local economies time and time again. The same thing has been seen with wars. When the US entered WWII and built all those planes and ships the economy took off. Planes and ships obviously don't inherently improve the economy... indeed, many of them were built to replace others that had been blown up (more 'broken windows'). You argue that giving the people who built the planes and ships (or replaced the broken windows) money cannot possibly result in economic growth... and yet here in reality it has done so time and time again. It's all very well to subscribe to anti-Keynesian / freshwater / Chicago style economics, but you do still need to make an attempt at reconciling these beliefs with reality if you want to be taken seriously. The second big problem with your argument is that it seems to reverse the situation... global warming is the thing which is going to 'break a lot of windows'. Spending money now to prevent that would be the equivalent of putting up shutters to protect the windows. Basically, you're arguing against disaster prevention on the grounds that disasters are bad for the economy... which makes absolutely no sense. Finally, your idea that having money tied up in investments generates greater economic efficiency than having that money circulating through the economy is simplistic and wrong more often than not. Think about it. If 100% of the currency were in investments no one would be able to buy food, gas, housing, et cetera and the economy would collapse over night. If 0% of the currency were in investments then people would go on buying things and the economy would be fine... just with less money devoted to speculation. Between those two extremes the economy suffers proportionally as the percentage of investment goes up. This can be offset if the investment leads to new technologies which grow the economy, but given that the vast majority of investment these days is in financial flim-flammery rather than production of new technology it is really just a heavily rigged form of gambling and a further drain on economic efficiency.Moderator Response: [TD] Please take the economic discussion elsewhere. JackO'Fall already apologized for being off topic. -
littlerobbergirl at 22:20 PM on 26 December 2012Food Security: the first big hit from Climate Change will be to our pockets
Bad news here in se england too: late frost, then drought, heatwave,them months of relentless rain. Zero crop from sqashes, french beans, sweetcorn. Massive losses to slugs, even things like sage were attacked! All potatoes badly affected by blight, even the resistant sarpo varieties got it, where in previous years they got no more than the odd spot on leaves. Crop about half usual. Brassicas from late sowing seriously protected from slugs (for furst time ever i bought pellets) did well but now eaten by hungry pigeons that broke in past the nets. Local crops rubbish: beans stunted and rotting were mulched back on, wheat on the chalk other side of village looked great, on this side on clay pathetic. I dont like this new normal, i planted grapes, olives (dead now) etc expecting mediterranian weather, lulled by a few good years where only prob was drought! Last two winters wading through feet of snow, at moment mud. But it could be worse; russia and ukraine stuck under the high pressure have record cold, hundreds dead already. Having to pump out flooded septic tank small prob in comparison.. Happy new age, all! -
Dikran Marsupial at 21:46 PM on 26 December 2012Models are unreliable
JohnApplied Maths While weather is indeed chaortic, that does not mean that climate (long term statistical properties of the weather) is chaotic. It is straightforward to find examples of this, for instance consider a double pendulum made of iron placed near an electromagnet. We are unable to predict the exact trajectory of the pendulum, but we can predict the effects of the electromagnet, which will bias the mean position of the pendulum. Similarly, while we can't expect to predict the internal variability, we can predict the effects of the forcings (which correspond to the force applied by the electromagnet), and that is exactly what the modellers attempt to do. The thing about quasi-periodic behaviour is that in the long run, it averages out to zero, but the effect of the forcing do not, so there is good reason to think the GCMs will have skill over a timespan long enough for the quasi-periodic chaotic features suce as ENSO to average out. -
col8 at 21:39 PM on 26 December 2012IPCC Draft Report Leaked, Shows Global Warming is NOT Due to the Sun
With regard to whether or not there is significant “Svensmark” contribution to 20th century GW …… The IPCC, in repeated reports, consistently dismissed solar radiance as a factor … correctly …… but has, for 15 years, consistently ignored whether or not Sun varying magnetic field strength has modulated GCR input to Earth, & hence, low cloud cover/Earth temperature. CO2,CH4 (+ feedbacks) getting nearly all the cudos). Historically, the ‘Svensmark contribution‘ to CC has a lot going for it; ‘matching’ numerous (92%) CC events in the past millions of years, including more recent events such as the Ice Ages, the bronze age warming, Roman warming, MWP, LIA, the 35 year period of strong warming in the 1st half of the 20th century (just as strong as the warming in the last 35 years), the ~ 30 years of cooling - 1950-1978 ….. the Sun magnetic field strength again resuming it’s strong 20th century rise in 1978; a rise of > 100% over the last century (& the largest rise in at least the past 1,000 years) ….. but this rise petering out by the late 80’s ….. whilst Earth temperature has continued to increase ….. Thus, the Svensmark’s (partial) explanation of recent GW dismissed! Svensmark’s ‘cloud chamber experiments’ of 1997 & more recently, that showed a GCR connection to cloud formation were ‘poo-pooed’ …… CERN ‘proof’ being required. The long awaited (15 years) CERN #1 experiment eventually carried out last year & showed that GCR’s can indeed facilitate cloud nuclei formation ….. but in no way proving that the ‘Svensmark mechanism’ for CC is particularly relevant to large scale cloud formation/loss & significant effect on Earth temperature. A sigh of relief for the IPCC! However, far more conclusive evidence for Svensmark has come to light. Dragic, et al have taken a simple approach to proving/disproving Svensmark. They have analysed ‘diurnal temperature variation’ for 184 European weather stations over the last 50 years & compared this with 50 years of ‘muon counts’ (measured in Germany) during strong Solar flare events. We all recognise that on any given cloudy day, it’ll be cooler than a clear day, & similarly we all recognise that a cloudy night is warmer than a clear night. Guess what - for strong Solar flares a very strong correlation to Earth cloud cover (intuitively) proved! A few days after a strong Solar flare (lasting a couple of hours) Europe gets 0.38C hotter for a couple of days; after a very strong Solar flare, a couple of days later, Europe is 0.5C hotter for a couple of days. (the observed delay is the period for dissipation of existing clouds & reduced formation of replacement clouds) I have no idea what the correlation of a few hours of strong Solar flare activity producing a couple of days of significantly raised Earth temperature is ….. compared to decades of (100%) raised Sun magnetic field on diminished Earth cloud cover/raised Earth temperature – but i’d presume it to be also significant over most of the last century. Thus, I am reluctant to dismiss the Svensmark ‘mechanism’ for CC which has such a good historical record & is now proven to be an operative mechanism in cloud formation. Setting aside any contribution from CO2,CH4, are we perhaps missing something? We talk about GHG’s referring to (mainly) CO2 & CH4 & bringing in H2O (gas) as a climate forcing agent. Note that H2O as CLOUD is condensed water. CO2, CH4 have discrete absorption peaks which only account for a very small portion of Earth OLR absorption, whilst clouds REFLECT energy, this reflectance being a much, much larger factor in Earth energy balance as it operates over the FULL Earth OLR ….. Perhaps, even a small mechanism that affects cloud formation has a large ‘multiplier’ effect? Why have the World’s oceans, to a depth of 52 metres (at least), been in a cooling trend for two decades? And exhibited a huge thermal uptake & release of heat? – a cyclic temperature variation of 0.25C/11 years; this cycle in temperature far greater than any change in overall Earth temperature during this period & in accord with the Sun’s solar cycle. (SODA data) And why has there been considerably greater heating of just the northern hemisphere in the past couple of decades? & loss of Arctic ice whilst Antarctica has apparently being gaining 49Gt/annum recently, & overall, getting colder? The population & pollution in the northern hemisphere is far greater than in the southern hemisphere (whilst CO2 is the same everywhere). Could it be that settling pollution particles are turbidifying the surface water of the northern hemisphere oceans & thus trapping more Sun energy at the surface (AKA a farmer’s cloudy dam which looks inviting for a dip on a hot day – but is ‘brass monkeys’ when you break through the hot surface water), the top ½ metre or so of the ocean, this hotter water being in contact with the atmosphere & causing it to heat. With the turbid surface water trapping more energy, the Sun’s rays penetrate more weakly, explaining the temperature decline of the ocean over the last 20 years to a depth of 52 metres – roughly the depth of the penetrating power of the Sun’s rays ….. Just some thoughts for comment – whilst I continue to be a ‘fence sitter” -
JohnApplied Maths at 21:30 PM on 26 December 2012Models are unreliable
You boys completely miss the point The Earth's weather system is a chaotic dynamical system which is part of the Solar System which was proven to be a chaotic dynamical system by H.Poincare. A feature of any chaotic dynamical system is that even if it appears to exhibit quasi- periodicity its future behaviour cannot be predicted.Moderator Response: [TD] For additional information beyond Dikran's response, see the Skeptical Science Argument "Climate is chaotic and cannot be predicted." Please make further comments on that topic there, not here. Even if you wish to respond to Dikran's comment, do so there. He will see it anyway, because he like most regular readers monitor the Comments page that shows the union of all comment streams. -
John Russell at 21:04 PM on 26 December 2012Food Security: the first big hit from Climate Change will be to our pockets
I echo everything John says. Our crops have been right down this year; potatoes, beans, peas, courgettes, lettuce almost non-existent: if the wet didn't get 'em, the slugs did. And now we're looking like we'll be hit by Chalara Fraxinea (ash dieback) which is worrying me because I've probably got 30 acres of ash trees in total. The farmers round here in the SW UK (some in their 70s and 80s) tell me they've never known a summer like it in all their years. To cap it all they're now running out of silage for the cattle over the winter because they just weren't able to take enough cuts off the fields this year. And the bad news is that there's nothing to suggest it will be any different in 2013. This is the reality of climate change in the UK. Problem is, most townies -- insulated from the environment -- haven't realised it yet. This is a disaster. -
Tom Curtis at 12:13 PM on 26 December 2012West Antarctica warming more than expected
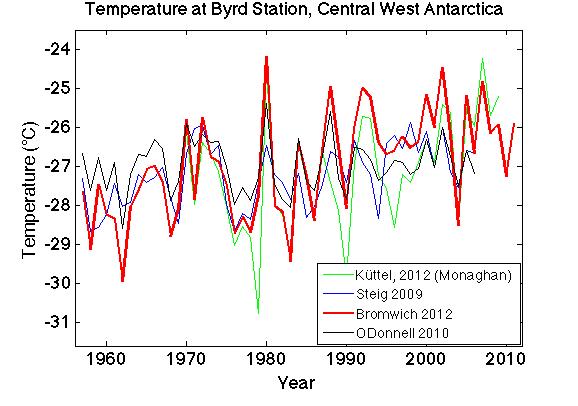
Philip Cohen @1, the map shows only correlation to Byrd Station temperature anomalies. It does not show temperature increases at all. Indeed, when Byrd Station temperatures are falling, bright red portions of the map will also, most probably, be falling as well. In that respect, the caption attached to the map is simply wrong, and contradicts the legend provided within it. William Connolley discusses the BBC's use of the map at Stoat. He also presents the far more useful in his (and my) opinion figure 2 from the paper, which actually shows the reconstructed Byrd Station temperatures: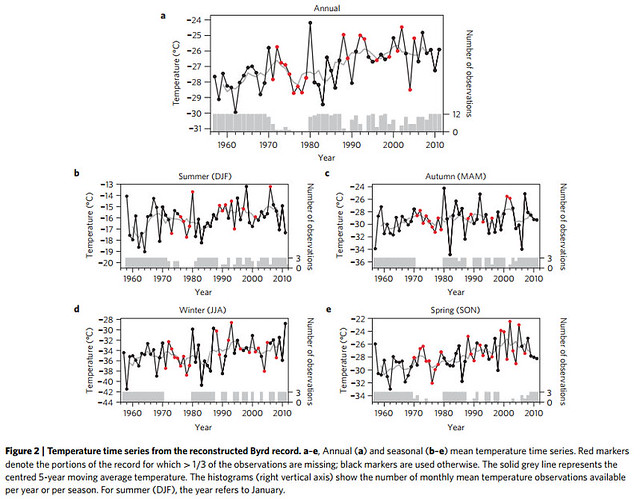 Also of interest, from Real Climate, is this comparison of this reconstruction of Byrd Station temperatures with prior reconstructions:
-
Treesong2 at 09:32 AM on 26 December 2012West Antarctica warming more than expected
Speaking as someone who knows nothing about the NCAR study besides what's here, and couldn't evaluate it even if he read the whole thing, I wonder if the much-processed instrumental record of a single site can bear the weight of the reinterpretation. How can West Antarctica warm so much more than East Antarctic coastal areas that are much further north? Is it elevation? I also don't understand the map. Does the color show temperature (per the caption) or temperature correlation (per the legend at right), and if the latter, what are the units? And why is the Antarctic Peninsula showing up with the dark blue of least warming/least correlation? -
Hans Petter Jacobsen at 09:00 AM on 26 December 2012Solar Cycle Model fails to predict the recent warming
SSH mention briefly that both total solar irradiance, ultraviolett light and cosmic rays change during a solar cycle. They do not highlight any of these processes in particular. The calculations within SSH's Solar Cycle Model are independent of which of these processes that is the strongest. The bottom line is that SSH's model cannot explain the global warming since the mid-1970s, regardless of the relativ strength between these processes. -
dana1981 at 08:44 AM on 26 December 2012This is Global Warming - A Lesson for Monckton and Co.
Ron @55 - NOAA only has pentadal data available for 2000m OHC, except since 2005, so that's all we had to use. The graph ends circa 2009 because that's the average of 2007 through 2011. DK12 were using just 0-700 meter data and focusing on short-term changes (a.k.a. noise) and calling every little bump a 'climate shift'. As you can see from Figure 1, the global energy imbalance (essentially the slope of the graph) isn't decreasing. Estimates of the global energy imbalance may be changing, but that's not the same as the imbalance itself changing. -
John Russell at 04:10 AM on 26 December 2012Matt Ridley Risk Management Failure Deja Vu
Bert #24 It is an excellent analogy. The only difficulty I can see is that you need to have taken flying lessons to really understand the significance. -
Tom Dayton at 00:07 AM on 26 December 2012It's cosmic rays
Update 2012: RealClimate posted "A review of cosmic rays and climate: a cluttered story of little success." -
Tom Dayton at 23:50 PM on 25 December 2012Sun and climate moving in opposite directions, says leaked IPCC report
RealClimate just posted "A review of cosmic rays and climate: a cluttered story of little success." -
Ron King at 23:25 PM on 25 December 2012This is Global Warming - A Lesson for Monckton and Co.
dana 1981 Looking at your paper cited above ref Fig 1, I was interested in why you and your co-authors used pentadal data and why it would make such a difference with DK12 data which you claim is focused on short term noise. note: "Our 0-700 meter result differs from that of DK12 over the 2002-2008 period because we use pentadal data whereas DK12 use quarterly data. This result highlights the fact that the DK12 conclusions are a result of their focus on short-term noise" Also why is there such a sharp rise in the 0-700m OHC in the 1998-2003 period which is not reflected in the 700-2000m OHC over the same period. Also why does this OHC graph stop in 2008 and not up to 2011 (the paper published in March 2012). Finally, the warming imbalance you confirm in the 0.4-0.6Wm-2 range agrees with Hansen's recent estimates but not with his 2005 model result of 0.85+/-0.15Wm-2, which should be increasing with growing CO2 levels since 2005. Why is the imbalance decreasing from the 2005 level? -
shoyemore at 23:04 PM on 25 December 2012Powerpoint friendly version of SkS Christmas cartoon
Paul D, Commiserations. Here in Ireland, we seem to have escaped the deluge you have experienced. The island of Ireland is (roughly) the size of England, but with a far smaller population density. So we (possibly) have more natural sinks & more empty floodplains for water to drain into the sea. I presume we get the same rainfall, in fact I thought Ireland got more on the average! However, after the egregious bulding boom, it is only a matter of time before we are caught again on the wrong side of nature. To John Cook & Co: Happy Christmas to the Skeptical Science team! -
milka at 22:05 PM on 25 December 2012Powerpoint friendly version of SkS Christmas cartoon
Hi John Wishing you, your family and Skeptical Science another successful year! Sandi Keane (and the Planet.....) -
Paul D at 21:20 PM on 25 December 2012Powerpoint friendly version of SkS Christmas cartoon
Actually JC, if you had put it up earlier, I could have printed it out and sent it as a Christmas card. -
shoyemore at 20:17 PM on 25 December 2012New research from last week 51/2012
chriskoz #1 I disagree. The report of the Presidential Council may be scientifically inaccurate by what we know today but in its own time it was cutting edge. It is certainly of enormous historical importance. Historians wondering why it was never followed up may blame the 1970s Oil Crisis, though that brought in the first wave of practical energy efficiency measures in industrial economies. Considering that President Carter made a determined effort to research alternatives to fossil fuels (efforts that were negated by the Reagan Administration from 1980), the 1970s look like an opportunity lost. -
chriskoz at 20:04 PM on 25 December 2012Powerpoint friendly version of SkS Christmas cartoon
Happy Christmas, John! Chris Koziarz. -
chriskoz at 19:56 PM on 25 December 2012Matt Ridley Risk Management Failure Deja Vu
Excellent analogy, Bert@24! The first of such kind that I've seen. I hardly make a post without useful input of mine but this time I make an exception and rest my post just on the applaud to you. Your little debunking analogy is worth exposing and repeating everywhere in popular media. -
chriskoz at 12:24 PM on 25 December 2012New research from last week 51/2012
The classic of the week, being a summary for policymakers rather than a pure sicentific source; contains some inconsistent claims. What cought my attention is how, on page2 column2, they speculated the warming effect of CO2. First, they estimate: "if CO2 reaches 400ppmv, the temperature will rise by 1.4F which may happen by 2010". That was quite good guess, provied they did not have Charney climate sensitivity back in 1970. They just had Charlie Keeling 12y record of CO2 and well established GHG band absorption theory, including WV feedback. Then, in the next paragraph, they claim: "if all available fosil fuel is burned and one half of the resulting CO2 were added to the atmosphere and there were no compensating effect, then the Earth's temperature would increase by 2F to 3F". That's way too small even within the context of this article only. They even have over-estimated the recoverable coal as 7600Gt (well that's the possible C flux we estimate today including permafrost and methane clathrate melt) which would mean more than 20 times the amount of C we burned to day. And that would have 2F to 3F warming potential only? Clearly that classic has no value as historical/scientific piece. Perhaps it has value because it shows that back then, even poliicians have not been talking about "global cooling threat" as contrarians would like to see. -
Bert from Eltham at 10:26 AM on 25 December 2012Matt Ridley Risk Management Failure Deja Vu
When I was learning how to fly in the late seventies my instructor put this hood thing on my head so I could only see my instruments or dash and not outside. This exercise was designed to teach a mere beginner like me to never fly in clouds or lose sight of the real horizon or worse at night. He gave me the usual instructions to climb/descend and turn to set headings and various combinations. He then asked me to climb to 7000ft on a heading of 135. I knew there was cloud higher than we were and sure enough we were in thick cloud. I could tell by the sudden dimming of the light. He then put me through a lot of turns climbs and descents and combinations of all these. After about twenty minutes he said 'You do know how to fly on instruments! You were not cheating!' I then told him it was a simple matter to just cross correlate all the instruments to give a true indication of the state of the aircraft. Working in science had given me this insight. Further if you rely only on one instrument and ignore all others you will crash. Even if you look at all and fail to cross correlate and not see the pattern you still crash. The usual control failure is a spiral descent at ever increasing speed into the deck. This is analogous to the deniers flying. They will point to one instrument and say all is good. If that one changes they will find another that tells them all is OK. They then put absolute trust in the balance centre in their ear (natural cycles) . They then ignore that their airspeed is increasing, engine revs are increasing, they are losing height and the artificial horizon looks 'stuck' at some impossible angle. The heading is varying a bit but that is due to the wind! All is fine until you hit the deck at a velocity higher than V never exceed for your aircraft. This chap Ridley has crashed a bank and he now knows how to drive a planet! Bert -
Paul D at 08:52 AM on 25 December 2012Powerpoint friendly version of SkS Christmas cartoon
Looks like most of the UK this Christmas! http://www.bbc.co.uk/news/uk-20493378 -
Tom Curtis at 07:40 AM on 25 December 2012Greenhouse Effect Basics: Warm Earth, Cold Atmosphere
curiousd @68, I take it that you are asking about the small upward spike at the center of the CO2 absorption band rather than the large notch in the outgoing radiation caused by CO2 absorption and re-emission that Sphaerica has explained. The upward spike occurs in the point of strongest absorption by CO2. Because it is the point of strongest absorption, it requires less CO2 to absorb all (or most) of the upwelling radiation from below at that wavenumber. Consequently, CO2 at a higher altitude is able to absorb all upwelling radiation than is the case at neighbouring wavenumbers. Conversely, of course, there is stronger emission from higher altitudes at that wavenumber than from neighbouring wave numbers. These facts, together with the temperature profile of the atmosphere have interesting consequences: If you look down at 5km on the modtran program (default settings), you will see no central spike. That is because the high density is such that the greater absorptivity only makes a small difference in the average altitude of emission of upwelling radiation at that altitude. A small difference in altitude means a small difference in temperature, and hence little difference in the energy emitted. At 10 km there is a small downward spike at that wavenumber. Because 10 km is below the tropopause, higher means cooler, so emission from a higher altitude emits less energy. Again, however, because of the reasonably high density, the altitude difference is small. At 18 km, the small downward spike disappears again, although it was present at 17 km. The reason it disappears is that 18 km is the tropopause, so the small difference in altitude makes no difference in temperature, and hence emissions. At 20 km, a small upward spike appears. That is because the average altitude of emission for the wavenumber of strongest absorption is now in the stratosphere, and has a higher temperature than the neigbouring wavenumbers, whose average altitude of emission are still in the tropopause. At 30 km, the central spike is much taller. That is because the less dense atmosphere at this altitude results a greater altitude difference from the greater emission/absorption at that wavenumber, so the average emissions are from significantly higher. You will also notice, however, that the emissions from neigbouring wavenumbers are also higher than those at 20 km, indicating that the average altitude of emission to space at those wavenumbers has risen above the tropopause into the stratosphere. Despite this, total upward radiation has fallen nearly 1 W/m^2 compared to at 20 km. That is partly due to increased absorption by ozone, and partly because the average altitude of radiation to space in the wings of the CO2 notch is sill rising within the troposphere, resulting in reduced upward radiation. As move the look down altitude further up, upwelling radiation increase again, by about 1.5 W/m^2; but the basic shape of the CO2 absorption spectrum remains the same. It is important to note that the modtran model does not respond dynamically to increased CO2. Increasing CO2 increases the effective altitude of radiation to space. A simplistic understanding of this might suggest, from the fact that increased altitude shows increased upward radiation above 30 km, that increased CO2 will not decrease TOA IR radiation. In fact, that is not the case, even with no dynamic response, as can be shown by doubling CO2 in a modtran experiment. Further, increasing CO2 increases the height of the tropopause slightly, and significantly cools the stratosphere and hence the increase in emissions in the central regions of the CO2 notch with altitude above the tropopause. That means the Modtran model underestimates the reduction in IR radiation to space with increased CO2. Note also that different latitudes and seasons have very different temperature profiles, which makes a significant difference to the effect of change in lookdown altitude. -
villabolo at 07:31 AM on 25 December 2012Arctic continues to break records in 2012: Becoming warmer, greener region with record losses of summer sea ice and late spring snow
Sphaerica "How are the exiting farmers in Texas, Oklahoma and the rest of the US Midwest supposed to react to this?" Russian passports? Seems that the Ruskies won the cold war after all. :-) -
Bob Lacatena at 06:25 AM on 25 December 2012Arctic continues to break records in 2012: Becoming warmer, greener region with record losses of summer sea ice and late spring snow
Villabolo, Yes. Some people seem to love to rather simplistically belief that agriculture can simply move further north, without considering that:- The length of the growing season (available sunlight and length of day) is shorter
- The soil was scraped away during the previous glacial period, and it takes thousands of years of growth to replace such soil
- How are the exiting farmers in Texas, Oklahoma and the rest of the US Midwest supposed to react to this?
- Now we're going to clear that many more tens of thousands of square miles of forest, further adding CO2 to the atmosphere, in order to make room for all of those farms?
-
Bob Lacatena at 06:17 AM on 25 December 2012Solar Cycle Model fails to predict the recent warming
JRT256, Your comment is puzzling. Did you actually read the post? Sunspot cycles and variations and cosmic rays are definitively not currently warming the Earth's climate, since those factors have been on the decline for the past thirty years. As such, while there is some chance that they have a small influence on climate, this influence must be negative, and yet is clearly being vastly overwhelmed by CO2. Why is it that you think the above post does not answer "the question currently being asked?" -
villabolo at 06:09 AM on 25 December 2012Arctic continues to break records in 2012: Becoming warmer, greener region with record losses of summer sea ice and late spring snow
John Russell @ #8 Wasn't meant as a criticism. :-) I could imagine what will happen to storm lashed refineries, pipe lines, and tar sands' pits. -
william5331 at 05:22 AM on 25 December 2012Subcap Methane Feedbacks. Part 3: Methane from beneath the ice
There may be a couple of further wrinkles to this story http://mtkass.blogspot.co.nz/2011/08/end-of-ice-ages.html -
John Russell at 05:04 AM on 25 December 2012Arctic continues to break records in 2012: Becoming warmer, greener region with record losses of summer sea ice and late spring snow
villabolo #7 I'm sure you're right (though you're making my point about 'positives'). Never mind, they'll be too busy mining tar sands, minerals and pumping Arctic oil to notice. -
william5331 at 05:01 AM on 25 December 20122012 SkS Weekly Digest #51
Hey Guys It's time we stopped obsessing about the climate deniers and just got on with documenting the changing climate. It's a shame to keep giving them oxygen as if they have something worthwhile to say. They remind me of someone standing on a beach during an earth quake denying that Tsunami's exist. They are irrelevant and becoming more so as the months roll on. -
villabolo at 04:32 AM on 25 December 2012Arctic continues to break records in 2012: Becoming warmer, greener region with record losses of summer sea ice and late spring snow
John Russell @4: "From a human perspective we can expect much turmoil, in geo-political terms, as areas nearer the equator could eventually become uninhabitable and food production is forced to migrate latitudinally. I guess Canada, Siberia, Greenland and Svalbard become power houses of a new economy..." My understanding is that the soil in Canada's boreal forests is thin, rocky and acid. The acidity can be neutralized with lime though you'll need large amounts. The rockiness will make mechanized agriculture difficult. What's more, the albedo change in the arctic will guarantee that there will be more intense storms in that region which can ruin crops. -
villabolo at 03:58 AM on 25 December 2012Arctic continues to break records in 2012: Becoming warmer, greener region with record losses of summer sea ice and late spring snow
@Terranova #3: Here is an example of a negative result on the Siberian permafrost. Of you're thinking of agriculture in that region, heavy equipment simply will not be able to operate in swampland. The only positive result I can think of is that the vegetation growing in this muck may slow down the CO2 build up by a bit. Other than that, it is not to our benefit to have increased levels of methane. -
John Hartz at 03:36 AM on 25 December 20122012 SkS Bi-Weekly News Roundup #11
@Paul.H #3: My commentary under the SkS Highlights heading stems from what I have observed happening in the USA. It may or may not be reflective of what’s happening in other countries of the world. On a global scale, the ever-growing body of climate science is quite robust. The willingness of world leaders in both the public and private sectors to embrace what the science is telling us and to take appropriate actions to prevent a future global climate catastrophe is currently severely lacking. -
John Hartz at 03:14 AM on 25 December 2012Arctic continues to break records in 2012: Becoming warmer, greener region with record losses of summer sea ice and late spring snow
@Trranova #3: The detail that you are looking for is embedded in the NOAA report itself, i.e., Arctic Report Card: Update for 2012 . -
John Russell at 03:09 AM on 25 December 2012Arctic continues to break records in 2012: Becoming warmer, greener region with record losses of summer sea ice and late spring snow
@Terranova, #3 I'm not really sure what your point is. I guess it depends on what we define as 'negative' and 'positive'. Clearly some species will see their habitat shrinking, while other species will experience improving conditions and a population explosion. So is that positive or negative? For the oil companies it's already clear that they see the Arctic as a land of opportunity, as do shipping companies wishing to send their cargoes over 'the top of the world'. Positive or negative? The problem is we're taking a world that's to a large extent been in a reasonably steady state and we're giving it a really good shake up; not by intent but as a side effect of our activities. Eventually, of course, it will all settle again into a new and different equilibrium, but in the meantime you can expect turmoil amongst all species of flora and fauna with much 'collateral damage'. Positive or negative? From a human perspective we can expect much turmoil, in geo-political terms, as areas nearer the equator could eventually become uninhabitable and food production is forced to migrate latitudinally. I guess Canada, Siberia, Greenland and Svalbard become power houses of a new economy and we leave the Mediterranean, Middle East, India and Central America to stew in their own juice. Positive or negative? I know what I think. -
Paul.H at 02:57 AM on 25 December 20122012 SkS Bi-Weekly News Roundup #11
Is there any actual solid progress being made though? While the climate science FUDers are doing their thing & large parts of the public continue to buy into that line of BS, for whatever reason - political ideology seems to be a favourite amongst those I've spoken to, I just don't see us going much of anywhere. Particularly this past year my level of pessimism has only been going up... I've reached the point where I despair for our future to be perfectly honest. -
Terranova at 01:46 AM on 25 December 2012Arctic continues to break records in 2012: Becoming warmer, greener region with record losses of summer sea ice and late spring snow
As a working biologist/ecologist, I found the article interesting, but scant on information. It did prompt me to do a little research on the vegetation and food chain bullets. My initial reaction was that those statements did not appear to be a negative consequence of climate change and instead appeared to be generally positive. A Christmas Eve morning spent reviewing published data supported my intuition. From Environmental News Network, "Rising temperatures in the Arctic circle has caused changes in vegetation in the last few decades. Plants are growing taller, there is less bare ground devoid of vegetation, and even some shrubs are growing. It is far from being an agricultural breadbasket, but is well on its way to becoming a more lively ecosystem." The arctic fox population fluctuates based on prey availability - notably lemmings. It is a well studied and classic example of predator/prey relationships as pertaining to population sizes. Also, competition with the larger red fox has caused population decline in areas where the red fox has increased it's range. The northern limit of the red fox's geographic range is determined directly by resource availability, whereas the southern limit of the arctic fox's range is determined, through interspecific competition, by the distribution and abundance of the red fox. There are definitely climate change fingerprints on resource availability. However, it is not the only reason red fox numbers have increased. It has to be considered that the decline in gray wolf numbers has led to an increase in the number of red foxes due to decreases inter-specific competition and predation. Less gray wolves also results in fewer carcasses for arctic foxes to scavenge from. Also, a recent paper shows that climate change will favor non-specialist animals in the sub-arctic. From the paper: "The reason they expect global warming to benefit Arctic mammals rather than hinder them, they say, is that most high-latitude species are generalists: they’re used to having to cope with a wide range of climatic conditions and aren’t too dependent on any one feature of the ecosystem." Some species will decline, but many others will benefit. And, with phytoplankton being the base of the trophic level pyramid more energy will be available to move upward to larger animals. There may, or may not, be issues related to the timing of the phytoplankton bloom, but regardless aquatic and terrestrial ecosystems will be benefit. A recent paper by Arrigo, et al (2012) supports this. -
John Hartz at 00:44 AM on 25 December 2012Solar Cycle Model fails to predict the recent warming
@ JRT256 #18 The answer to the question, “What's the link between cosmic rays and climate change?”, is the SkS rebuttal article to the denier myth, “It’s Cosmic Rays”. To access the Intermediate version of the rebuttal article, click here To access the Advanced version of the article, click here If you have any follow-up questions about the contents of either of these two articles, please post them on the common comment thread to the articles. -
Bob Lacatena at 23:57 PM on 24 December 2012Greenhouse Effect Basics: Warm Earth, Cold Atmosphere
curiousd, What is it exactly that you are asking about the hole (the inverted spike)? Yes, that is the region of CO2 absorption, but what don't you understand? Without knowing that answer, just taking a shot and hoping this answers your question: Within that range of wavelengths (or wave numbers or frequencies, depending on whichever measure is being used), CO2 strongly absorbs radiation. In the dense troposphere, such absorbed energy is usually quickly transmitted, through a collision, to another molecule, most likely O2 or N2 (those being by far the most common). This leaves the CO2 molecule capable of absorbing (and transmitting) IR once again, and also heats the atmosphere (given that the temperature of a gas is primarily a measure of the translational kinetic energy of its component molecules). At higher altitudes, where the altitude is less dense (and cooler), the CO2 molecule has more of a chance of re-emitting the absorbed radiation before passing that energy on to another molecule by collision. Even so, while it is more likely to have absorbed the energy from the warmer parts of the atmosphere below than the cooler parts above, it may radiate it away in any direction, with equal chance, so that some of the radiation arriving from from the planet below, through the atmosphere, may be radiated back down where it is more likely to be absorbed by the atmosphere and transmitted to another molecule. Eventually, of course, some of this radiation escapes into space -- but much less of it within this band than in other bands, due to all of the interference along the way. So there are two ways that you can explain this. One is to visualize the various photon-and-molecule interactions along the way, which prevent energy in that band from proceeding through unscathed (as it does in most, but not all, other bands). Another, broader way to look at it is that the energy in the IR band is dimmed, much as lighted is partially blocked, scattered and dimmed when passing through a fog. But in the case of the radiation in this band, in the atmosphere, there is eventually a point in the atmosphere where that band of radiation is being emitted and the atmosphere is rarefied enough to allow it to escape, unhindered, into space. Since this altitude is higher, that area of the atmosphere is also cooler, therefore it emits at a lower temperature and therefore it emits less total radiation (in that band). In a nutshell, then, this means that for other bands, the degree of emission (the strength in that band) conforms to the temperature at the surface of the earth (since the radiation makes it through, unhindered, from surface to space). [Study the Stefan-Boltzmann law.] The band in the absorbed-by-CO2 range, however, is hindered, and so is emitted from an area near the top of the troposphere. That area is, of course, much cooler, and so the radiation of emission represents that of a body of a much lower temperature, i.e. radiation in that band is weaker. Taking this one step further and increasing the CO2 concentration can, among other things, show that eventual transmission into space, while unaffected and so unchanged in other bands, will occur from a higher altitude in the CO2-absorption bands. This means that total energy emitted from the surface, which has warmed due to the effect, will be higher, but emission into space within the CO2 band will from an even higher, cooler altitude, and so will be reduced. [There are other details here, such as pressure and doppler broadening, which marginally widen the bands being discussed, but these details aren't strictly necessary to understanding the "hole" or "window" under discussion.] -
JRT256 at 23:32 PM on 24 December 2012Solar Cycle Model fails to predict the recent warming
Interesting, but aren't you beating the wrong dead horse? The question currently being asked is whether Sunspot cycles and variations in cosmic rays that accompany them are influencing the Earth's temperature and climate. -
curiousd at 22:09 PM on 24 December 2012Greenhouse Effect Basics: Warm Earth, Cold Atmosphere
In the above nice graph by Conrath, et al, there is that cental up going spike that appears at the maximum absorption wavelength for the CO2 bending mode. The same thing shows up using Modtran and the spike varies in an interesting way with the simulated altitude of the satellite. If I show this to an audience someone will ask about that spike. I could guess but don't want to. Can someone explain? -
Dikran Marsupial at 21:43 PM on 24 December 2012Foster and Rahmstorf Measure the Global Warming Signal
@curiousd Firstly it is rather overstating things to suggest that the "Foster - Rahmsdorff multiple regression analysis is one of the important parts of any AGW presentation"; it isn't, it is a useful analysis that shows that the recent "hiatus" in global temperatures can be adequately explained by the observed forcings and ENSO. If it wasn't for the "skeptics" bloviating on about the hiatus and promulgating multiple misunderstandings of statistical significance, Foster and Ragmsdorff would get far less attention that it does. The really important parts of an AGW presentation are about physics, not statistics. What Foster & Rahmsdorff are not doing is claiming that their regression analysis is a solid attribution study (as far as I can see), so it isn't that surprising that there may be other elements relevant to a proper attribution (e.g. cloud cover, aerosols etc.) that do not appear in the analysis. Regression analysis has a problem called "missing variable bias", which basically means that if one of your explanatory variables is correllated with some relevant variable that is not included in the analysis, it will act as a proxy (to some extent) for the missing variable. This means that a regression analysis can be used to show that something can be explained by X, Y and Z, but not that it is explained by X, Y and Z. This is what Foster and Rahmsdorff are aiming to do, i.e. demonstrate that observed temperatures can be explained by a linear trend, solar forcing, volcanic forcing and ENSO, and therefore there is no real reason to be greatly surprised by the apparent hiatus that is the focus of so much interest. The analysis is primarily useful in combatting misinformation.
Prev 1003 1004 1005 1006 1007 1008 1009 1010 1011 1012 1013 1014 1015 1016 1017 1018 Next


