


 Arguments


Recent Comments
Prev 1011 1012 1013 1014 1015 1016 1017 1018 1019 1020 1021 1022 1023 1024 1025 1026 Next
Comments 50901 to 50950:
-
Kevin C at 06:48 AM on 8 December 2012DIY climate science: The Instrumental Temperature Record
Thanks for the comments. Doug: I've fixed the article text, John will have to do the page title. Dawei: I look forward to seeing what you've got. If you don't already have an image host, I find imgur.com good. DSL: I think Watts' station ratings are USHCN only. I did as an exercise manage to do a reasonable reconstruction from 60 well spaced stations in a spreadsheet, I may be able to dig that out if you're interested. Nick: I'll deal with the trend line and the colours. I suspect frames will break the content management system though. You could pop the printable version of the article (link at the bottom of the article) up in a separate, non-maximised window. Thanks! I'll do the changes in a week or so to try and deal with any other issues which come up. I've also converted the ERSST v3b data to Hadley format so you can use it. If anyone wants to try it I could stick it on filedropper. -
John Hartz at 04:48 AM on 8 December 2012It's El Niño
Bob Tisdale places great weight on “teleconnection” processes throughout his numerous posts. It is therefore critical for all involved in this discussion to have a common understanding of what “teleconnection” is. According to the IPCC, Teleconnection: A connection between climate variations over widely separated parts of the world. In physical terms, teleconnections are often a consequence of large-scale wave motions, whereby energy is transferred from source regions along preferred paths in the atmosphere. Source: Annex I (Glossary) to Climate Change 2007: Working Group I: The Physical Science Basis, IPCC Fourth Assessment Report. In comment #159, Tisdale asks HH: “On the other hand, are you aware of teleconnections? Are you aware that there’s no heat transfer with teleconnections?” Is Tisdale assuming that there is a distinction between “heat” and “energy”, or does he employ a different definition of “teleconnection” than that stated above? -
It's El Niño
The most recent replies from Tisdale are extremely verbose - and avoid addressing criticisms. Some notes from my point of view (not exhaustive, mind you, but if you find the first 10% of a Gish Gallop to be nonsense, you can reasonably expect the same quality in the rest): * Compo and Sardeshmukh 2009: Oceanic influences on recent continental warming - They found that running the models with oceanic warming (>93% of the energy from the GH effect) but without continental GHG warming (2.1% continental, 2.3% atmospheric) produced nearly identical model results to using full forcings. Tisdale claims this in some fashion invalidates ocean warming - but if you have only subtracted 5% of the forcing, leaving in 95% of the GHG effect, such results are entirely unsurprising. A nonsense claim from Tisdale. * And what of the more than sufficient warming from an enhanced greenhouse effect? And as I replied to KR at 134: Downward longwave radiation appears to do nothing more cause a little more evaporation from the ocean surface, which makes perfect sense since it only penetrates the top few millimeters. This statement alone represents pure denial on Tisdale's part. He has been pointed to the physics and to the observations confirming oceanic warming from the enhanced greenhouse effect - his response here is nothing more than a repeated, armwaving denial of the physics and the data. * Models. Kevin C has taken the time to examine Tisdale's model (single lag, no volcanic term - which, I will point out, Tisdale has never clearly explained), confirmed by replicating Tisdale's results. He has in addition examined the behavior of a more physically realistic two-lag model with volcanic forcing. When tested against data outside the training set, Tisdale's model fails completely. Kevin C's more realistic model replicates the data both within and outside the training set. Conclusions drawn from Tisdale's model are therefore unsupported. Tisdale's reply consists of just repeating his poor model results. That is no reply at all - Tisdale's model is a failure. * Tisdale claims that "global oceans did not respond proportionately" to ENSO events, but argues only from Sea Surface Temperatures (SST's). Not ocean heat content (OHC), but just surface temperatures. The energy involved in the ENSO is considerable in comparison to atmospheric energies, but not compared to the ocean mass itself. SST is by no means a sufficient measure of the global oceans - rather a noisy subset thereof. If you actually examine the global oceanic response you do indeed see a proportional response to forcing over the period of observations, with small variations occurring related to (among other things) the ENSO. Again, a nonsense claim from Tisdale, looking at the wrong data set relative to his hypothesis.
---
Finally, after a Gish Gallop of (non)replies, Tisdale exits the thread. Leaving (IMO) questions unanswered, criticisms unaddressed, and multiple examples of denial of the physics and the evidence.
At this point, after considering Tisdale's arguments, I would consider the myth of the ENSO driving global warming to be busted.
Again, a nonsense claim from Tisdale, looking at the wrong data set relative to his hypothesis.
---
Finally, after a Gish Gallop of (non)replies, Tisdale exits the thread. Leaving (IMO) questions unanswered, criticisms unaddressed, and multiple examples of denial of the physics and the evidence.
At this point, after considering Tisdale's arguments, I would consider the myth of the ENSO driving global warming to be busted.
-
Daniel Bailey at 03:39 AM on 8 December 2012Past 150,000 Years of Sea Level History Suggests High Rates of Future Sea Level Rise
Shorter Andrew: For ice sheets, gravity is a bee-otch. -
Philippe Chantreau at 03:11 AM on 8 December 2012It's El Niño
Bob Tisdale certainly makes a tremendous effort to have the last word, or the last couple of thousand words. I'm hoping that it will be examined closely, although I confess I do not have the leisure of doing so. I did notice this: "If the Rest-of-the-World sea surface temperature data cooled proportionally during the La Niña events of 1988/89 and 1998-2001..." The fact that they did not could certainly point to the existence of a warming forcing... -
AndrewDoddsUk at 03:03 AM on 8 December 2012Past 150,000 Years of Sea Level History Suggests High Rates of Future Sea Level Rise
Yes.. Basically, when ice sheets grow, they appear to be limited by precipitation. Even if you have 2 meters of precipitation a year that all freezes, it would take 1000-2000 years to build a continental ice sheet. On the other hand, a back of the envelope calculation (direct sunlight, heavily absorbed) suggests that ice can melt at 10cm/day, or 36 meters per year. (36MJ/m2/day = 100kg ice/m2/day = 10cm) And ice dynamics/flow act to slow the growth of ice sheets and speed the melt. So a crude approximation suggests that meltdown should be much faster than freezeup.. -
Doug Bostrom at 02:42 AM on 8 December 2012It's El Niño
If nothing else is accomplished Bob at least lends new credence to the concept of "catastrophism." -
Pete Dunkelberg at 01:28 AM on 8 December 2012Past 150,000 Years of Sea Level History Suggests High Rates of Future Sea Level Rise
It is interesting to compare this new paper with this Milankovich-based model: "So, we can see that [in this model] the Earth often pops rather suddenly into a warm interglacial state and cools a bit more slowly into a glacial state." -
neilrieck at 22:05 PM on 7 December 2012The Latest Pre-Bunked Denialist Letter in Lieu of Real Science
It is obvious to most people that this denialist petition is nothing more than a publicity stunt prior to the United Nations Climate Change Conference in Doha. That said, I am surprised the denialists continue with the childish notion that an increase thermal energy immediately translates into greater temperature. As most people with a secondary school diploma already know, one calorie of heat is required to raise the temperature of one gram of water by one Celsius degree. These students also know that 80 calories are required to convert one gram of ice to one gram of liquid water. If the average global temperature has not increased as fast as century trend-line projections then you need only look for melting ice to locate the missing thermal energy. The arctic, which is melting at an unprecedented rate, is the likely culprit but what will happen to global temperature when all the ice has melted? -
JasonB at 20:44 PM on 7 December 2012It's El Niño
A closing note: Thanks to all of you for your feedback. It does not appear we’re going anywhere with this discussion. That is, it’s quite obvious we are not going to agree about anything. Therefore, it’s likely I won’t be back on this thread
That's one strategy to studiously avoid the meat of the criticism and instead hope that everyone will be overwhelmed by the spam, I suppose. In that veritable Gish Gallop of posts the only attempt to respond to Kevin C's devastating results was to insist they'd already be addressed by an earlier comment (#167). How disappointing. I suppose this stands as a warning to "skeptics" of the dangers of egging on SkS regulars to stop ignoring fringe theories and instead take a close look at them. You're better off staying below the radar. -
Bob Tisdale at 20:01 PM on 7 December 2012It's El Niño
A closing note: Thanks to all of you for your feedback. It does not appear we’re going anywhere with this discussion. That is, it’s quite obvious we are not going to agree about anything. Therefore, it’s likely I won’t be back on this thread. And thank you, moderators. Enjoy your holidays. -
Bob Tisdale at 20:00 PM on 7 December 2012It's El Niño
Michael Sweet says at 147: “Your claim here that Gavin Schmidt at Realclimate says you can compare a single realization (what happened) to the model average and not to the model envelope is simply untrue.”
I don’t believe I claimed there “that Gavin Schmidt at Realclimate says you can compare a single realization (what happened) to the model average and not to the model envelope…”. I quoted Gavin Schmidt’s reply to the RealClimate comment at 30 Sep 2009 at 6:18 AM. It was:
[Response: Any single realisation can be thought of as being made up of two components - a forced signal and a random realisation of the internal variability ('noise'). By definition the random component will uncorrelated across different realisations and when you average together many examples you get the forced component (i.e. the ensemble mean). Just as in weather forecasting, the forecast with the greatest skill turns out to be this ensemble mean. i.e. you do the least badly by not trying to forecast the 'noise'. This isn't necessarily cast in stone, but it is a good rule of thumb. - gavin]
Gavin said what he said. He was not talking about model-data comparisons; he was talking about model outputs in general, as was the quote I provided you from NCAR. NCAR wrote:
Unless you are interested in a particular ensemble member where the initial conditions make a difference in your work, averaging of several ensemble members will give you best representation of a scenario.
I’m NOT interested in the model noise, Michael; I’m also NOT interested in a “particular ensemble member where the initial conditions make a difference in your work”; I’m interested in the forced component that’s presented by the multi-model ensemble mean of all of the CMIP3 or CMIP5 climate models in my model-data comparisons, because it gives you “the best representation of a scenario”.
Note: The NCAR webpage I linked earlier seems to be offline, but the Wayback Machine has captured the text.
-
Bob Tisdale at 19:58 PM on 7 December 2012It's El Niño
Tom Curtis at 146 says: “Why did Tisdale include a La Nina dominated period in his final period, when he must know that doing so will distort the comparison with the earlier period? And if La Nina dominated periods cause cooling, why has there been no cooling in the La Nina dominated period from Jan 1999 to the present?”
Tom, you’re referring to this graph. If you had been following the conversations on this thread you would have discovered that the global oceans did not respond proportionally to the La Niña events of 1988/89 and 1998-01 and that that failure to cool proportionally during those La Ninas was why the sea surface temperatures for the Atlantic-Indian-West Pacific oceans (referred to as the Rest-of-the-World in earlier comments) acquired its long-term warming trend. So why then are breaking the latest warming period at 1999 during the 1998-2001 La Nina when the Atlantic-Indian-West Pacific data acquires part of its long-term trend? If the Atlantic-Indian-West Pacific data cooled proportionally during the La Niña events of 1988/89 and 1998-2001, it would have no warming trend like the East Pacific!
Tom Curtis at 146 says: “Interestingly, in his comment @137 Tisdale quotes Compo and Sardeshmuk…”
You then go on, Tom, to attempt (and fail at your attempt) to fault me for using a single index in the above graph, but then immediately compromise your position by referring to your preferred single index, the Southern Oscillation Index.
Second, you’ve apparently misunderstood Compo and Sardeshmuk. Their discussion of a using a single index had to do with regression analysis. They wrote:
In particular, defining ENSO in terms of a single index and ENSO-related variations in terms of regressions on that index, as done in many previous studies, can lead to wrong conclusions. This paper argues that ENSO is best viewed not as a number but as an evolving dynamical process for this purpose.
In this graph, I did not use the ENSO index in a regression analysis. I simply averaged the NINO3.4 sea surface temperature anomalies. There’s a very basic difference, Tom.
You also failed to recognize the importance of what I wrote after I quoted Compo and Sardeshmuk. It was:
Compo and Sardeshmukh have not accounted for the left over warm water associated with major El Niño events, like the 1986/87/88 and 1997/98 El Niños. In time, maybe they will.
Compo and Sardeshmuk are a step in the right direction, as I noted before I quoted them in my comment at 137.
Tom Curtis at 146 says: “Therefore simply taking the SST anomaly in the Nino 3.4 region over vastly different time periods cannot plausibly be considered a measure of ENSO activity. It in no way allows for the effects of other factors which we know will cause changes in the SST in the Nino 3.4 region as much as anywhere else.”
What “other factors” are referring to, Tom? Are you aware the authors of peer-reviewed papers about ENSO consider NINO3.4 sea surface temperature anomalies to be “a measure of ENSO activity”? An example is the Giese et al (2009) paper The 1918/19 El Niño. They argued that the 1918/19 portion of the 1918/19/20 El Niño was underestimated in the NINO3.4 sea surface temperature reconstructions, and that it was likely comparable in strength to the 1982/83 and 1997/98 El Niño events. Giese et al (2009) also suggested that the 1912/13 and 1939/40/41/42 El Niño events were also under-rated. If as you say, the NINO3.4 data “cannot plausibly be considered a measure of ENSO activity”, why would Giese et al (2009) have even written their paper, Tom? Why would NOAA use NINO3.4 data as the basis for its Ocean NINO Index? Why would Kevin Trenberth recommend NINO3.4 data over the SOI? Read on.
Please also note the dataset used by the ENSO experts who wrote that paper, Tom. It was HADISST, the same one I used. It was not HADSST3 or HADSST2, which you used in your comment 151.
With respect to your preference to the Southern Oscillation Index data, are you aware of all of the difficulties with that dataset? Refer to Trenberth (1997) The Definition of El Niño. He writes (my boldface):
Various versions of the SOI exist although, in recent years, most deal only with atmospheric pressures and usually only those at Darwin and Tahiti. In using the SOI based on just two stations, it must be recognized that there are many small scale and high frequency phenomena in the atmosphere, such as the Madden-Julian Oscillation, that can influence the pressures at stations involved in forming the SOI, but which do not reflect the Southern Oscillation itself. Accordingly, the SOI should only be used when monthly means are appropriately smoothed (Trenberth 1984, Trenberth and Hoar 1996a). For many years, Tahiti data were available only after 1935. Ropelewski and Jones (1987) outline an extension of the SOI prior to then using newly discovered Tahiti data, and they also discuss different ways of standardizing the data for use in the SOI. However, there are questions about the integrity of the Tahiti data prior to 1935 (Trenberth and Hoar 1996a), as the Tahiti-Darwin correlation is much lower in spite of strong evidence that the SO was present from other stations, and the noise level and variance in the early Tahiti data is higher than in the more recent period. Although Ropelewski and Jones (1987) state that they believe that months with data contained a full complement of daily values, several monthly means are missing and the monthly means that are present for the earlier period are more consistent with the view that they originate from an incomplete dataset in which values contributing to monthly means are missing. There are also questions about whether the diurnal cycle in surface pressure, which contains a strong semidiurnal tide component, has been adequately dealt with in forming the means. Ropelewski and Jones (1987) use a 5 month running mean to define their indices (as is done in NOAA's Climate Diagnostics Bulletin).
It took a couple of years after that paper, but in response to those deficiencies in the SOI, Tom, NOAA and many scientists adopted NINO3.4 sea surface temperature anomalies and the Cold Tongue Index (which is based on sea surface temperature anomalies of a similar region) as the better measure of the frequency, magnitude and duration of El Niño and La Niña events.
Further to your comment 151: One of the reasons Giese et al used HADISST is because HADSST2 or HADSST3 are spatially incomplete. That is, there’s missing data. This can be seen in the output from the KNMI Climate Explorer of NINO3.4 data for the periods of 1912 through 1944 and 1944 through 1976, using a 15% cutoff as you did:
HADSST2 NINO3.4 from 1912-1944
HADSST2 NINO3.4 from 1944-1976
HADSST3 NINO3.4 from 1912-1944
HADSST3 NINO3.4 from 1944-1976
Note how much data is missing. I’ve limited the graphs to 3+ decade periods so that you could see all of the missing data, unlike your graphs in comment 151. That lack of data appears to have skewed the results you presented in comment 151, Tom.
If you had asked me what dataset I used in this graph, Tom, I would have told you HADISST. It’s been infilled so there’s no missing data. Here are the HADISST-based graphs from the KNMI Climate Explorer of NINO3.4 SST anomalies so you can visually compare them to the HADSST2- and HADSST3-based graphs above:
HADISST NINO3.4 from 1912-1944
HADISST NINO3.4 from 1944-1976
The differences between the HADISST-based NINO3.4 data and the others are quite extraordinary. Also if you had asked, I would have explained why I used HADISST—the HADSST2 and HADSST3 datasets are spatially incomplete in the NINO3.4 region. And I would have told you I used the base years of 1950-1979 in agreement with Trenberth (1997) The Definition of El Niño. He stated that 1950 to 1979 was the best base period for NINO3.4 sea surface temperature anomalies. Trenberth writes:
Figure 1 shows the five month running mean SST time series for the Niño 3 and 3.4 regions relative to a base period climatology of 1950-1979 given in Table 1. The base period can make a difference. This standard 30 year base period is chosen as it is representative of the record this century, whereas the period after 1979 has been biased warm and dominated by El Niño events (Trenberth and Hoar 1996a). Mean temperatures are higher in the Niño 3.4 region than in Niño 3 and its proximity to the Pacific warm pool and main centers of convection is the reason for the physical importance of Niño 3.4.
If you had asked, Tom, I would have been happy to explain all those things. You could have saved yourself a lot of time, and you would not have jumped to all the wrong conclusions.
-
Bob Tisdale at 19:54 PM on 7 December 2012It's El Niño
Bernard J. says at 145: “Specifically, I would like to know by exactly how much Tisdale believes that "[d]ownward longwave radiation" does or does not contribute to warming of the planet in terms of a particular DLR flux, and by what mechanisms that warming does - or indeed does not - does not occur.”
I believe this has been the underlying topic of discussion, Bernard J. The satellite-era sea surface temperature records and the ocean heat content records do not indicate that downward shortwave radiation has made any contribution to the warming.
Bernard J. says at 145: “Numbers and primary references would assist to make an objective and nuanced case.”
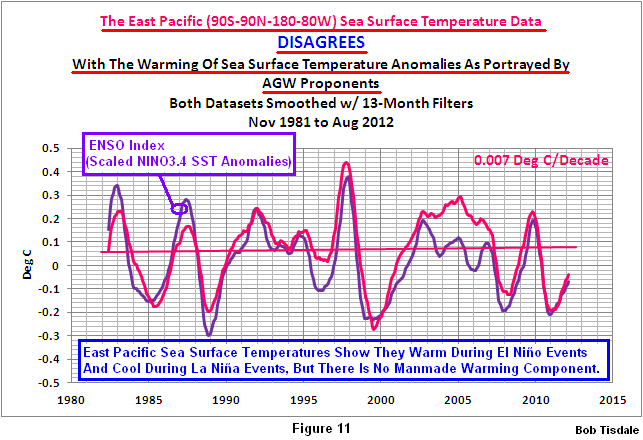
I’ll present the four datasets once again. For sea surface temperatures there’s the East Pacific Ocean and the Rest of the World data. In case you’ve missed this, the divergences during the La Niña events of 1988/89 and 1998-01 are when the Rest of the World data acquires its long-term trend. If the Rest-of-the-World sea surface temperature data cooled proportionally during the La Niña events of 1988/89 and 1998-2001, it would have no warming trend like the East Pacific! For ocean heat content, I presented as examples the Tropical Pacific and the North Pacific north of the tropics, both of which contradict the hypothesis of manmade greenhouse gas-driven global warming.
-
Bob Tisdale at 19:52 PM on 7 December 2012It's El Niño
Kevin C at 144: “You implicit model seems to be something like this: Ignoring volcanoes, the rest of the world temperatures track Nino34 with a single lag, except for some significant deviations which require another explanation.”
I’ve presented those explanations to you. You can watch them happen. Here’s my earlier reply:
The reasons for the divergences in the Rest-Of-the-World data during the 1988/89 and 1998-2001 La Niñas are physical, KevinC. You can try to eliminate or minimize them using models, but they exist. East Pacific El Niños like the 1986/87/88 and 1997/98 El Niños release vast amounts of warm water from below the surface of the west Pacific Warm Pool. Much of that warm water spreads across the surface of the central and eastern tropical Pacific. For the East Pacific El Niño events, like those in 1986/87/88 and 1997/98, that warm water impacts the surface all the way to the coast of the Americas (while with Central Pacific El Niño events it does not). The El Niños do not “consume” all of the warm water. At the conclusion of an El Niño, the trade winds push the leftover warm surface water back to the West Pacific. Additionally, there is left over warm water below the surface that’s returned to the west Pacific and into the East Indian Ocean via a Rossby wave or Rossby waves. This animation captures a Rossby wave returning warm water to the West Pacific and East Indian Oceans after the 1997/98 El Niño. Watch what happens when it hits Indonesia. It’s like there’s a secondary El Niño taking place in the Western Tropical Pacific and it’s happening during the La Niña. It’s difficult to miss it. (The full JPL animation is here.) Gravity causes that warm water to rise to the surface with time. The leftover warm water exists and it cannot be accounted for with a statistical model based on an ENSO index. You can see—you can watch it happen—the impacts of that warm water in this animation. There are no ENSO indices that account for the leftover warm water.
HHH
How does your model account for the leftover warm water, KevinC?
Same replies to KevinC at 149 and 152.
-
Bob Tisdale at 19:51 PM on 7 December 2012It's El Niño
IanC says at 143: “So in short, you are very certain that you are correct, and see no possible reason for your analysis to be flawed? By the way, I'm mainly referring to PDO and decadal temperature trends.”
Is this a repeated question, IanC? If so, why are you asking it when I’ve already answered it? If not, then I’ll ask, which decadal temperature trends? Global? East Pacific? North Pacific? Pacific? If it’s the latter 3, I’ll repeat my earlier answer:
From my comment 103: As I noted earlier, the PDO does not represent the sea surface temperature of the North Pacific, the Pacific basin as a whole, or the East Pacific. Here’s a graph that compares the decadal variability of the PDO and the detrended and standardized sea surface temperature anomalies of the East Pacific, North Pacific (north of 20N, same as the PDO), and the Pacific as a whole:
http://i49.tinypic.com/slhb8y.jpg -
Bob Tisdale at 19:48 PM on 7 December 2012It's El Niño
doug_bostrom says at 142: “Bob, where's the heat pump? How does it function?”
I don’t know how you’re defining heat pump, doug.
But I’ll cut and paste my earlier reply to skywatcher, as an explanation of ENSO to see if it agrees with how you’re defining heat pump. I wrote:
The process through which the sun creates the warm water for El Niño events was described in my comment 139, where I replied to composer99:
El Niño and La Niña events are part of a coupled ocean-atmosphere process. Sea surface temperatures, trade winds, cloud cover, downward shortwave radiation (aka visible sunlight), ocean heat content, and subsurface ocean processes (upwelling, subsurface currents, thermocline depth, downwelling and upwelling Kelvin waves, etc.) all interact. They’re dependent on one another. During a La Nina, trade winds are stronger than normal. The stronger trade winds reduce cloud cover, which, in turn, allows more downward shortwave radiation to enter and warm the tropical Pacific.
If you’re having trouble with my explanation because it’s so simple, refer to Pavlakis et al (2008) paper “ENSO Surface Shortwave Radiation Forcing over the Tropical Pacific.” Note the inverse relationship between downward shortwave radiation and the sea surface temperature anomalies of the NINO3.4 region in their Figure 6. During El Niño events, warm water from the surface and below the surface of the West Pacific Warm Pool slosh east, so the sea surface temperatures of the NINO3.4 region warm, causing more evaporation and more clouds, which reduce downward shortwave radiation. During La Niña events, stronger trade winds cause more upwelling of cool water from below the surface of the eastern equatorial Pacific, so sea surface temperature to drop in the NINO3.4 region, in turn causing less evaporation. The stronger trade winds also push cloud cover farther to the west than normal. As a result of the reduced cloud cover, more downward shortwave radiation is allowed to enter and warm the tropical Pacific during La Niña events.
To complement that, here’s a graph to show the interrelationship between the sea surface temperature anomalies of the NINO3.4 region and cloud cover for the regions presented by Pavlakis et al.
That discussion explains why the long-term warming of the Ocean Heat Content for the tropical Pacific was caused by the 3-year La Nina events and the unusual 1995/96 La Niña. First, here’s a graph of tropical Pacific Ocean Heat Content. It’s color coded to isolate the data between and after the 3-year La Niña events of 1954-57, 1973-76 and 1998-2001. Those La Niña events are shown in red. Note how the ocean heat content there cools between the 3-year La Niña events. Anyone who understands ENSO would easily comprehend how and why that happens. It’s tough to claim that greenhouse gases have caused the warming of the tropical Pacific when the tropical Pacific cools for multidecadal periods between the 3-year La Niñas, Composer99.
As you can see, the warming that took place during the 1995/96 La Niña was freakish. Refer to McPhaden 1999 “Genesis and Evolution of the 1997-98 El Niño”.
McPhaden writes:
For at least a year before the onset of the 1997–98 El Niño, there was a buildup of heat content in the western equatorial Pacific due to stronger than normal trade winds associated with a weak La Niña in 1995–96.
Based on the earlier description, that “build up of heat content” resulted from the interdependence of trade winds, cloud cover, downward shortwave radiation and ocean heat content. Simple. As you can see in the above graph, the upward spike caused by the 1995/96 La Niña skews the trend of the mid-cooling period, and if we eliminate the data associated with it and the 1997/98 El Niño, then the trend line for the mid-period falls into line with the others.
HHH
skywatcher, so La Niña events provide the naturally created fuel for El Niño events. More ENSO basics: An El Niño releases that heat, which is stored as warm water, from below the surface of the West Pacific Warm Pool. The warm water travels east and spreads across the surface of the eastern tropical Pacific. The El Niño releases heat through evaporation into the atmosphere, which is why tropical Pacific ocean heat content drops during an El Niño. Additionally, the convection, cloud cover and precipitation accompany that warm water east, sometimes almost halfway around the globe. These changes in location of the primary source of tropical Pacific convection and the resulting changes in atmospheric circulation, not a direct transfer of heat, are what cause surface temperatures to warm in areas remote to the eastern tropical Pacific.
Further to this, as I replied to doug_bostrom in my comment 103:
On the other hand, are you aware of teleconnections? Are you aware that there’s no heat transfer with teleconnections? Example: Why do the tropical North Atlantic sea surface temperature anomalies warm during an El Nino, doug? Do you know? There’s no direct exchange of heat yet the tropical North Atlantic warms during an El Niño. Why, doug? Could it have something to do with the slowing of the trade winds in the tropical North Atlantic in response to the El Niño? That would result in less evaporation, which is the primary way the oceans release heat. If there’s less evaporation, sea surface temperatures warm, do they not? Also, when the trade winds slow in the tropical North Atlantic in response to an El Niño, there’s less upwelling of cool waters from below the surface and less entrainment of that cool subsurface water. That would cause the seas surface temperatures to warm too.
HHH
If you don’t like my explanation, skywatcher, refer to Wang (2005) ENSO, Atlantic Climate Variability, And The Walker And Hadley Circulation for a more detailed discussion. And if you’d like a discussion of teleconnections for the rest of the world, refer to Trenberth et al (2002) Evolution of El Niño–Southern Oscillation and global atmospheric surface temperatures.
A quick note about Trenberth et al (2002). They qualify the results of their global warming attribution with:
Although it is possible to use regression to eliminate the linear portion of the global mean temperature signal associated with ENSO, the processes that contribute regionally to the global mean differ considerably, and the linear approach likely leaves an ENSO residual.
The divergences between the Rest of the World data and the scaled NINO3.4 data during the 1988/89 and 1998-01 La Niña events are those ENSO residuals.
HHH
Would you consider ENSO to be a heat pump, doug?
-
Bob Tisdale at 19:44 PM on 7 December 2012It's El Niño
John Hartz says at 141: “You have not responded to the question I posed to you in #121. For everyone's convenience, I will repost it here… Do you believe the following graph to be a valid representation of Jan-Oct global land & and surface temperature anomalies with respect to the 1961-1990 base period for calendar years 1950 through 2012?”
The data in that graph appears to be an honest representation of the data, but would you like to explain what this has to do with a discussion about the long-term effects of ENSO?
To save you the time needed to scroll up, the following is what I wrote in an earlier comment to skywatcher:
Are you aware that the warming of land surface air temperatures are primarily in response to the warming of the oceans, skywatcher? Refer to Compo and Sardeshmukh 2009: Oceanic influences on recent continental warming. The abstract reads:
Evidence is presented that the recent worldwide land warming has occurred largely in response to a worldwide warming of the oceans rather than as a direct response to increasing greenhouse gases (GHGs) over land. Atmospheric model simulations of the last half-century with prescribed observed ocean temperature changes, but without prescribed GHG changes, account for most of the land warming. The oceanic influence has occurred through hydrodynamic-radiative teleconnections, primarily by moistening and warming the air over land and increasing the downward longwave radiation at the surface. The oceans may themselves have warmed from a combination of natural and anthropogenic influences.
That study was based on climate models by the way and you can confirm the results at the ModelE Climate Simulations – Climate Simulations for 1880-2003 webpage, specifically Table 3.
HHH
And as I’ve shown, John, the satellite-era sea surface temperature and ocean heat content records do not confirm the existence of an anthropogenic component.
Could you have missed the importance of the divergences during the 1988/89 and 1998-01 La Niñas, John? The global oceans did not respond proportionally to the La Niña events of 1988/89 and 1998-01. That failure to cool proportionally during those La Ninas was why the sea surface temperatures for the Atlantic-Indian-West Pacific oceans (referred to as the Rest-of-the-World in earlier comments) acquired its long-term warming trend.
-
Bob Tisdale at 19:42 PM on 7 December 2012It's El Niño
skywatcher at 138 says: “5: Why is the well-understood mechanism of an enhanced greenhouse effect from long-lived GHGs not operating according to their physics, despite this physics neatly explaining both present climate and palaeoclimate changes?”
I’ll repeat my basic statement once more: the satellite-era sea surface temperature records and the ocean heat content records do not confirm the existence of an anthropogenic global warming component. And as I replied to KR at 134:
Downward longwave radiation appears to do nothing more cause a little more evaporation from the ocean surface, which makes perfect sense since it only penetrates the top few millimeters.
-
Bob Tisdale at 19:41 PM on 7 December 2012It's El Niño
skywatcher at 138 says: “4: Assuming that a new unidirectional process must be a recent or temporary occurrence, otherwise we would have boiled or frozen awfuly quickly ... Why is your proposed physical mechanism a recent occurrence, when ENSO has been around for millennia, perhaps hundreds of thousands of years?”
The multiple assumptions are yours not mine and your assumptions are monumental. For example, we’ve got reasonable sea surface temperature-based ENSO records dating back to the opening of the Panama Canal in 1914. Can you prove ENSO did not have the same effect and cause the warming from about 1917 to 1944? I’ve limited my discussion to the satellite era of sea surface temperatures because the data is globally complete and it’s considered to be “the truth”. As I replied to Michael Sweet in my comment 133, which was a cut and paste from my book:
Refer to Smith and Reynolds (2004) Improved Extended Reconstruction of SST (1854-1997). It is about the Reynolds OI.v2 data we’ll be using as the primary source of data for this book:
Although the NOAA OI analysis contains some noise due to its use of different data types and bias corrections for satellite data, it is dominated by satellite data and gives a good estimate of the truth.
The truth is a good thing, don’cha think?
skywatcher, as I’ve shown repeatedly throughout this exchange, the satellite-era sea surface temperature records and the ocean heat content data do not confirm the presence of an anthropogenic warming signal. You can believe what you want, but I refer to data, not climate models, for my understandings
-
Bob Tisdale at 19:39 PM on 7 December 2012It's El Niño
skywatcher at 138 says: “3: Why is this mechanism unidirectional, when ENSO is oscillatory?”
The impacts of ENSO are clearly not oscillatory. One look at the tropical Pacific OHC record clearly dismisses that idea. They would be better described as a discharge-recharge oscillator, where the recharge takes place during La Niña phases and the discharge takes place during El Niño. Also, the recharge varies, as can be seen in the response of the tropical Pacific Ocean Heat Content to the 1995/96 La Niña. I described above the recharge and discharge phases and the resulting teleconnections and confirmed it with data and with peer-reviewed papers. To further contradict your assertion that ENSO is oscillatory, with respect to sea surface temperatures, an El Niño releases warm water from below the surface of the west Pacific Warm Pool and the warm water spreads across the eastern tropical Pacific. That was the discharge phase. An El Niño does not consume the warm water. At the end of the El Niño, the warm water on the surface that’s left over from the El Niño is carried to the West Pacific and tropical East Indian Oceans, raising the surface temperatures there. The reverse does not occur during a La Niña. Further, there’s leftover warm water below the surface after the El Niño.
This leftover warm water was discussed in my reply to KevinC at 135:
The reasons for the divergences in the Rest-Of-the-World data during the 1988/89 and 1998-2001 La Niñas are physical, KevinC. You can try to eliminate or minimize them using models, but they exist. East Pacific El Niños like the 1986/87/88 and 1997/98 El Niños release vast amounts of warm water from below the surface of the west Pacific Warm Pool. Much of that warm water spreads across the surface of the central and eastern tropical Pacific. For the East Pacific El Niño events, like those in 1986/87/88 and 1997/98, that warm water impacts the surface all the way to the coast of the Americas (while with Central Pacific El Niño events it does not). The El Niños do not “consume” all of the warm water. At the conclusion of an El Niño, the trade winds push the leftover warm surface water back to the West Pacific. Additionally, there is left over warm water below the surface that’s returned to the west Pacific and into the East Indian Ocean via a Rossby wave or Rossby waves. This animation captures a Rossby wave returning warm water to the West Pacific and East Indian Oceans after the 1997/98 El Niño. Watch what happens when it hits Indonesia. It’s like there’s a secondary El Niño taking place in the Western Tropical Pacific and it’s happening during the La Niña. It’s difficult to miss it. (The full JPL animation is here.) Gravity causes that warm water to rise to the surface with time. The leftover warm water exists and it cannot be accounted for with a statistical model based on an ENSO index. You can see—you can watch it happen—the impacts of that warm water in this animation. There are no ENSO indices that account for the leftover warm water.
-
Bob Tisdale at 19:36 PM on 7 December 2012It's El Niño
skywatcher at 138 says: “2: What's the physical mechanism involved, if it's not the rise in greenhouse gases? Sloshing water about the oceans does not appear adequate if the oceans, as a whole, are warming.”
Your representation of ENSO as “Sloshing water about the oceans” clearly indicates you lack a basic understanding of the topics being discussed. Please refer to my preceding reply to you for the answer to this question.
-
Bob Tisdale at 19:34 PM on 7 December 2012It's El Niño
skywatcher at 138 says: “1: Where's the heat coming from? The oceans, globally, are warming, the atmosphere is warming, and yet the Sun is not getting any brighter. What's your energy source?”
The sun is the primary energy source, but sea surface and ocean heat content warming can and do also take place without the exchange of heat, which is the result of teleconnections. The process through which the sun creates the warm water for El Niño events was described in my comment 139, where I replied to composer99:
El Niño and La Niña events are part of a coupled ocean-atmosphere process. Sea surface temperatures, trade winds, cloud cover, downward shortwave radiation (aka visible sunlight), ocean heat content, and subsurface ocean processes (upwelling, subsurface currents, thermocline depth, downwelling and upwelling Kelvin waves, etc.) all interact. They’re dependent on one another. During a La Nina, trade winds are stronger than normal. The stronger trade winds reduce cloud cover, which, in turn, allows more downward shortwave radiation to enter and warm the tropical Pacific.
If you’re having trouble with my explanation because it’s so simple, refer to Pavlakis et al (2008) paper “ENSO Surface Shortwave Radiation Forcing over the Tropical Pacific.” Note the inverse relationship between downward shortwave radiation and the sea surface temperature anomalies of the NINO3.4 region in their Figure 6. During El Niño events, warm water from the surface and below the surface of the West Pacific Warm Pool slosh east, so the sea surface temperatures of the NINO3.4 region warm, causing more evaporation and more clouds, which reduce downward shortwave radiation. During La Niña events, stronger trade winds cause more upwelling of cool water from below the surface of the eastern equatorial Pacific, so sea surface temperature to drop in the NINO3.4 region, in turn causing less evaporation. The stronger trade winds also push cloud cover farther to the west than normal. As a result of the reduced cloud cover, more downward shortwave radiation is allowed to enter and warm the tropical Pacific during La Niña events.
To complement that, here’s a graph to show the interrelationship between the sea surface temperature anomalies of the NINO3.4 region and cloud cover for the regions presented by Pavlakis et al.
That discussion explains why the long-term warming of the Ocean Heat Content for the tropical Pacific was caused by the 3-year La Nina events and the unusual 1995/96 La Niña. First, here’s a graph of tropical Pacific Ocean Heat Content. It’s color coded to isolate the data between and after the 3-year La Niña events of 1954-57, 1973-76 and 1998-2001. Those La Niña events are shown in red. Note how the ocean heat content there cools between the 3-year La Niña events. Anyone who understands ENSO would easily comprehend how and why that happens. It’s tough to claim that greenhouse gases have caused the warming of the tropical Pacific when the tropical Pacific cools for multidecadal periods between the 3-year La Niñas, Composer99.
As you can see, the warming that took place during the 1995/96 La Niña was freakish. Refer to McPhaden 1999 “Genesis and Evolution of the 1997-98 El Niño”.
McPhaden writes:
For at least a year before the onset of the 1997–98 El Niño, there was a buildup of heat content in the western equatorial Pacific due to stronger than normal trade winds associated with a weak La Niña in 1995–96.
Based on the earlier description, that “build up of heat content” resulted from the interdependence of trade winds, cloud cover, downward shortwave radiation and ocean heat content. Simple. As you can see in the above graph, the upward spike caused by the 1995/96 La Niña skews the trend of the mid-cooling period, and if we eliminate the data associated with it and the 1997/98 El Niño, then the trend line for the mid-period falls into line with the others.
HHH
skywatcher, so La Niña events provide the naturally created fuel for El Niño events. More ENSO basics: An El Niño releases that heat, which is stored as warm water, from below the surface of the West Pacific Warm Pool. The warm water travels east and spreads across the surface of the eastern tropical Pacific. The El Niño releases heat through evaporation into the atmosphere, which is why tropical Pacific ocean heat content drops during an El Niño. Additionally, the convection, cloud cover and precipitation accompany that warm water east, sometimes almost halfway around the globe. These changes in location of the primary source of tropical Pacific convection and the resulting changes in atmospheric circulation, not a direct transfer of heat, are what cause surface temperatures to warm in areas remote to the eastern tropical Pacific.
Further to this, as I replied to doug_bostrom in my comment 103:
On the other hand, are you aware of teleconnections? Are you aware that there’s no heat transfer with teleconnections? Example: Why do the tropical North Atlantic sea surface temperature anomalies warm during an El Nino, doug? Do you know? There’s no direct exchange of heat yet the tropical North Atlantic warms during an El Niño. Why, doug? Could it have something to do with the slowing of the trade winds in the tropical North Atlantic in response to the El Niño? That would result in less evaporation, which is the primary way the oceans release heat. If there’s less evaporation, sea surface temperatures warm, do they not? Also, when the trade winds slow in the tropical North Atlantic in response to an El Niño, there’s less upwelling of cool waters from below the surface and less entrainment of that cool subsurface water. That would cause the seas surface temperatures to warm too.
HHH
If you don’t like my explanation, skywatcher, refer to Wang (2005) ENSO, Atlantic Climate Variability, And The Walker And Hadley Circulation for a more detailed discussion. And if you’d like a discussion of teleconnections for the rest of the world, refer to Trenberth et al (2002) Evolution of El Niño–Southern Oscillation and global atmospheric surface temperatures.
A quick note about Trenberth et al (2002). They qualify the results of their global warming attribution with:
Although it is possible to use regression to eliminate the linear portion of the global mean temperature signal associated with ENSO, the processes that contribute regionally to the global mean differ considerably, and the linear approach likely leaves an ENSO residual.
The divergences between the Rest of the World data and the scaled NINO3.4 data during the 1988/89 and 1998-01 La Niña events are those ENSO residuals.
-
Nick Stokes at 19:32 PM on 7 December 2012DIY climate science: The Instrumental Temperature Record
Kevin, Very nice. I tried it - it worked well. A couple of suggestions: 1. The trend line is hard to see - at first I thought it wasn't there. Could it be darker or thicker? 2. I found it a nuisance that the documentation was hard to access once the app was launched (OK, I did open another SKS tab). Could it be included in a frame? 3. Could it indicate the colors for land/ocean etc? - even though one can work it out. Just coloring the words would be one way. -
Bob Tisdale at 19:31 PM on 7 December 2012It's El Niño
Sorry for the delay. I was responding to comments at other blogs and writing new blog posts.
skywatcher at 138 says: Bob, in all your focus on one region of the Earth, you have apparently neatly dodged important questions with relation to global warming and your unusual conjectures…”
Apparently, skywatcher, you’ve missed the fact that the discussion of sea surface temperatures was broken down into two parts of the global oceans, the East Pacific (90S-90N, 180W-80W) and the Rest-of-the-World (90S-90N, 80W-180). How is that “one region of the Earth”, skywalker? Sure looks like it covers the global oceans to me.
Also, are you aware that the warming of land surface air temperatures is primarily in response to the warming of the oceans, skywatcher? Refer to Compo and Sardeshmukh 2009: Oceanic influences on recent continental warming. The abstract reads:
Evidence is presented that the recent worldwide land warming has occurred largely in response to a worldwide warming of the oceans rather than as a direct response to increasing greenhouse gases (GHGs) over land. Atmospheric model simulations of the last half-century with prescribed observed ocean temperature changes, but without prescribed GHG changes, account for most of the land warming. The oceanic influence has occurred through hydrodynamic-radiative teleconnections, primarily by moistening and warming the air over land and increasing the downward longwave radiation at the surface. The oceans may themselves have warmed from a combination of natural and anthropogenic influences.
That study was based on climate models by the way and you can get an idea of the order of magnitude using the ModelE Climate Simulations – Climate Simulations for 1880-2003 webpage, specifically Table 3.
And as I’ve shown, the satellite-era sea surface temperature and ocean heat content records do not confirm the existence of an anthropogenic warming component. Maybe you’ve missed this: the divergences during the La Niña events of 1988/89 and 1998-01 are when the Rest of the World data acquires its long-term trend. If the Rest-of-the-World sea surface temperature data cooled proportionally during the La Niña events of 1988/89 and 1998-2001, it would have no warming trend like the East Pacific!
-
2nd law of thermodynamics contradicts greenhouse theory
jibal - Appalling, isn't it? The lesson I take from this kind of discussion is simply this: There are, and always will be, idjits (IMO, apologies if strongly stated) who cannot be convinced (suibhne, Damorbel, Doug Cotton, others), who have blocks against a rational discussion, who are driven more by their personal worldview than facts that might contradict those. But clearly explaining their errors, even if they themselves cannot accept the data, provides the vast majority of reasonable people rational support they (I sincerely hope) appreciate for judging the issues. Most people can look at a discussion and recognize who is speaking from the data, from reason, and who is denying reality. While there is an element, as Friedrich Nietzsche said, of "At times one remains faithful to a cause only because its opponents do not cease to be insipid", I honestly believe that discussing the issues in a rational fashion can only assist those in the majority who might not have the time or training or inclination to personally dig into the for/against data issues. While I discuss matters with the deniers who raise objections, I try (insofar as as possible) to speak to the rather more silent majority. There are those who will never be convinced, but most people can clearly distinguish (given enough context, enough of an exchange) between a presentation of facts, and someone speaking from their nether regions. -
jibal at 14:51 PM on 7 December 20122nd law of thermodynamics contradicts greenhouse theory
At the beginning of this thread there was b-j-m insisting that CO2 must block incoming and outgoing energy equally because both contain IR components, even after being shown that the emission spectrum of the sun and the Earth are nearly disjoint. Here, 1400 posts later, is suibhne, whom I remember from the the G&T debates years ago, still treating heat and energy as synonyms despite the many times that physicists and others have pointed out, with numerous familiar examples, that energy freely travels from cold to hot (and in every other direction). In between are numerous other examples of the same phenomenon -- simple, indisputable refutations of claims being rejected out of hand, ignored, or otherwise having no effect on the claimant, who simply repeats the claim in the same or a different form. All of the claims that the greenhouse effect is a violation of the 2LOT were already refuted in the original article, yet numerous people have simply repeated the claim. (And we even have at least participant here claiming in another thread that the assertion that people deny the greenhouse effect is a strawman.) People have patiently explained at length the errors in these claims, to no effect. Something can surely be learned from this, some lesson about pedagogy or psychology, but other than bad news I'm at a loss as to what can be taken from it ... how we can use this knowledge to improve our situation. Anyone? -
vrooomie at 13:58 PM on 7 December 20122nd law of thermodynamics contradicts greenhouse theory
Soooo..did "PhysSci" ever get his paper published? We *could* have us an 'a-ha' moment from it! >;-D -
DSL at 13:46 PM on 7 December 2012DIY climate science: The Instrumental Temperature Record
Nice, Kevin -- and I was just trying to set up the same kind of deal in Excel, which would have taken me the rest of my lifetime (and I don't plan on dying for at least another five years). Know what'd be funny? If Watts et al.'s station siting regime could be optional selectable. -
Dawei at 13:15 PM on 7 December 2012DIY climate science: The Instrumental Temperature Record
Wow, very impressive. It took me a little while to figure it out -- not because it's unintuitive, but just because there's a surprisingly high amount of functionality here. Glad I made the effort effort though, I've already made some interesting plots that I may share in the next few days (don't want to ruin anyone's fun with spoilers!) The CSV export option is really handy too for those who want to analyze their results in more detail. Thanks for making this, I'm sure I'll be coming back to it again and again for a long time. -
Doug Hutcheson at 12:16 PM on 7 December 2012DIY climate science: The Instrumental Temperature Record
Just a couple of teething issues:- The page title of the calculator page is "Skeptical Science Email Subscription".
- I think the sentence "Ocean station data: Click to launch a file selector to select the land station data ..." should read "Ocean station data: Click to launch a file selector to select the ocean station data ..."
-
Doug Hutcheson at 11:37 AM on 7 December 20122012 SkS Bi-Weekly News Roundup #7
chriskoz @ 1I wonder why we are witnessing the repeat of Kyoto today
Because the countries which disliked the idea of making moderate changes to their lifestyles then are even more entrenched in disliking making drastic changes now. See Professor Kevin Anderson's half-hour 'Rhetoric to Reality' video here. -
DIY climate science: The Instrumental Temperature Record
Very nice! -
Doug Hutcheson at 11:10 AM on 7 December 2012The Greenhouse Gas Effect All-Star Fan Club
Phil @ 34, I didn't get past the statement "Air, pure oxygen and pure nitrogen all absorb more infrared radiation than pure CO2." Not very scientific of me, but I stopped reading then, before my head exploded. Perhaps I should have continued reading, to see what experimental support was provided for that statement. I can sense a Nobel for this alarming overturning of conventional physics ... -
DSL at 08:03 AM on 7 December 2012The Economic Damage of Climate Denial
This model has received play at The Economist. It seems, at first glance, to take an oversimplified view of climate change by reducing it to the relationship between temperature and agricultural output in a select range of major crops. In may get play in deniersville because it appears to make the argument that moderate change (~2C) will be beneficial (as long as migration is embraced). -
Chris G at 07:10 AM on 7 December 2012The Greenhouse Gas Effect All-Star Fan Club
Doug Bostrom @ 29, Now that you've said that, I have to agree. To generalise, I think most responses will fall under the "It's not my fault." category; I believe that can be applied to the present as well. DSL, Indeed, not that we should be looking at patterns without considering physical processes, but the record is full of ups and downs, but there hasn't much of a down for a while, and that should strike people as odd. -
vrooomie at 07:01 AM on 7 December 2012The Latest Pre-Bunked Denialist Letter in Lieu of Real Science
Oh, jeez...wrong thread for my comment @36, re: "We will see if Bob returns...... Kevin C, stunning work! This entire thread has been most illuminating and educational." Yoop/mod-on-the-beat, could you please delete that part, here, and move it to the Tisdale/ENSO thread? That's what I get for having eleventy windows open at once...;)Moderator Response:[Sph] We can delete what's here, but we don't have tools to easily move comments (yet, look for it in 2013). You should re-enter the comment in the right place, and when you do, I'll delete these.
[DB] First comment is deleted; please repost on the correct thread per SPH.
-
Bob Loblaw at 05:07 AM on 7 December 2012The Greenhouse Gas Effect All-Star Fan Club
As an example of being in denial without recognizing it, what about Aaron (comment #8)? He says early in his commentWhat ignorant small minority believes that there is no greenhouse effect and why do you address them?
and then finishes withCO2 by comparison, is inconsequential in moving heat into the atmosphere.
So, he says he (and implies everyone else) believes in the greenhouse effect, but his closing statement would seem to say that he believes at least one of the following: - CO2 is not a greenhouse gas - greenhouse gases do not "move heat into the atmosphere" (whatever that means - I'm going to guess "heat the surface") - that greenhouse gases do move heat into the atmosphere as part of the natural greenhouse effect, but do not do so with respect to anthropogenic increases in greenhouse gases - that the warming due to the greenhouse effect does not constitute "moving heat into the atmosphere". It seems that Aaron has not yet followed up his original contribution, so I don't know if I can expect a clarification on what he means by "move heat into the atmosphere", but it seems to me that he "accepts the greenhouse effect", but then just doesn't accept that increasing a greenhouse gas will increase the greenhouse effect. That looks a lot like denial to me. -
Philippe Chantreau at 04:23 AM on 7 December 2012The Greenhouse Gas Effect All-Star Fan Club
Vroomie, that thread is indeed a kind of epitome of denial. Peruse through again and you'll understand why some of us long timers of the site can be short on patience with the nonsense that keeps popping up. The heaps of bull that one like "Damorbel" could pile on would exhaust patience in even the best of us. Countless posts in that thread fall in the category "can't make this stuff up", the rest goes in "not even wrong." What is truly disgusting is that, as KR points above, the prominent deniers mentioned in this current thread officially endorse reality while paying lip service to delusion on their blogs. This current thread, however, has also tremendous entertainment value: it brings deniers denying that deniers deny obvious stuff, like Steve above. Years ago, it took me about one evening to figure where were the people who couldn't be taken seriously in this pseudo-debate. The likes of Steve Case greatly facilitated the process... -
Bob Loblaw at 03:51 AM on 7 December 2012PMO Pest Control: Scientists
This thread has been quiet for quite a while. Oddly enough, so have Canadian government scientists - largely due to continued silencing by the Harper government. Latest news story on the issue: Federal Bureaucrats Stayed Mum During Discussion About Silencing of Scientists [h/t on the story to a source within Environment Canada, who shall remain anonymous] The story begins:"At first, a top Environment Canada official seemed game to discuss “unmuzzling” government scientists during an international science conference earlier this year. ... Instead, she sat in the audience as a spectator during the session at the Vancouver conference, and was informed she should refer questions about the government’s strict communication policy to Ottawa, where a government “tactics” committee was working on a response...
-
Esop at 03:38 AM on 7 December 2012The Latest Pre-Bunked Denialist Letter in Lieu of Real Science
Reading Ivar Giævers newspaper Op-eds, one of his main arguments for AGW not being a problem is that despite the grave warnings from environmentalists and scientists, Ozone depletion and acid rain turned to be non-issues (according to him) since we don't hear much about those problems any more. This from a Nobel Prize winner. You can't make this stuff up. -
It's El Niño
Kevin C - Extremely clear, thank you so much for working through the details. It certainly looks like Tisdale has been working from a bad model, one that simply doesn't fit the data. This seems to be a theme in some of the more scientific 'skeptic' approaches - build a model (which doesn't match reality), then make claims contrary to the consensus only supported by that (poor) model. We see it here with Tisdale - other examples include both Spencer and Lindzen on climate sensitivity and feedbacks, and many skeptic temperature predictions. Bad models lead to incorrect conclusions - Kevin C's two-lag model including volcanic forcing is demonstrably a better match to the data (and quite frankly to the physics) than anything so far presented by Tisdale. -
Kevin C at 02:45 AM on 7 December 2012DIY climate science: The Instrumental Temperature Record
Note: The CSV download button is currently not working. As far as I am aware everything else is fine. A fix is on its way to John Cook. I'll update this comment once it's fixed.Now fixed, thanks Doug! -
The Greenhouse Gas Effect All-Star Fan Club
Steve CaseWhat you've done is set up a straw man argument implying that skeptics dispute that the greenhouse effect is real, but you provided no supporting evidence.
There are entire organizations based upon denying the greenhouse effect, devoting themselves to writing self-approved polemics on their points of view and (mis)labeling them science. The comment threads at sites such as JoNova, WUWT, Curry's blog, and elsewhere (wherein a quick Google search seems to indicate that you visit all of those forums) are filled with statements of denial - and the owners of those blogs simply don't call their posters on the errors. And now you claim there is no evidence of this denial??? Pull the other leg, Steve - it's got bells on...Moderator Response: [DB] Mr. Case has decided to recuse himself from further participation in this venue. Apologies for the distraction. -
JoeT at 02:03 AM on 7 December 2012The Greenhouse Gas Effect All-Star Fan Club
And just to show that not all the denialism is on the right, here is the recently deceased Alexander Cockburn using "the greenhouse effect violates the 2nd law of thermodynamics argument" plus a whole slew of other denier talking points. -
Phil at 01:34 AM on 7 December 2012The Greenhouse Gas Effect All-Star Fan Club
Steve Case @30 Here is a denier that disputes the greenhouse effect. -
vrooomie at 01:03 AM on 7 December 2012The Greenhouse Gas Effect All-Star Fan Club
In the vernacular of the young folk, and in response to DSL's pointng out the 1421 comments on the 2nd law page... OMG!!! I thought I'd found the SkS thread with the msot posts, but nooooo, I had not. Good grief, talk about a textbook example of D-K, write large...;( -
DSL at 00:32 AM on 7 December 2012The Greenhouse Gas Effect All-Star Fan Club
Chris G: "So, a coworker the other day showed me the Rose article on there being no warming for 15 years." And of course the great irony is that the claim is actually a strong argument in favor of warming. If one starts at the top of a mountain (1997/1998 El Nino), one expects to walk downhill. That didn't happen, even if the warming is slightly less than significant using carefully chosen start points within the least representative L-O series. --- You're right, Steve, because there are only 1421 comments on the 2nd Law thread. No self-described "skeptics" could possibly have contributed. -
curiousd at 00:01 AM on 7 December 2012CO2 effect is saturated
Thanks again, Tom Curtis. Especially new to me is that at present, aerosols are close to offsetting the GHG effect other than CO2. Also, the good news that presently, were there to be no more CO2 emissions, CO2 should decrease enough to about cancel the rate at which the "other shoe" warming takes place. I presume - since you did not comment - that you agree with my post 181 that the results of Chen et al experimentally prove that the standard science of the CO2 greenhouse effect is correct and therefore indeed roughly every doubling of CO2 creates the same increase in temperature (about 1.2 degrees C), due to CO2 alone, with no feedbacks included? -
chriskoz at 23:07 PM on 6 December 20122012 SkS Bi-Weekly News Roundup #7
Missing link to US Obstructive Force at Climate Talks. I wonder why we are witnessing the repeat of Kyoto today. How is it possible that the political will of developped states essentially did not change in all those years, despite the science (and GW sympthoms) moving ahead and even denialist abandoning their hardcore stances as we reported recently here...Moderator Response: [JH] Link inserted. Thanks for bringing this to our attention.
Prev 1011 1012 1013 1014 1015 1016 1017 1018 1019 1020 1021 1022 1023 1024 1025 1026 Next


