


 Arguments


Recent Comments
Prev 1012 1013 1014 1015 1016 1017 1018 1019 1020 1021 1022 1023 1024 1025 1026 1027 Next
Comments 50951 to 51000:
-
Bernard J. at 08:14 AM on 16 January 2013Resolving Confusion Over the Met Office Statement and Continued Global Warming
Smerby. If you "look at graphed variables for a living" you should be able to understand the magnitude of the noise versus the overall signal, and understand the length of time required for signal to emerge from noise. The decade intervals that you insist on considering are far too short for signal to emerge from noise. This point has been made so frequently on this post and on others that one wonders if you are deliberately ignoring it - the only other explanation is that you don't require any statistical strigency when you "look at graphed variables for a living"... -
smerby at 08:02 AM on 16 January 2013Resolving Confusion Over the Met Office Statement and Continued Global Warming
Hi All, thanks again for the feedback and I am learning more each day. I dig the optical illusions but they are much different than a temperature graph showing global surface temperatures for past 130 odd years. At least to me they are. I look at graphed variables for a living and can pick out trends by sight and be pretty confident about it. I also agree that it is just as important to run a statistical analysis. I ran a linear regression for the last 10 years. Other than the UAH showing an insignificant amount of warming, the other data sets clearly show no surface warming for the last 10 years. This supports my first claim but it won't mean a thing if global surface temperatures start trending up again over the next 10 years. I also did a 10, 20, and 30 year regression of the last 30 years GIS global sfc temperatures and the 20 and 30 showed pronounced warming as expected. Something different has been happening for the past 10 years. What is causing this? Could it be build up of heat in the deeper oceans, the cold PDO buffering El Ninos, aerosols from India and China? Will the lack of global surface warming continue or is it just a temporary bump in the road. What do you all think?
 Moderator Response: [RH] Fixed image width.
 -
pekka.lehtikoski at 06:57 AM on 16 January 201316 ^ more years of global warming
Climate warming caused by human activity (CO2) may not be the worst long term problem. Public perception of need to limit CO2 emissions, has lead to demand and acceptance of alternate energy production. Nicely this would mean wind, solar, etc, just these not yet cost efficient enough for a normal person to pay for. Practically this means rebirth of fission. About 63 new fission reactors are currently in construction, and many more projects have been approved (source: internet, reliability: uncertain). Using fission may have much longer lasting ill effects to future life than burning fossil fuels. -
StBarnabas at 06:45 AM on 16 January 20132012 Shatters the US Temperature Record. Fox, Watts, and Spencer Respond by Denying Reality
Cornelius @23 The Express is below my radar. Even further in the gutter than the mail. The UK system is by no means perfect! I thought Corbyn had lost credibility years ago, still a colourful character. Should have taken up Astrology -
villabolo at 06:41 AM on 16 January 20132012 Shatters the US Temperature Record. Fox, Watts, and Spencer Respond by Denying Reality
Somewhat off topic but it was mentioned in the article - what's Steven Goddard's real name? -
Cornelius Breadbasket at 06:09 AM on 16 January 20132012 Shatters the US Temperature Record. Fox, Watts, and Spencer Respond by Denying Reality
StBarnabas @22 If you make a complaint against the Express, you get nowhere because they have opted out of the Press Complaints Committee. I know - I've tried. Basically they can say what they think will sell, as long as the people that they are being libellous about won't or can't sue. The Express is the biggest climate denial newspaper in the UK, regularly attacking the Met Office and the IPCC. They buy their weather forecasts from Piers Corbyn. How I wish that Skeptical Science would do a feature about him. -
StBarnabas at 05:22 AM on 16 January 20132012 Shatters the US Temperature Record. Fox, Watts, and Spencer Respond by Denying Reality
@dana1981 The US has become a crazy place. Seemed a lot more sensible when I was doing my PhD there (Carter was president). The Arke and Wilson vs Fox case is simply extraordinary. It seems Not only can Fox lie and distort the truth It can force reporters to do so against their will Fire them if they refuse And Fox can be awarded damages if they try to take it to court for unfair dismissal Makes me glad I returned to Europe! Here if the Mail is found to lie there will be a retraction in small print in some obscure part of the newspaper. -
vrooomie at 04:25 AM on 16 January 2013Ocean Heat Came Back to Haunt Australia
Thank you, Rob, for the clarification. I'd missed that memo, somewheres! -
Rob Painting at 04:23 AM on 16 January 2013Ocean Heat Came Back to Haunt Australia
vroomie - it's 2 HB's over the 50-year period, rising to about 4 in the last 16 years. We're referencing different time periods, and the value has increased moving forward in time. -
Chris G at 04:19 AM on 16 January 20132012 Shatters the US Temperature Record. Fox, Watts, and Spencer Respond by Denying Reality
John Brookes, I lost interest in what Watts had to say some time ago, but the fact remains that there are many who do still care, and what they think has an effect on the future we all share. So, in that sense, having someone continue to correct Watts' misinformation is useful, necessary even. -
vrooomie at 04:10 AM on 16 January 2013Ocean Heat Came Back to Haunt Australia
I've read 2 HB/S, and 4 HB/S, on here....should we standardize the amount? -
Chris G at 02:50 AM on 16 January 20132012 Shatters the US Temperature Record. Fox, Watts, and Spencer Respond by Denying Reality
Roger D, I think the operative description is, “Although many of us may think of ourselves as thinking creatures that feel, biologically we are feeling creatures that think” ― Jill Bolte Taylor, My Stroke of Insight: A Brain Scientist's Personal Journey Despite efforts to train in logic, math, etc., the brain is not a deterministic automaton; the same input is not guaranteed to produce the same results. I think it is common for people to not be aware of when the emotional aspects of their minds block information, or block recognition of conflicting information. Even when a conflict is pointed out by someone else, a common response is to form the believe that the other person simply doesn't understand the situation as well as you do. It can be difficult to know when another is aware of what they are doing. -
winfield100 at 01:49 AM on 16 January 2013Putting an End to the Myth that Renewable Energy is too Expensive
oops, it was August 2003 article is at http://asrc.albany.edu/people/faculty/perez/directory/LoadMatch.html detailing how the blackout may have been able to be averted. on the page look for 2004 article, pdf -
winfield100 at 01:11 AM on 16 January 2013Putting an End to the Myth that Renewable Energy is too Expensive
realize this is somewhat relevant. August blackout in NE USA, (2004) 10,500Mw on 3 trunk lines, one line got hot and sagged to point where hit tree or something and melted. If had 500Mw of distributed PV, would not have had blackout (cost at that time appx $5 billion US dollars ). damages of blackout somewhere between 8-11 Billion US dollars AND the distributedPV would have been producing still. http://asrc.albany.edu/people/faculty/perez/ related case in point. One US company is on track to have installed base of about ->450Mw<- of distributed PV by renting rooftops and using solar REC's (renewable energy credits)by end of 2013. additionally, the folks have LOWER electricity prices with the rented rooftop PV and get first use of the electrons so there is little or no distribution loss and at least a few in the Washignton DC area use the electrons to power their EV's. hopefully the suits will win out over ALEC and Heartland -
Tristan at 00:06 AM on 16 January 20132013 SkS Weekly Digest #2
Tom, that's a lucid description of the playing field and perhaps something SkS should have an article about. However, there have been and will continue to be 'debates' in the public arena whether it's fair or sensible or not. It's not impossible to beat the Gish gallop. Make a wry comment about the torrent of verbiage and then pick your target. If what people hear is a confident, comfortable response with a bit of pith and some pointed queries fired back, they will feel a lot less impressed by the initial deluge. "Well, as I've been given a range of misapprahensions to respond to I'll pick the one that relates to my area of research" Or, ignore the gallop altogether and just attack back. "Wow Jim, I just counted 7 baloney factoids in that 45 second outburst. Ya see Jim, all of this is just a smokescreen to try to disguise that they can't account for this simple fact" *Cue Kevin C's demonstration* -
Tom Curtis at 22:59 PM on 15 January 20132013 SkS Weekly Digest #2
Tristan @2, the problem with verbal debates is that the denier and the scientist come to it with different objectives. The scientist wishes to establish and communicate the truth. The denier simply wants to not be refuted. A draw, where the audience goes away thinking both sides made good points, is a win for the denier for it means they have established in the audiences mind that there is still a scientific controversy about global warming, even though in fact the issues he raised are uncontroversially false. Hence the effectiveness of the Gish gallop. The denier feels no need to support their claims because they are not there to establish or communicate the truth. They are happy to make a string of false, often egregiously false claims, with out support. Meanwhile the scientist must, by training and by their disciplinary ethical standards restrict themselves to a small number of claims that they can clearly establish. The result? The audience gets the impression that the scientist only has a few pieces of evidence in their favour, while the denier has vast amounts of evidence in their favour. Alternatively, the scientist may attempt to refute some of the deniers points. In that case, because a lie can be said in a few words, but requires many words to rebut, the denier is left with (apparently) many unrefuted points in their favour. So, if you are going to have a verbal debate with deniers, the proper tactic is don't. And if you are fool enough to ignore that advice, you don't need somebody competent at explaining science so much as somebody expert at showing their opponent is bullshitting. If you are fool enough to give credibility to a deniers stunt debate, don't get a scientist to debate on your side. Get a good lawyer. -
Tristan at 22:32 PM on 15 January 20132013 SkS Weekly Digest #2
Michael, I don't dispute any of that, but my questions still stand :) -
Bernard J. at 22:16 PM on 15 January 2013Resolving Confusion Over the Met Office Statement and Continued Global Warming
Smerby. Philippe Chantreau and Dikran Marsupial have both told you how visual assessment is not a reliable way to "test". Lest you have any lingering doubt about this, I will offer some empirical evidence:
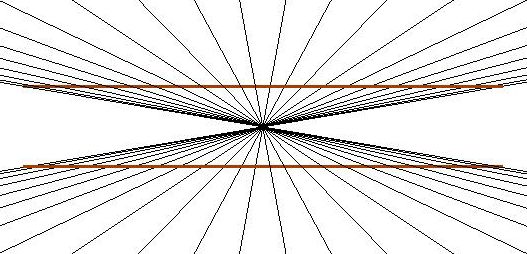


 (Be sure to follow the link to the source page, and check out the first link there, titled "Here comes another seizure"...)

 I apologise profusely for the liberal inclusion of the above images, but it seems that too many people are blithely unaware of just how much our "lying" eyes mislead our minds.
If ever someone thinks that they can just scan a graph and objectively analyse its data and particularly the trends described therein, they should have another look above. Most especially if they have no expert or other professional familiarity with the mathematical structure of the data they choose to "test" with their eyes...
I apologise profusely for the liberal inclusion of the above images, but it seems that too many people are blithely unaware of just how much our "lying" eyes mislead our minds.
If ever someone thinks that they can just scan a graph and objectively analyse its data and particularly the trends described therein, they should have another look above. Most especially if they have no expert or other professional familiarity with the mathematical structure of the data they choose to "test" with their eyes...
-
Cornelius Breadbasket at 21:57 PM on 15 January 20132012 Shatters the US Temperature Record. Fox, Watts, and Spencer Respond by Denying Reality
Erm - that should be "POOF!" -
Cornelius Breadbasket at 21:55 PM on 15 January 20132012 Shatters the US Temperature Record. Fox, Watts, and Spencer Respond by Denying Reality
 goes another contrarian argument.
-
michael sweet at 20:53 PM on 15 January 20132013 SkS Weekly Digest #2
Tristan, Dana does a terrific job here at SkS. Scientists debate in writing. If you want someone to verbally challenge the deniers you need to find someone who is skillful at replying to Gish Gallops. It is not necessary to blow away people with expertise in an oral debate. People cannot confirm lies orally so science often loses. -
John Brookes at 20:06 PM on 15 January 20132012 Shatters the US Temperature Record. Fox, Watts, and Spencer Respond by Denying Reality
Given his history, why do we still care what Watts says? The time has come to stop listening to him and his fellow denialists. -
Tristan at 18:37 PM on 15 January 20132013 SkS Weekly Digest #2
In the opinion of those with some knowledge on the matter: Who would you pick to debate climate change for Team Science? A slightly different question: Who, in the climate science community, blows your mind with their expertise? -
Tom Curtis at 17:48 PM on 15 January 20132012 Shatters the US Temperature Record. Fox, Watts, and Spencer Respond by Denying Reality
dana @15, I beg to differ. The more recent blogpost blames 50% of the heating on industrial waste heat; which has the advantage that it is not necessarily confined to urban centers, and hence cannot be shot down by the fact that the warming shows in the satellite record. Of course, to set up his argument he must assume that all air over the continental United States remains permanently over the continental United States (so that the industrial heat is not dispersed); that industrial waste heat is always in excess of any heat dissipation to space, regardless of how hot the Earth is; and, either that physics is different over the CONUS, so that the greenhouse warming present everywhere else has no impact over the CONUS, or that there are large hidden industrial centers in the North Pole to explain the massive heating there. (I told Santa that robot factories powered by nuclear power stations was a mistake.) I can only assume the motivation of the blog was a desire to dine at Milliways. -
dana1981 at 15:10 PM on 15 January 20132012 Shatters the US Temperature Record. Fox, Watts, and Spencer Respond by Denying Reality
WheelsOC #14 - right on cue, Spencer has a blog post today again trying to blame global warming on the UHI effect. -
WheelsOC at 14:57 PM on 15 January 20132012 Shatters the US Temperature Record. Fox, Watts, and Spencer Respond by Denying Reality
This isn't the first time Spencer has complained about supposed problems with a surface record while ignoring the excellent match it gave to his satellite lower troposphere record. Last year he was on about population density and the UHI effect, pretending that a growing population was responsible for the trend in the surface data. It was pointed out back then (first comment on his post, in fact) that the UAH satellite record independently confirms the NCDC's instrumental record, and that he was getting a different answer with his own population-based "adjustments" because his adjustments were wrong. He couldn't formulate a response, it seems. Now he appears to be cycling through the whole "adjustments!" phase of denialist objections. He's always trying to revise other people's records downwards. Perhaps he should ask himself why his lower troposphere data should be warming an order of magnitude faster than the Earth below it before striking out on any new endeavor to fiddle with other data sets. -
sol6966 at 13:19 PM on 15 January 20132012 Shatters the US Temperature Record. Fox, Watts, and Spencer Respond by Denying Reality
I think the reason deniers want to discredit this record is because it cuts the legs out from under the "1934 is the hottest year on record" myth. The myth rebutal for "1934 is the hottest year on record" now needs to be updated with this new record. -
villabolo at 12:13 PM on 15 January 20132012 Shatters the US Temperature Record. Fox, Watts, and Spencer Respond by Denying Reality
Roger D @#10, "It seems to me there has to be something "interesting" going on psychologically with the thought processes of the Watts and Spencers of the world." Denial is a thought process. Not a rational one but still it involves thinking. "...cheered on by people that don’t really care about the science but just don’t want to believe there is a problem..." They are the same as the people who cheer them on. The only difference is in the role they play in the game of deception. "At least according to this hypothesis they are not bad people." Hannah Arendt's saying about the banality of evil comes to mind. -
Jonas at 11:46 AM on 15 January 2013Dark matter for Greenland melting
I just supported the above mentioned http://darksnowproject.org -
Roger D at 10:19 AM on 15 January 20132012 Shatters the US Temperature Record. Fox, Watts, and Spencer Respond by Denying Reality
by "this response" I mean dana1981's post, not my comment -
Roger D at 10:15 AM on 15 January 20132012 Shatters the US Temperature Record. Fox, Watts, and Spencer Respond by Denying Reality
It seems to me there has to be something "interesting" going on psychologically with the thought processes of the Watts and Spencers of the world. Being intelligent people they must know how disingenuous their anti-mainstream-climate science arguments appear when they are completely dismantled (as in this response to their claims). Maybe after walking themselves out on the climate change denial plank to such an extent, and finding no face-saving way to stop, cheered on by people that don’t really care about the science but just don’t want to believe there is a problem, they can only hope for a miracle (mainstream science somehow "missed something" and it’s not going to be that bad, etc). At least according to this hypothesis they are not bad people. -
Riduna at 09:59 AM on 15 January 2013Met Office decadal forecasting explained: the reality
An informative article which asks: Does predicted cooling in the NW Atlantic (and NE Pacific) indicate change in ocean currents? Possible – but possibly this arises from predicted warming in the Arctic and consequent loss of land-based and sea ice producing cold water flowing into the northern Pacific and Atlantic Oceans before sinking? -
yocta at 09:51 AM on 15 January 2013Skeptical Science Upgrade
Hooray it finally works in Opera without the comments getting all muddled up! -
Tom Curtis at 09:46 AM on 15 January 20132012 Shatters the US Temperature Record. Fox, Watts, and Spencer Respond by Denying Reality
OzDoc @8, he is a TV weather man, which means he is a (broadcast) meteorologist, and holds an American Meterological Society Seal (retired) to prove it. He studied meteorology and electrical engineering at Purdue University, but did not graduate. Make of that what you will. -
OzDoc at 09:05 AM on 15 January 20132012 Shatters the US Temperature Record. Fox, Watts, and Spencer Respond by Denying Reality
One minor quibble: Anthony Watts (a blogger and meteorologist) He might think he is a meteorologist, but you guys? I don't think so. -
Tom Curtis at 08:11 AM on 15 January 20132012: The Year Climate Change Got Real
philipm @3, Australia's mean maximum temperature for the first eight days of 2013 exceeded the prior record (set in 1972) just once January 7th, when it exceeded the prior record by 0.13 degrees C. On January 8th, the mean national maximum temperature reached 40.1 C, 0.07 C less than the prior record. All other days in the heat wave period have been approx 0.5-1 degree C less than the prior record, although all are in the top twenty mean national maximum temperature records. Although a number of records have fallen to this heat wave, no the National maximum temperature record (50.7 C, Oodnadatta, South Australia (1960) did not fall, and neither has any state records. The forecast above 50 degree heat that required adding extra colours to the the forecast temperature scale was made for six and seven day forecasts, ie, at the limit of skill. They did not eventuate. I do not know of the temperature exceeding 50 degree C anywhere in Australia in 2013, and certainly if it did so it did not exceed the record temperature at the location where it did (as none of the many new records set exceed 50 degrees C). So, while it certainly has been exceptionally hot in Australia, and global warming has probably contributed appreciably to that heat, the heat is not outside the range that prior natural variability would lead us to expect. The take home form the Australian heatwave of January 2013 is not that it proves global warming (it does not), or even that it provides substantial evidence for global warming (it provides evidence, but very minor evidence relative to other evidence available), but that it is a foretaste of the type of heatwave that will be common by mid-century, and typical, possibly even cool conditions by the end of the century, with continued global warming. It is a wake up call that global warming has consequences. -
michael sweet at 07:33 AM on 15 January 20132012 Shatters the US Temperature Record. Fox, Watts, and Spencer Respond by Denying Reality
Watts often uses data from different sources to support his arguments. Last summer he compared IMS sea ice extent, which is defined as all extent with detected ice, and compared it to NCDC Sea Ice extent, defined as all extent containing greater than 15% ice, to argue a new extent record had not been set. In the end it did not matter, even the all ice extent was much lower than the previous 15% extent. The NCDC commented and tried to explain the problem but Watts refused to acknowledge that he had made a mistake. -
Daniel Bailey at 06:42 AM on 15 January 2013Monckton Myth #2: Temperature records, trends and El Nino
Philip, Figure 1 lists the datasets used to compile this post: HadCRUT V3 (1850-2010) Gistemp Global Land-Ocean Temperature Index (1880-2010) NOAA Global Land+Ocean (1880-2010) RSS MSU AMSU TLT Land+Ocean (1978-2010) UAH MSU AMSU T2LT Land+Ocean (1979-2010) NCEP/NCAR Reanalysis 1 (1948-2010) NCEP Climate Forecast System Reanalysis (CFSR) (1979-2009) NCEP/NCAR Twentieth Century Reanalysis V2 (1871-2008) ECMWF ERA-40 (1957-2002) ECMWF ERA-Interm (1989-2010) Note: Some of the above links seem to no longer work, as perhaps the files were moved on their hosted servers. Anyone having the actual links, please post them. -
Philip Shehan at 06:19 AM on 15 January 2013Monckton Myth #2: Temperature records, trends and El Nino
Not sure if anyone is listening after 2 years but I have been arguing with characters who dispute the "provenance" of what one of them call "John Cook's hand drawn cartoon" (Figure 1). Could Robert tell me what the function fitting the temperature data is? -
dana1981 at 06:12 AM on 15 January 20132012 Shatters the US Temperature Record. Fox, Watts, and Spencer Respond by Denying Reality
StBarnabas - we're pretty big on free speech in the USA. It's pretty hard to say anything bad enough to lose a lawsuit over. As a result, it seems like the UK and Australia hold their media to a higher standard of factual accuracy than we do, from what I've seen. There's plenty of garbage in the media in those countries, but at least the offenders tend to get slapped on the wrist when their articles are blatantly factually wrong. -
Bob Loblaw at 05:51 AM on 15 January 2013Resolving Confusion Over the Met Office Statement and Continued Global Warming
smerby: What sort of cycles does your eyecrometer identify in the following sequence of (x,y) data points, and what y-value do you predict for x=11? (1,2) (2,7) (3,1) (4,8) (5,2) (6,8) (7,1) (8,8) (9,2) (10,8) Hint: it's not 1 or 2. Can you predict the next value of y to within 1, using cycles? The origin of the sequence is well-known and understood, so it is exactly predictable with a correct model. Answer is in Ray Ladbury's recent comment over at RealClimate, where I have gratuitously stolen the example. -
StBarnabas at 05:51 AM on 15 January 20132012 Shatters the US Temperature Record. Fox, Watts, and Spencer Respond by Denying Reality
Great post as usual I am full of admiration and very well done. I am aware that freedom of speech is of paramount importance in the US, but is there no law to stop these contrarians from peddling their lies and defaming scientists? Presumably they have very clever lawyers who vet their statements very carefully? Possibly the good news is that they look increasingly idiotic? Big oil will loose trillions of dollars in unusable reserves if climate change is accepted, so it's not surprising they will use any weapon to discredit AGM. Sorry rant over! StB -
JCSmith0007 at 05:16 AM on 15 January 20132012 Shatters the US Temperature Record. Fox, Watts, and Spencer Respond by Denying Reality
I am happy to see that you have called them out for their lies. This is a very long "battle" that society will have to fight against human induced global warming. It doesn't make it any easier when we have people/organizations such as Watts, FOX, Heartland, Bastardi, and others that don't have any qualms about openly lying. They need to be called out..... "The truth is incontrovertible. Malice may attack it, ignorance may deride it, but in the end, there it is." Winston Churchill...Moderator Response: [RH] Please avoid all caps (changed to italics). -
CBDunkerson at 04:32 AM on 15 January 2013CO2 limits will harm the economy
Mal Adapted wrote: "If they were, we'd all be paying much more for heat, electricity and transport already" We do already pay much more for these things... we just pay the extra costs in taxes that go to the subsidies, healthcare costs, food costs, water costs, wars, increased natural disaster cleanup, et cetera. If we switched to renewable energy we might be paying more for the upfront cost of energy (though even that isn't certain), but the total cost would be much much less... so we'd have more money available... so the 'impact' to the economy would be positive. And hence no, "radically reordering our economic and political systems" (aka 'we must declare martial law and abandon all technology!'). "And at least in the early stages of transition to sustainability, without some kind of assistance the poorest may actually freeze to death in the dark -- at infinite cost to them." Who did you think it was dying from AGW, food prices, water prices, wars, pollution, et cetera now? The rich? -
Flakmeister at 04:30 AM on 15 January 20132012 Shatters the US Temperature Record. Fox, Watts, and Spencer Respond by Denying Reality
Lars: In case you have not noticed only a token few now serve time for fraudulent behaviour in the financial world... The term is "Too big to jail"... -
Lars Karlsson at 04:23 AM on 15 January 20132012 Shatters the US Temperature Record. Fox, Watts, and Spencer Respond by Denying Reality
Watts: "In the business and trading world, people go to jail for such manipulations of data." I believe libel is a crime. -
A Brief Note on the Latest Release of Draft IPCC Documents
Mal Adapted - I have replied on the more appropriate economic impacts of carbon pricing thread. -
CO2 limits will harm the economy
Mal Adapted - We are already paying the external costs of fossil fuels, in health and environmental damage. Shifting those costs to the producers, as with a carbon tax, does not subtract the value from the economy twice. To use your phrasing, there is no such thing as a free lunch - but approaches such as carbon tax don't mean you have to pay for two of them... Adaptation to climate change (with Business As Usual/BAU) will by conservative estimates cost 10x what mitigating additional CO2 now will, (by, for example, shifting those costs to the producers, hence providing incentive to move to renewables). If we want to minimize economic damage, that's the approach we should take. -
dana1981 at 03:17 AM on 15 January 2013Resolving Confusion Over the Met Office Statement and Continued Global Warming
snafu @96 - naturally. Solar activity has nothing to do with GHGs, and the link between GHGs and ENSO is unclear, but by definition it's cyclical and will eventually transition to more El Niños. -
Mal Adapted at 02:45 AM on 15 January 2013A Brief Note on the Latest Release of Draft IPCC Documents
CBDunkerson:Fixing AGW requires a change from fossil fuels to renewable energy... which will actually increase overall 'buying power' because renewable energy is vastly less expensive once all the externialities are accounted for. It isn't even close.
We all know that, but the whole point is that all the externalities are not accounted for under the current production system. If they were, we'd all be paying much more for heat, electricity and transport already, ignoring for the moment the energy cost of producing everything else. But when, as will be required for long-term global sustainability, all costs of production of goods and service are internalized, we will pay more for everything. And at least in the early stages of transition to sustainability, without some kind of assistance the poorest may actually freeze to death in the dark -- at infinite cost to them. Surely you understand that's what "internalizing the externalities" means! Nobody's mentioned it yet so it may not need to be, but simply substituting human for natural capital won't much affect the final result. To be sure, under proposed as well as existing systems there is room for human creativity ("working smarter, not harder") to improve productivity. But there will be costs to that too of course, and why would we keep those external? Too, production systems that are now energy intensive can become more labor-intensive (we can all work smarter and harder), but that cost can no more be kept external than any other. CBDunkerson, this isn't a rhetorical argument, but one founded on thermodynamics as Bernard J. says. It's not just a glibertarian catch-phrase: there really is no such thing as a free lunch. We can't call ourselves realists unless we accept that. BTW -- Moderators: should this thread move elsewhere?
Prev 1012 1013 1014 1015 1016 1017 1018 1019 1020 1021 1022 1023 1024 1025 1026 1027 Next


