


 Arguments


Recent Comments
Prev 1016 1017 1018 1019 1020 1021 1022 1023 1024 1025 1026 1027 1028 1029 1030 1031 Next
Comments 51151 to 51200:
-
Composer99 at 03:45 AM on 30 November 2012Rahmstorf et al. Validate IPCC Temperature Projections, Find Sea Level Rise Underestimated
From the OP:[...] while their central sea level rise predictions were too low by about 60%.
Well, that's reassuring. -
IanC at 03:16 AM on 30 November 2012It's El Niño
Bob, I already said the issues you raised on the PDO index is a red herring, why are you repeating it again? If you really want to save me time, just quit stalling and repeating the same wrong argument the forth time (actually fifth when you post again). Is there an inter-decadal basin wide variability in the Pacific that can explain the lack of warming in the east? "for almost 4 years, I’ve been answering the same questions and responding to the same comments you’ve presented here. There’s nothing new about your questions and comments. Somewhere along the line, I’ve answered them, and for most of them, I can simply cut and paste a paragraph from my book." Then it shouldn't take you long to give satisfactory answers (i.e. with references to journal articles) to my questions? There is actually another question that is crucial to us answering your first question. As Tom noticed, the warming rate depends on the starting date. To make that more precise, I've taken the SSTA of the E Pacific (as you defined it) HADISST, and applied a 10 year low pass filter (this gives the same result as a 121 month running filter). Here's the plot. So here's the second question. Where is the evidence of a lack of warming in the east pacific ? It appears that your question is invalid in the first place.
As soon as you give a satisfactory answer to these two, I'll be happy to move the discussion to your the second question.
So here's the second question. Where is the evidence of a lack of warming in the east pacific ? It appears that your question is invalid in the first place.
As soon as you give a satisfactory answer to these two, I'll be happy to move the discussion to your the second question.
-
Kevin C at 02:41 AM on 30 November 2012It's El Niño
I don't want to distract from John and Tom's question above, but I now have a full answer to the Figure 13 question. The bulk of the discrepancy between Nino34 arises from the use of a simple lag to shift the Nino34 index relative to the time series. If an exponential lag function (period=0.14y) is used rather than a simple time shift a much better fit is obtained. Adding in the SH SATO with an exponential lag (period=0.8y) mops up most of the rest of the difference between the two curves. Will post graphs and code tomorrow. -
Tom Dayton at 02:07 AM on 30 November 2012It's El Niño
Until now I've refrained from commenting on Bob Tisdale's stuff, because I assumed the reason I could see no relevance at all to global warming was my inadequate knowledge. But Bob's subsequent explanations still leave me baffled as to the relevance to global warming. Bob Tisdale, please respond simply and briefly to John Hartz's pointed question. -
John Hartz at 01:12 AM on 30 November 2012It's El Niño
@ Bob Tisdale: Once again... Do you agree, or disagree with the following statement? “Naturally occurring climate variability due to phenomena such as El Niño and La Niña impact on temperatures and precipitation on a seasonal to annual scale. But they do not alter the underlying long-term trend of rising temperatures due to climate change as a result of human activities,” said WMO Secretary-General Michel Jarraud. Source:2012: Record Arctic Sea Ice Melt, Multiple Extremes and High Temperatures, WMO Press Release No 966, Nov 28, 2012 -
Composer99 at 00:00 AM on 30 November 2012It's El Niño
Bob Tisdale:Unless you can explain those divergences in the sea surface temperature anomalies of the Atlantic-Indian-West Pacific during the La Niña events of 1988/89 and 1998-2001, you cannot explain why surface temperatures warmed.
Shifting burden of proof. You think the divergences matter, you support it with evidence. Re-stating your claim and re-linking to your graphs won't cut it.Are you aware that the global oceans can be divided into logical subsets which show the ocean heat content warmed naturally?
No, they can't. Ocean heat has to come from somewhere. In order for the oceans to have warmed naturally, one would have to show that (a) the current physics of atmospheric greenhouse gases is wrong, and (b) some other, hitherto unknown, source of energy must be inputting enormous amounts of heat into the oceans. It just won't happen on its own, however many (or few) "logical subsets" you divide the global ocean into. It seems to me, Bob, that you are engaged in a fallacy of composition, a rather typical one observed among climate pseudoskeptics. The aggregate of global SST/OHC data will show different behaviour than any given single subset, with increased variance (noise) as you look at increasingly finer resolutions. That's why you need to look at global data to work out the global signal.What’s causing those divergences? Why do they only appear during those La Niña events? Again, unless you can explain those divergences, you cannot explain why the warming in that dataset occurred.
Personally speaking, I don't know. I also don't care since these divergences do not appear to affect long-term global trends in SSTs or OHC. And, as I said (and you have no answer for, apparently), the divergences are only important if ENSO was the sole driver of SSTs. Bottom line is, it seems to me that your participation on this thread can be summed up as a series of logical fallacies: (1) Shifting burden of proof. You are the one who has identified what you suppose to be important divergences in SST behaviour from ENSO index. IMO it is up to you to show they are significant, and not up to others to show they aren't. (2) Fallacy of composition as described above. (3) Red herring (since all this talk of divergences & logical subsets appears to be an attempt to distract from the ongoing rise in SSTs and OHC). (4) Special pleading - "gatekeeping of science"? -
vrooomie at 23:54 PM on 29 November 2012Subcap Methane Feedbacks, Part 1: Fossil methane seepage in Alaska
ranyl@5, let me restate that which I clearly did not do a good enough job the first time: I agree with your take on it all. Here's what I meant: Yes, today's situation looks pretty grim, but compared to the grimness which appears to be in store for our crandchildren and beyond, looks VERY grim indeed. Somewhere I read a line that went something like this; our grandchildren, rather than enjoying their retirment, will likely be in a fight for survival. And yes, future generation are going to look back *pretty* darned unfavorably at the prior ones: heck, I do that even now, at the generations that preceded me. Two generations back had something like an "excuse" for not stewarding the planet better; my generation has little excuse for the violence it has brought down upon the biosphere. -
Kevin C at 23:39 PM on 29 November 2012It's El Niño
OK, I did a fit of the rest of the world data against global SST, Nino34, trend and intercept. Best lag was 5 weeks. Then I tried adding a quadratic term in Nino34 to the result. The best fit does indeed show non-linearity, although it's not huge. Here's the linear Nino34 (black), the quadratic term (green), and the total (blue). Stats as follows:
Coefficients:
               Estimate Std. Error t value Pr(>|t|)
(Intercept)  -5.4532649  0.3452066  -15.80  < 2e-16 ***
sst$Year      0.0027364  0.0001733   15.79  < 2e-16 ***
sst$Global    1.0384505  0.0133676   77.68  < 2e-16 ***
sst$Nino34   -0.0590088  0.0013182  -44.76  < 2e-16 ***
sst$Nino34sq  0.0052784  0.0008300    6.36 2.62e-10 ***
However, the autocorrelation in the sst data is substantial. Using an AR(1) model on the model residuals, the number of data per degree of freedom is ~16. (The actual acf suggests it needs an AR(3) model though, so it's worse than that.) That means the std errors are underestimated by at least factor of 4. so the quadratic coefficient falls short of statistical significance. Also, I think the non-linearity is in the opposite direction to Bob's suggestion. It is making the index more positive (i.e. temperature projection more negative) during 1989 and 2000. I may have that backwards though. We can reduce the error bounds by improving the fit of the model - the obvious next step will be to throw in the SH SATO data - or by using a longer time series. However improving the error model would also be desirable. -
Kevin C at 22:23 PM on 29 November 2012It's El Niño
Tom: Thanks. Bob: I don't follow your last point. From a (too quick) look at the data, it seems you are saying that the ENSO signal is localised in the SST data, and therefore that removing it globally is invalid? But I presume that is not what you are saying because that would be obviously wrong. The global SST is a linear combination (a weighted sum) of all the regional contributions. If any of the local terms contains an ENSO signal, then the global SST will also contain an ENSO signal, comprising the total of the contributions to the regional SSTs weighted by the fractional contribution of those regions to the global SST. Given that the F&R analysis determined the scale of the ENSO contribution to best fit the global temperature data, it will automatically take that into account. -
littlerobbergirl at 22:10 PM on 29 November 2012Climate of Doubt Strategy #2: Exaggerate Uncertainty
Its the bus for me too - the springfield school bus: we left the road in 1980 but nobody noticed as we sped along the gently sloping field. As it gets steeper and bumpier a few kids start to call out but are shushed by the teacher who is marking papers and has no time to look up. the driver has his earphones in and is singing 'highway to hell' at the top of his voice. We have just gone through the fence iwith the 'danger steep slope' sign on it, and some of us are screaming. Im at the back under a seat in the brace position. Sorry, not much help! -
Tom Curtis at 22:06 PM on 29 November 2012It's El Niño
Kevin C, I have just published the weekly Reynolds SST data I have been using on google docs. The original data can be found for monthly values here; for weekly values here (1980s) and here (1990s and 2000s); and for a gridded data set, here. -
Bob Tisdale at 21:56 PM on 29 November 2012It's El Niño
Composer99 says: “Why should anyone here feel obliged to respond to your nonsense?” Unless you can explain those divergences in the sea surface temperature anomalies of the Atlantic-Indian-West Pacific during the La Niña events of 1988/89 and 1998-2001, you cannot explain why surface temperatures warmed. http://bobtisdale.files.wordpress.com/2012/09/figure-13.png Composer99 says: “As far as I can see your questions are an attempt to side-step sea surface temperature trends as well as increasing ocean heat content.” Are you aware that the global oceans can be divided into logical subsets which show the ocean heat content warmed naturally? Since 1950, there have been three 3-year La Niña events. They occurred in 1954-57, 1973-76, and 1998-2001. During the multidecadal periods between those 3-year La Niñas, Ocean Heat Content cooled in the tropical Pacific (24S-24N, 120E-80W). Are you aware that the same holds true for the tropical oceans as a whole? Do you understand how the tropical Pacific warms during La Niña events? Are you aware the Ocean Heat Content for the extratropical North Pacific (24N-65N, 100E-100W) cooled from the start of the dataset until the late 1980s and then warmed in a 2-year period, and that without that 2-year warming, the Ocean Heat Content for that region would show cooling from 1955 to present? Why would anthropogenic greenhouse gas warming only occur during that 2-year period in the North Pacific and during 3-year La Niña events in the tropics. Are you aware that if you combine the tropical Pacific and Extratropical North Pacific OHC data, the data gives the appearance of a continuous warming, like the Global data, but if you isolate the two they indicate something entirely different? Composer99 says: “I mean, come on. Your graph of ‘Detrended Rest-of-World SST Data Disagrees with The Warming of SST Anomalies As Portrayed By AGW Proponents’ [SST abbreviated by me]? Of course it disagrees - you detrended the SST data.” The trends aren’t the topic of discussion in the graph. It’s the divergences during the 1988/89 and 1998-2001 La Niñas that are being discussed. Composer99 says: “As far as divergence between SST behaviour and ENSO goes, one would only expect complete agreement between SSTs and ENSO if ENSO were the sole driver of SSTs.” What’s causing those divergences? Why do they only appear during those La Niña events? Again, unless you can explain those divergences, you cannot explain why the warming in that dataset occurred. Composer99 says: “So how is one to characterize your claim ‘no one here has replied to that question from comment 40’ except as refusal, whether through inability or unwillingness, to read others' posts on this thread?” The “that question” in my statement ‘no one here has replied to that question from comment 40’ had to do with the divergences in the Rest-of-the-World data, but you quoted a statement by Tom Curtis about the East Pacific. Two different datasets, Composer99. doug_bostrom says: “Bob, please just show us how a mass (global ocean+air) can increase in temperature without energy being added to it.” I’ve never said the mass of the global oceans plus air in their entirety can increase in temperature without energy being added to it. The key word in that sentence is entirety. Where have I stated that, doug? As I noted in my reply to Composer99 above: Are you aware that the global oceans can be divided into logical subsets which show the ocean heat content warmed naturally? Since 1950, there have been three 3-year La Niña events. They occurred in 1954-57, 1973-76, and 1998-2001. During the multidecadal periods between those 3-year La Niñas, Ocean Heat Content cooled in the tropical Pacific (24S-24N, 120E-80W). Are you aware that the same holds true for the tropical oceans as a whole? Do you understand how the tropical Pacific warms during La Niña events? Are you aware the Ocean Heat Content for the extratropical North Pacific (24N-65N, 100E-100W) cooled from the start of the dataset until the late 1980s and then warmed in a 2-year period, and that without that 2-year warming, the Ocean Heat Content for that region would show cooling from 1955 to present? Why would anthropogenic greenhouse gas warming only occur during that 2-year period in the North Pacific and during 3-year La Niña events in the tropics. Are you aware that if you combine the tropical Pacific and Extratropical North Pacific OHC data, the data gives the appearance of a continuous warming, like the Global data, but if you isolate the two they indicate something entirely different? On the other hand, are you aware of teleconnections? Are you aware that there’s no heat transfer with teleconnections? Example: Why do the tropical North Atlantic sea surface temperature anomalies warm during an El Nino, doug? Do you know? There’s no direct exchange of heat yet the tropical North Atlantic warms during an El Niño. Why, doug? Could it have something to do with the slowing of the trade winds in the tropical North Atlantic in response to the El Niño? That would result in less evaporation, which is the primary way the oceans release heat. If there’s less evaporation, sea surface temperatures warm, do they not? Also, when the trade winds slow in the tropical North Atlantic in response to an El Niño, there’s less upwelling of cool waters from below the surface and less entrainment of that cool subsurface water. That would cause the seas surface temperatures to warm too. IanC says: “Whether PDO index is abstract is irrelevant, and frankly your complaints about the index are just red-herrings.” It’s not irrelevant. As I noted earlier, the PDO does not represent the sea surface temperature of the North Pacific, the Pacific basin as a whole, or the East Pacific. Here’s a graph that compares the decadal variability of the PDO and the detrended and standardized sea surface temperature anomalies of the East Pacific, North Pacific (north of 20N, same as the PDO), and the Pacific as a whole: http://i49.tinypic.com/slhb8y.jpg I was trying to save you some time. So why not move onto the Rest-of-the-World data and explain why those divergences exist during the La Niña events of 1988/89 and 1998-2001? http://bobtisdale.files.wordpress.com/2012/09/figure-13.png Obviously, the ENSO index, all ENSO indices, fail to account for a portion of ENSO. What is it, IanC? With respect to the other questions and comments: for almost 4 years, I’ve been answering the same questions and responding to the same comments you’ve presented here. There’s nothing new about your questions and comments. Somewhere along the line, I’ve answered them, and for most of them, I can simply cut and paste a paragraph from my book. But you have to be able to answer the last question I asked you. Why do the sea surface temperature anomalies of the detrended Atlantic-Indian-West Pacific (Rest of the World, with the coordinate of 90S-90N, 80W-180) diverge from the scaled ENSO index during the 1988/89 and 1998-2001 La Niña events? If you all can’t answer that question, there’s no reason for us to proceed. Also, when you’ve determined the answer to that question, you’ll likely have determined the answers for many of your other questions. Regards PS: Tom Curtis, thanks for your statistical analyses in comment 80. But you seemed have overlooked something. If you’re so concerned about the statistical significance of the East Pacific and the large standard deviation of that dataset, then why not simply remove the ENSO and volcano signals from the East Pacific data? The primary assumption behind Foster and Rahmstorf and Rahmstorf et al 2012 is that you can remove those signals to provide a better CO2-driven global warming signal. In fact, the East Pacific is the only sea surface temperature subset where you could hope to remove the ENSO signal without leaving significant ENSO residuals. You can’t remove the ENSO signal from the Rest-of-the-World data (90S-90N, 80W-180) without something very obvious occurring? Try it for both datasets, the East Pacific and the Rest-of-the-World. See how it changes your results and opinions. -
Kevin C at 21:11 PM on 29 November 2012It's El Niño
Call me a data analysis nerd, but I'm actually interested in doing some analysis on Bob's figure 13 here. I can easily test whether the case of a non-linearity between Nino3.4 and SST and whether it is statisyically significant. I suspect a regression to take out the SH component of SATO will be helpful. If these check out, the next step would be to look for a longer time series - it too easy to fool yourself on only two events. I'm rather busy at the moment though, so while the analysis is quick I don't have time to dig for the data. Does anyone have it to hand and can put it on a file drop? (Tom - is that the data you have?) ... In terms of where to go with this, you can always narrow down where to look by having a mechanism in mind. Here's a brain dump for future reference: 1. What is the mechanism linking SST to ENSO? Without one, there is no reason to suggest a linear relation except the empirical observation. So no conclusion to be drawn if it is not linear. 2. Obviously, volcanoes -> forcing -> SST. The SH SATO data looks better than the global. Makes sense, most ocean in the SH. 3. Hypothesis: ENSO -> clouds -> forcing -> SST. Review literature on ENSO and clouds. Look at the MODIS data. 4. Hypothesis: ENSO -> temperature -> lapse rate feedback -> temperature. How to test this? OLR? This is all interesting, but I don't see how any of it relates to climate change though. The stable climate state could follow a jump-recovery cycle. When warming is superimposed this turns into steps, but the steps have no meaning with respect to warming. Basically a restatement of Tom's result. -
ajki at 18:59 PM on 29 November 20122012 SkS Bi-Weekly News Roundup #5
There's something wrong with the link of the "Impact of Melting Permafrost" topic. Should be corrected to: http://www.mcclatchydc.com/2012/11/27/175701/climate-talks-must-consider-impact.htmlModerator Response: [JH] Link fixed. Thanks for bringing this to out attention. -
chriskoz at 18:50 PM on 29 November 2012Subcap Methane Feedbacks, Part 1: Fossil methane seepage in Alaska
David Archer has mentioned that warming ocean releases C at the end of glacial cycles in Pleistocene, and that we don't know the precise mechanism of this phenomenon which ultimately sparks the interglacials. At least that's the state of David's teachings few years ago (2006 in his "Understanding the Forecast" book). I wonder, if given those recent studies about methane seepage through thawing permafrost, we might now point the mechanism of said carbon release. As the permafrost warms (more than the rest of the globe through arcgtic amplification) so does the methane seepage rate releasing the needed amount of carbon... That's of course happening at a slower rate (millenia) as opposed to centuries now in Anthropocene. -
Philippe Chantreau at 18:43 PM on 29 November 2012It's El Niño
BernardJ @ 97: I should gave been more specific, actually, and ask also about global surface temps (including land), as I recall they were mentioned. I have to confess I have not followed the whole exchange in every detail, although I find the sum of the examinations by Tom Curtis and IanC quite interesting. -
Doug Hutcheson at 16:04 PM on 29 November 20122012 SkS Bi-Weekly News Roundup #5
The New York Times article raises a point that had not occurred to me: "Barriers that might work in Manhattan would be futile in South Florida, where water would pass underneath them by pushing through porous bedrock". Now, there's a pretty thought! I wonder where else the same would apply? There must be plenty of locations where infiltration through basement structures would happen. That makes the idea of just adapting to the future climate a tad less attractive. Goodbye, South Florida and thank you for playing the adaptation game. -
Doug Hutcheson at 15:55 PM on 29 November 20122012 SkS Bi-Weekly News Roundup #5
It's good to see that at least some sections of the mass media are willing to print articles supportive of AGW. Are any of the above-listed news organs owned by Rupert Murdoch? I'm pretty sure the NYT is not, which must annoy the old boy. -
Doug Hutcheson at 14:41 PM on 29 November 2012Subcap Methane Feedbacks, Part 1: Fossil methane seepage in Alaska
Sub-cap methane is news to me - very unwelcome news. It was bad enough contemplating biological methane and clathrates, without throwing geological methane into the mix. Correct me if I'm wrong, but isn't methane implicated in the loss of atmospheric ozone? We are not only getting hotter, but also more irradiated. The depth of our collective stupidity is breath-taking! -
Doug Hutcheson at 14:19 PM on 29 November 2012Climate of Doubt Strategy #2: Exaggerate Uncertainty
Analogy #372: A man walks into a crowded Washington hotel lobby. He is wearing what appears to be a jacket covered with sticks of plastic explosives and is carrying in his left hand what appears to be a controller with a big, red button. His thumb is on the button. All the security guards yell "Take cover, this maniac has a bomb!" What do you do? You could:- Run for your life
- Take cover behind a stout concrete pillar
- Hit the floor and hope the blast goes over your head
- Do nothing, because you have no evidence that the bomb is real and, anyway, chances are the chap is right-handed, so he has the controller in the wrong hand
- Shake him by the hand and say "I love your outfit today. Going anywhere special?"
-
Doug Hutcheson at 13:59 PM on 29 November 2012New research from last week 47/2012
Thanks, Ari. The ability of sea ice to suppress methane emission from the ocean, as well as to absorb methane from the atmosphere, must ring alarm bells. Just melting the Arctic ice cap may release nasty quantities of methane, irrespective of what is happening to the permafrost. I fully expect a denialist illusionist to expound a compelling theory as to why this release of methane is a Good Thing For The Biosphere. -
scaddenp at 09:49 AM on 29 November 2012It's El Niño
Got to love Dr Inferno. Of relevance to this thread, "Things That Can Be Blamed Instead" ... ENSO. Same way the Moon causes sea level rise. ... -
John Hartz at 08:57 AM on 29 November 2012It's El Niño
I believe that the following graphic relates directly to our ongoing discussion with Tisdale. Source: 2012: Record Arctic Sea Ice Melt, Multiple Extremes and High Temperatures, WMO Press Release No 966, Nov 28, 2012
-
scaddenp at 08:16 AM on 29 November 2012It's El Niño
'I wasn’t complaining, skywatcher. I was being realistic. There is a difference." I agree that Bob is being realistic - the review process would make demands that I think Bob is unable to answer. -
Bernard J. at 08:04 AM on 29 November 2012It's El Niño
A quick question for Bob Tisdale to clarify something about the nino/nina thing: are you arguing that SSTs respond more strongly to El Nino than to La Nina, i.e. that El Nino warms SSTs more than La Nina cools them?
It's obvious Philippe - ENSO is a bootstrap process, a magic ratchet or a magic pudding as I've noted elsewhere. However, I very much doubt that Tisdale will actually ever elucidate the thermodynamics of his claim. He's been asked here repeatedly, and many others of us have pressed him about it on multiple occasions over a year ago at WWWT, and there's never been a simple, straight explanation - or even a convoluted one for that matter. Having said that, I'd be most curious to hear Tisdale's response to your question.Moderator Response: [DB] Closed the italic hashtag; guessed as to its most likely location. -
ranyl at 08:00 AM on 29 November 2012Subcap Methane Feedbacks, Part 1: Fossil methane seepage in Alaska
"The future for our grandkids and beyond is beginning to look *really* not rosy." Isn't this denial by dispalcement in time? As in things in terms climate aren't exactly rosy already. Another flood about to hit Italy, 3rd devastating set of floods in less than a month there, the UK last week (being blamed on flood defences despite these having been upgraded tremendously in the last 30 years), and California weather event about to happen, record drought in USA building and so on and on. As for methane, additonal Arctic releases that are already happening, methane is on the rise again and all the extra is coming from the Arctic. The times of "not rosy" seems like it is now not tomorrow. As for our ancestors what are they going to say about us if we actually leave any at this rate! The car was important than humanity? -
John Hartz at 07:55 AM on 29 November 2012It's El Niño
@ Bob Tisdale: Do you agree, or disagree with the following statement? “Naturally occurring climate variability due to phenomena such as El Niño and La Niña impact on temperatures and precipitation on a seasonal to annual scale. But they do not alter the underlying long-term trend of rising temperatures due to climate change as a result of human activities,” said WMO Secretary-General Michel Jarraud. Source:2012: Record Arctic Sea Ice Melt, Multiple Extremes and High Temperatures, WMO Press Release No 966, Nov 28, 2012 -
Tom Curtis at 07:50 AM on 29 November 2012It's El Niño
Following Kayell's complaint (@84), I have reproduced his "detrending" method using the weekly OHC data: For those wanting technical details, I adjusted each interval between Kayell's stated adjustment points to have a common mean. Transitions where spaced over five weeks with an equal change in each week to avoid introducing very large adjustments in a single week. Both the Nino3.4 and Global anomalies have been divided by their Standard Deviation. The rescaling makes the magnitude of variation consistent for comparison without pretending global fluctuations are much larger in degrees C than they actually are.
Contrary to Sphaerica @74, although this method of detrending is arbitrary, it does not give a noticeably inferior fit to simple linear detrending:
For those wanting technical details, I adjusted each interval between Kayell's stated adjustment points to have a common mean. Transitions where spaced over five weeks with an equal change in each week to avoid introducing very large adjustments in a single week. Both the Nino3.4 and Global anomalies have been divided by their Standard Deviation. The rescaling makes the magnitude of variation consistent for comparison without pretending global fluctuations are much larger in degrees C than they actually are.
Contrary to Sphaerica @74, although this method of detrending is arbitrary, it does not give a noticeably inferior fit to simple linear detrending:

(Note, this graph is essentially the same as that in my post 76, except that it uses Standard Deviations rather than degrees C for the y-axis.)
Indeed, if you look at the residuals - the difference between the scaled Nino 3.4 anomaly and the scaled Global anomaly in the two graphs, it is difficult to tell them apart: Of particular interest here is the yellow line, which shows the difference in the residuals between the linearly detrended and Kayell adjusted graphs. It shows a clear pattern of rising gradually with the linear detrending, with three abrupt shifts down from the adjustments following Kayell's method. The important thing to note is that the difference never exceeds (approximately) 0.5 Standard Deviations. That means the difference between the two methods is not statistically significant.
That simple fact is devastating to Kayell's argument.
Kayell (and Tisdale) argue that the data show step changes in the SST data, yet it is well known that the combination of a linear trend, noise and natural cycles can give the appearance of step changes where none exist:
Of particular interest here is the yellow line, which shows the difference in the residuals between the linearly detrended and Kayell adjusted graphs. It shows a clear pattern of rising gradually with the linear detrending, with three abrupt shifts down from the adjustments following Kayell's method. The important thing to note is that the difference never exceeds (approximately) 0.5 Standard Deviations. That means the difference between the two methods is not statistically significant.
That simple fact is devastating to Kayell's argument.
Kayell (and Tisdale) argue that the data show step changes in the SST data, yet it is well known that the combination of a linear trend, noise and natural cycles can give the appearance of step changes where none exist:
 Consequently, when we see what may naively be interpreted as a step change, we need evidence that we are not simply fooling ourselves. That evidence, for Kayell (and Tisdale) is the ability to "detrend" the global SST anomaly by introducing three major shifts rather than by simply linear detrending. But as it turns out, there is not statistical difference between the two methods. Therefore, the ability to "detrend" by introducing step changes is not significant evidence.
Indeed, it is worse than that. We can test the "fit" between the Nino3.4 and Global anomalies for the two different methods of "detrending". We can take the correlation, for example, although there are reasons to think it is not a suitable method for the comparison. Alternatively, we can take the Root Mean Squared Deviation:
Consequently, when we see what may naively be interpreted as a step change, we need evidence that we are not simply fooling ourselves. That evidence, for Kayell (and Tisdale) is the ability to "detrend" the global SST anomaly by introducing three major shifts rather than by simply linear detrending. But as it turns out, there is not statistical difference between the two methods. Therefore, the ability to "detrend" by introducing step changes is not significant evidence.
Indeed, it is worse than that. We can test the "fit" between the Nino3.4 and Global anomalies for the two different methods of "detrending". We can take the correlation, for example, although there are reasons to think it is not a suitable method for the comparison. Alternatively, we can take the Root Mean Squared Deviation:
 That's all the difference there is between the two methods of "detrending". The linear detrend scores (just) better in terms of Root Mean Square Deviation, but the Kayell Adjustment shows a whopping 0.0075 better correlation between Nino 3.4 and adjusted Global SST anomalies. And on that massive 0.0075 difference rests the entire claim of a step change in sea surface temperatures following the 97/98 El Nino.
Colour me unimpressed.
Of course, this is not a case where we are comparing the predictions of two physical theories with distinct predictions. Climate science clearly predicts an approximately linear trend in SST over the period of interest, as modulated by ocean cycles and noise. There is a substantial, well worked out physical theory predicting the result. What is more, there are known factors likely to lead to the appearance of a step change in the data. The Pinatubo eruption in the 1990s, and a weakening solar cycle coupled with a switch from El Ninos to La Ninas in the 2000s are, when coupled with global warming, perfectly adequate explanations for that appearance.
In stark contrast, neither Kayell nor Tisdale have provided any physical theory predicting a step change. Consequently their only justification for believing one exists is statistical, ie, the 0.0075 point superior correlation when using the Kayell Adjustment compared to a linear detrending. So once again we find that Kayell and Tisdale have no evidence to support their claims, and no theory to justify making them.
That's all the difference there is between the two methods of "detrending". The linear detrend scores (just) better in terms of Root Mean Square Deviation, but the Kayell Adjustment shows a whopping 0.0075 better correlation between Nino 3.4 and adjusted Global SST anomalies. And on that massive 0.0075 difference rests the entire claim of a step change in sea surface temperatures following the 97/98 El Nino.
Colour me unimpressed.
Of course, this is not a case where we are comparing the predictions of two physical theories with distinct predictions. Climate science clearly predicts an approximately linear trend in SST over the period of interest, as modulated by ocean cycles and noise. There is a substantial, well worked out physical theory predicting the result. What is more, there are known factors likely to lead to the appearance of a step change in the data. The Pinatubo eruption in the 1990s, and a weakening solar cycle coupled with a switch from El Ninos to La Ninas in the 2000s are, when coupled with global warming, perfectly adequate explanations for that appearance.
In stark contrast, neither Kayell nor Tisdale have provided any physical theory predicting a step change. Consequently their only justification for believing one exists is statistical, ie, the 0.0075 point superior correlation when using the Kayell Adjustment compared to a linear detrending. So once again we find that Kayell and Tisdale have no evidence to support their claims, and no theory to justify making them.
-
Son of Krypton at 05:19 AM on 29 November 2012Subcap Methane Feedbacks, Part 1: Fossil methane seepage in Alaska
I had never thought about the process of glacial retreat causing a release route for deeply buried methane; I had only considered year ground permafrost that is more subject to warming. A rather worrying discovery indeed -
Alexandre at 05:06 AM on 29 November 2012Subcap Methane Feedbacks, Part 1: Fossil methane seepage in Alaska
Very informative post. My thumbs up to Fig 1 as well. -
vrooomie at 04:54 AM on 29 November 2012President Obama's Statement on Climate Change
I haven't the time to delve deeply into this, and it is interesting: however, I was deeply involved in the car 'bidness,' in the 70s, and saw the CAFE deal unfold. "After the oil crisis in the 1970s the American Congress approved a law stating that fuel efficiency had to double in 10 years time. The American car manufacturers succeeded in this task, but the consequence was that total fossil fuel consumption went up." Not as a result of the legislation: as a result of WAY more more vehicle-miles traveled (incidentally, because of increased safety standard at the same time, traffic deaths *decreased*). Had the vehicle-miles remained static, total CO2 emissions from cars would have gone down in relation to the number of gallons used, per unit of distance. A gallon of petroleum fuel, irrespective of how *fast* it is burned, gives off essentially the same amount of carbon. This is why I'm glad there are bona fide stats experts in the world, and on SkS, to give more meaning to statements like above. I can only do so, in my limited ability to spout stats, due to my intimate knowledge of things that suck-smash-bang-blow! -
Philippe Chantreau at 04:10 AM on 29 November 2012It's El Niño
And, as Bob himself remarked earlier, we don't want to take anybody's words out of context. Skywatcher's full sentence about the complaining on "gatekeepers of science" was as follows: "You have to love Bob Tisdale complaining about the 'gatekeepers' of science ... in response to an opening post that starts by discussing the failings of McLean et al who published in JGR!!" JGR being a serious journal, the kind that would definitely add some weight to Bob's argument if he submitted his work there and passed peer-review. Nonetheless, even if that happened, it would be met with healthy, scientific skepticism, as this is what's it's all about, after all; we all understand that peer-review is a minimum standard, not a golden one, and it is not infaillible. -
Philippe Chantreau at 03:57 AM on 29 November 2012It's El Niño
A quick question for Bob Tisdale to clarify something about the nino/nina thing: are you arguing that SSTs respond more strongly to El Nino than to La Nina, i.e. that El Nino warms SSTs more than La Nina cools them? -
IanC at 03:21 AM on 29 November 2012It's El Niño
Bob, We didn't even get anywhere with the first question, why move on to the second? Doing so will just make the discussion intractable when we haven't even finished the first point. Let's recap: You @40: Why hasn't east pacific warmed? Me @41: Perhaps its internal variability such as PDO You @ 42: PDO can't be because the index exaggerates variability and the is inversely related to the N. pacific residual, and the dominant component is the N pacific Me @ 48: Here's evidence that PDO is a basin-wide mode, and the response in the east is the right order of magnitude to explain the lack of trend. You @ 52: No it can't be basin wide. PDO index doesn't represent SSTA because it is inversely related to the N. pacific residual. Me @56: Shows more evidence of PDO being a basin wide mode, shows PDO index can represent SSTA when interpreted in conjunction with the EOF, I even showed how you can get the scaling factor you found, and why PDO index is inversely related to N pacific SSTA. You @62: PDO index is standardized and exaggerates variability. PDO is inversely related to North pacific SSTA. PDO is index is abstract, why not use NINO3.4? Up to this point, all three of your counters consist of repeating what you think is right. You have not cited any evidence that your understanding is correct. You have not cited one single journal article that PDO does not impart an inter-decadal variability in the east Pacific. Whether PDO index is abstract is irrelevant, and frankly your complaints about the index are just red-herrings. You have avoided the real question: is there an inter-decadal variability that can explain the lack of warming in the east? To me you are just avoiding the issue, and it is not even clear if you've spent time reading and thinking about what I said, because if you had, you will not be repeating the same set of arguments three times. Look, it is not hard. If you think I have a point, that PDO is a viable answer to your first question, say you'll have to think about it and then we move on to your second question. If you think I'm wrong, explain, with new evidence, why I am wrong, and PDO is not a plausible explanation for the trend in E. pacific. Don't use a lack of discussion on your second question as an excuse to avoid discussing responses to your first question. BTW, I think you lost track of where the ball is. You served, I returned serve. I have yet to see the ball coming back to my side of the court. All there is so far is complaints that the ball is too fuzzy, too hard, and there's no ball. -
vrooomie at 03:13 AM on 29 November 2012Subcap Methane Feedbacks, Part 1: Fossil methane seepage in Alaska
Agreed, Dana: As a geologist, I've been worried about the 'clathrate gun' for some time, and this also figures into my worry. The future for our grandkids and beyond is beginning to look *really* not rosy. The graphics, and the message of this post are well-done and *extremely* upsetting. -
Doug Bostrom at 03:04 AM on 29 November 2012It's El Niño
Bob says he's answered all questions put to him here. That's actually not true. He's been asked twice by a couple of different people to explain a key feature of his argument and so far has not replied.46 3: (perhaps most importantly) what is the energy source that allows the oceans to drive atmospheric temperature changes while themselves warming on a global scale? Where is the energy coming from, Bob? 70 Where is the energy required to produce net warming of the entire global ocean along with the atmosphere coming from?
Bob, please just show us how a mass (global ocean+air) can increase in temperature without energy being added to it. Or from another perspective having to do with what our instruments tell us: Is global warming real or not? -
Composer99 at 02:21 AM on 29 November 2012It's El Niño
Bob Tisdale: Why should anyone here feel obliged to respond to your nonsense? As far as I can see your questions are an attempt to side-step sea surface temperature trends as well as increasing ocean heat content. I mean, come on. Your graph of "Detrended Rest-of-World SST Data Disagrees with The Warming of SST Anomalies As Portrayed By AGW Proponents" [SST abbreviated by me]? Of course it disagrees - you detrended the SST data. As far as divergence between SST behaviour and ENSO goes, one would only expect complete agreement between SSTs and ENSO if ENSO were the sole driver of SSTs. But the fact that there is an upward trend in SSTs puts the boots to such a belief: other factors also drive SST behaviour. So, if anything, we would expect divergence from ENSO from time to time. Tom Curtis' post at #80, in the meantime, puts the boots to your claim that the East Pacific "hasn't warmed":It turns out that not only is the lack of warming in the East Pacific not statistically significant, its existence is an artifact of the choice of start and endpoints in the data. [Emphasis original.]
So how is one to characterize your claim "no one here has replied to that question from comment 40" except as refusal, whether through inability or unwillingness, to read others' posts on this thread? -
dana1981 at 02:15 AM on 29 November 2012Subcap Methane Feedbacks, Part 1: Fossil methane seepage in Alaska
That Figure 1 by jg is very cool! -
Bob Tisdale at 00:19 AM on 29 November 2012It's El Niño
To all who have commented in response to my appearance here at SkepticalScience: You’ve not answered my very basic questions. In my opening comment (40) here, I presented some graphs and asked questions of you. The first graph was for the East Pacific, which shows no warming over the past 30 years. http://bobtisdale.files.wordpress.com/2012/09/figure-111.png I asked, Why hasn’t the East Pacific warmed? IanC has attempted to explain why it has not warmed using an abstract form of sea surface temperature. He’s making the effort. Bravo, for that. The third graph was the detrended sea surface temperature anomalies for the Atlantic, Indian, and West Pacific, which I referred to as the “Rest of the World.” http://bobtisdale.files.wordpress.com/2012/09/figure-13.png It shows four periods when the Rest-of-the-World data diverges from the ENSO index (the scaled NINO3.4 sea surface temperatures [scaling factor 0.12 and lag 6 months). The two divergences in green are obviously the effects of El Chichon and Mount Pinatubo, but the divergences in brown are ENSO-related. The sea surface temperatures for the Rest of the World do not cool proportionally during the La Niña events of 1988/89 and 1998-2001. Everyone here has avoided the discussion of that graph. That’s the big ticket item, and it’s blatantly obvious why it’s important. Up through comment 67, I have replied to your questions and comments, yet no one here has replied to that question from comment 40. It’s time for you to catch up with me. You all are running way behind in the QnA. So I’ll ask the question again: Why does the detrended [Rest of the World] data diverge from the ENSO index during the 1988/89 and 1998/99/00/01 La Niñas? The ball is in YOUR court. Unless YOU can explain those divergences, there is no reason to continue this conversation. If and when you explain them, I’ll be happy to respond to all of the questions you’ve presented. I’ll check back every couple of days. Regards PS: skywatcher says: “You have to love Bob Tisdale complaining about the 'gatekeepers' of science…” I wasn’t complaining, skywatcher. I was being realistic. There is a difference. -
skywatcher at 19:28 PM on 28 November 2012It's El Niño
You have to love Bob Tisdale complaining about the 'gatekeepers' of science ... in response to an opening post that starts by discussing the failings of McLean et al who published in JGR!! Bob, are you saying that your science is not even up to the standard of McLean et al, a classic example of science being entirely open to the so-called skeptics? And for the umpteenth time, where is the heat coming from? And why do you persist in selecting favoured subsets of the data, rather than consider the full body of data? Your cherry-picks may be more elegant than the "it's not warmed since 1998" crowd, but they are still cherry-picks. -
IanC at 16:26 PM on 28 November 2012It's El Niño
Kayell, Your quote of William Briggs came from his post here, but I don't think he meant it the way you used it. Considering what he said in the rest of his post, I think his point is that if you are claiming that the trend is upwards, you don't have to use a linear model to make that claim. Whether the claim is a valid one is an entirely different matter. I don't fully agree with what he said, but the example he used is an excellent example as why one has to be very careful drawing patterns out of a noisy time series (BTW ENSO is noise when you are looking at multi-decadal trends). He artificially generated an artificial time series with zero trend with random noise: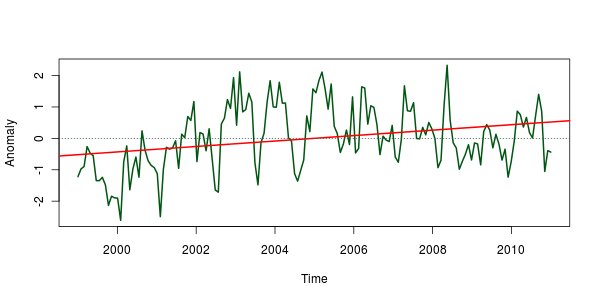 Yet if you fit a trend line it yields a statistically significant result.
Now my question to you is, if you just eyeball the graph and claim that there is an increase till 2005 and then decrease from there, is it a valid claim?
If you claim that there is a step, you at the bare minimum have to run some statistical testing as a sanity check. If your assertion passes a statistical test, we can then proceed with caution. If does not, there is no reason for it to be taken seriously.
############################
Now that I think about it a bit more, I think there is a much bigger problem.
Your basis for shifting the global SSTA at those two points is based on your arguement that "extra heat piled up globally after an El Niño and during the transition to the first following La Niña", which you supported with the animation, that supposedly shows the "extra heat globally".
The problem is this: since you are plotting a scaled global temperature anomalies and a regional temperature anomalies, you can't even interpret the difference between the two as a temperature difference because one of the quantities is scaled, let alone extra heat.
Yet if you fit a trend line it yields a statistically significant result.
Now my question to you is, if you just eyeball the graph and claim that there is an increase till 2005 and then decrease from there, is it a valid claim?
If you claim that there is a step, you at the bare minimum have to run some statistical testing as a sanity check. If your assertion passes a statistical test, we can then proceed with caution. If does not, there is no reason for it to be taken seriously.
############################
Now that I think about it a bit more, I think there is a much bigger problem.
Your basis for shifting the global SSTA at those two points is based on your arguement that "extra heat piled up globally after an El Niño and during the transition to the first following La Niña", which you supported with the animation, that supposedly shows the "extra heat globally".
The problem is this: since you are plotting a scaled global temperature anomalies and a regional temperature anomalies, you can't even interpret the difference between the two as a temperature difference because one of the quantities is scaled, let alone extra heat.
-
Bob Loblaw at 14:06 PM on 28 November 2012Climate of Doubt Strategy #2: Exaggerate Uncertainty
Photon Wrangler @11 ...and even if the speedometer is correct, 3% of the other drivers riding in the bus think it's just a shallow descent on the other side of the ridge, which will be great for saving gas - only 97% think its a sharp, painful drop! -
chriskoz at 13:26 PM on 28 November 2012Climate of Doubt Strategy #2: Exaggerate Uncertainty
vrooomie@5 Nice that you catch this piece of humour (sic - humor for you in US). Of course it was intentional: "affluent" implies "effluent" (i.e. discharging sewage) in this context. -
Photon Wrangler at 07:59 AM on 28 November 2012Climate of Doubt Strategy #2: Exaggerate Uncertainty
I like the above Judo-like use of analogies that play to conservatives heightened sense of threat-neutralization. I also like the image of a fast moving train being informed of a potential obstruction. Perhaps someone with artistic skills better than mine could render this scene: ---Passenger: "I can't help but notice that we're headed for a cliff at 60 mph." Driver: "Don't worry, the speedometer isn't entirely accurate. It's possible that we're only doing 50." --- -
Tom Curtis at 07:06 AM on 28 November 2012It's El Niño
Kayell @84, I apologize for inadvertently misrepresenting your technique; although it feels strange to apologize for assuming somebody has used a valid rather than an arbitrary rescaling. Having reread your post @35 (which I had previously only skimmed, I now see where you wrote:"When I 'detrended' the global SSTA curve in the graph above, I didn't use a statistical tool to remove a general upward trend. All I did was to pull it down at two (2) short sections: two datapoints in the last half of 1987 (July and November) and one datapoint in the beginning of 1999 (January)."
Would you please inform me the magnitude of the downward ajustment for each of the three months? -
mdenison at 04:46 AM on 28 November 2012Climate of Doubt Strategy #2: Exaggerate Uncertainty
I would suggest an analogy with eating. Healthy food in the correct amount is good for you and necessary. Junk food may be better than no food but a full diet of it leads to obesity and ill health later. Fossil fuels are the junk food of our economy. Excess use will lead to severe planetary ill health eventually. Just like our bodies it will be too late to fix the problem after that first heart attack. We need to change our diet. -
Ari Jokimäki at 04:43 AM on 28 November 2012New research from last week 47/2012
Fixed, thanks. :) -
LarryM at 04:42 AM on 28 November 2012Climate of Doubt Strategy #2: Exaggerate Uncertainty
Forrest@7: Speaking of a conservative-oriented analogy for the proper role of uncertainty in determining action, there's the "Cheney Doctrine", better known as "The 1% Doctrine": "If there's a 1% chance that Pakistani scientists are helping al-Qaeda build or develop a nuclear weapon, we have to treat it as a certainty in terms of our response. It's not about our analysis ... It's about our response." We are far more than 1% certain that Business As Usual (BAU) burning of fossil fuels (i.e., no action, as Monckton advocates), will lead to greater (or much greater) than 2C of global warming. The modest warming of about 0.6C that has occurred so far has led to increased extreme weather events and associated multi-billion dollar losses, not to mention the demise of the Arctic sea ice and the additional warming and weather consequences it will cause. We are already committed to much worse consequences from 2C of warming, and we risk catastrophic consequences with 4-6C of warming under Monckton's BAU. The Cheney Doctrine demands that we take action to avert catastrophe. Even common business practices of prudent risk management demand that we act to avert the possibility of catastrophic consequences. Conservatives, what say you about this reasoning? [Oops...I see that Phila@8 gave this analogy while I was writing.] -
Phila at 04:24 AM on 28 November 2012Climate of Doubt Strategy #2: Exaggerate Uncertainty
There is vastly more uncertainty about potential terrorist attacks than there is about global warming, yet with terrorism we feel it is our duty to take action despite the unknowns. During the Bush years, I often made an analogy to Dick Cheney's celebrated "One-Percent Doctrine": "If there's a 1-percent chance that Pakistani scientists are helping al-Qaeda build or develop a nuclear weapon, we have to treat it as a certainty in terms of our response." It was especially effective with people who claimed to see a 50/50 chance (at best) that current climate predictions were accurate. Unfortunately, I don't think dredging up this ancient history would work nowadays. Most denialists I know would probably say "Dick who?" That said, ideologues who laugh off AGW often demand that we take immediate preventive action on far murkier problems, on the basis of much more questionable statistics. Like fighting same-sex marriage to protect Civilization Itself from...something or other. Or launching expensive, disruptive schemes to "prevent" the statistically irrelevant threat of in-person voter fraud. Meanwhile, a massive international conspiracy is the only coherent alternative explanation for the scientific consensus on AGW. There's no evidence that any such conspiracy does or could exist. And yet, this total lack of evidence -- let alone certainty -- doesn't seem to stop a lot of these folks from making very confident allegations about global scientific corruption. Funny how that works. -
Forrest at 03:33 AM on 28 November 2012Climate of Doubt Strategy #2: Exaggerate Uncertainty
I think an analogy should be something that the target audience can relate to. As most deniers are conservative, put it in military terms. It's like getting credible information about an impending terrorist attack, but taking no action because we're not sure what time the attack will be, or whether they really have as many bombs as they claim, or we're awaiting confirmation that the 20th terrorist has actually boarded a plane, or some similar detail. Obstructionists can always point to some piece of information that isn't yet complete, but there comes a point where we have to act before it's too late. There is vastly more uncertainty about potential terrorist attacks than there is about global warming, yet with terrorism we feel it is our duty to take action despite the unknowns.
Prev 1016 1017 1018 1019 1020 1021 1022 1023 1024 1025 1026 1027 1028 1029 1030 1031 Next


