


 Arguments


Recent Comments
Prev 1086 1087 1088 1089 1090 1091 1092 1093 1094 1095 1096 1097 1098 1099 1100 1101 Next
Comments 54651 to 54700:
-
Daniel Bailey at 03:59 AM on 2 September 2012AGU Fall Meeting sessions on social media, misinformation and uncertainty
"The response in some quarters..."
Exemplifies nutjobbery in general and (-self snipped-) in specific. Durned Comments Policy prohibits most of what comes to mind to describe this. -
Doug Bostrom at 03:51 AM on 2 September 2012AGU Fall Meeting sessions on social media, misinformation and uncertainty
What an interesting conversation. There's a lot to learn here but it's not about the mechanics of a survey, more about what happens when uncomfortable information is delivered through research. The response in some quarters to Lewandowsky's paper seems an inadvertently authored metaphor for the larger problem of societal acceptance of climate change research, amusingly complete even in the detail of perusing purloined communications for hints of wrongdoing. Might be worth pausing to think about that. -
sol6966 at 03:13 AM on 2 September 2012Skeptical Science now a Nokia app
hi Clicked on the Nokia App link only to be greeted with a page saying "Sorry, this item is no longer available" Is the Nokia App unavailable temporarily? If not the link should be removed. -
chriskoz at 01:57 AM on 2 September 2012Potential methane reservoirs beneath Antarctica
I'm interested to know more about the relationship of Antarctic vs. Arctic clathrate reserves but I don't have access to the full article. The total amount of organic matter (10 times that of the arctic - 21 exagrams according to this study) does not mean much to the warming potential, IMO. What does matter, is the clathrates under AIS: in this study - 400 petagrams - the same as clathrates under arctic tundra. However, the total NH clathrates also comprise those under shalow depth of Arctic ocean, which is at least 1400 petagram by Shakhova et al. (2008), with bigger warming potential, especially considering Arctic acceleration with 2012 rapid ice melt. So far, I conclude, that this Antarctic study did not reveal anything more worrying that we already know: SH methane reservoir is smaller and melting slower than this on NH. -
John Hartz at 01:22 AM on 2 September 20122012 SkS Weekly Digest #33
@vroomie #3: I was born in Wisconsin and spent most of my life residing in the Madison area. I traveled the state extensively. I do not recall ever seeing or hearing about cactii native to the state. There are lots of sand-bur weeds however. -
Daniel Bailey at 01:21 AM on 2 September 2012Will the Wet Get Wetter and the Dry Drier?
Discussions of climate sensitivity are best taken to one of the CS threads, such as this one. -
Bernard J. at 01:08 AM on 2 September 2012Arctic Sea Ice Extent: We're gonna need a bigger graph
The Year Santa Drowned. I will wager my last hot dinner you just started--even before it's needed--a new GW meme.
A meme that's already in play, and I'm sure that I wasn't the first. It'll be interesting to see just how it's used for the first time in the mainstream media, once an ice-free summer Arctic is achieved... -
vrooomie at 00:53 AM on 2 September 20122012 SkS Weekly Digest #33
Steve, you might have cactus in WI, but I'll go on record as saying you do *not* have Saguaro cacti, and as DB states, the cartoon, and perhaps your response, illuminates the cognitive bias and denial of the those who call a simple cartoon "silly." -
vrooomie at 00:47 AM on 2 September 2012Will the Wet Get Wetter and the Dry Drier?
curiousd@14, that is a topic about which Ph.D.'s have been attained; My take is this (and I only gots a BSc in geology), that people almost always, will deny the very *existence* of the tiger that has them by their own tail, until they see the gnashing teeth of that tiger arriving at their throat. NO one wants to admit they are the problem; said another way, only wet babies like change. Clearly the 'facts' of the case, asserted by something north of 97% of the scientific opinion that is relevant to this issue have made no difference to the Moncktons, the Lindzens, the Christys, the____________________(fill in the blank), and frankly, they are the ones who most loudly decry us earth scientists as the ones who're are on the 'gravy train.' Extant data, and the persistent yelling of those folks, belies that bit of evidence. So, the *only* answer I have for you is this: keep asserting scientific support of the problem, kepo debunking the deniers, again and again and (Mod, please pardon the caps) AGAIN, and maybe, just *maybe*, the tiger of cAGW will be short-circuited at our.....crumbs....before they arrive at our jugulars. For me the *single* most important resource I have to help me make the point to those who deny it all, and to which I read and study every day, is SkS. Sorry for the OT post, but thought I'd take a shot at addressing your question. -
Jeffrey Davis at 00:43 AM on 2 September 2012Will the Wet Get Wetter and the Dry Drier?
re: 14 Why would you prepare for the lowest possible danger? (And why you would believe it?) Responsible drivers buy more automobile insurance than the minimum required by law. We don't fund the army on the cheap. People opt for aggressive therapies to treat their cancers. Responsible people who are wealthy enough don't count on only their Social Security check, but save/invest more instead. And on and on. As for the minimum climate sensitivity, the 1.5C figure demands that there be NO feedback response. The 1.5C figure consists only of the amount of heating that a doubling of CO2 will produce. (And why assume we'd stop at 560ppm if we refuse to do anything now?) There's nothing magical about the energy produced by increasing GHGs. It's just energy, and there are always feedbacks. But we've had around 1C of warming already and we're at ~390ppm from a base of 280ppm. At 2ppm/year (the current rate), we'll hit 560ppm in around 80 years. Only .5C more warming over the next 80 years? Who could possibly believe that? -
vrooomie at 00:35 AM on 2 September 2012Arctic Sea Ice Extent: We're gonna need a bigger graph
Glenn@6: The Year Santa Drowned. I will wager my last hot dinner you just started--even before it's needed--a new GW meme. Not sure whether to cry or to laugh.... For nigh on 10 years now, and given my increasingly cynical nature (and this, from a born, inveterate optimist!) I've been thinking that it *will* take a truly catastrophic event like the total melt-out of the Arctic to grab folks by their short-n-curlies, before anything really substantial gets done. I just hope that point-of-action isn't too late. "No matter how cynical you get, it's *impossible* to keep up." -Lily Tomlin, from "The Search For Signs Of Intelligent Life In The Universe. -
vrooomie at 00:27 AM on 2 September 2012How much has nuclear testing contributed to global warming?
DSL@24:......*ow*. But, you're right; this t(h)read is becoming kinda like a carcass....;) TC: I aims ta please! I'm a big believer in humor, both remaining in a tough topic, and being injected into ones that are bordering on war--not that this one was--but I am glad you got the joke! -
geoffchambers at 00:16 AM on 2 September 2012AGU Fall Meeting sessions on social media, misinformation and uncertainty
John Cook Are you sure the questionnaire you posted at SkS in 2011 is the one to the current Lewandowsky paper? Lewandowsky says the fieldwork was carried out between August and October 2010. The six sites where articles have been found all posted between the 28th and the 30th August 2010. There’s a similar questionnaire from UWA (though with different structure and different questions) being discussed at http://manicbeancounter.com/2012/07/29/climate-change-questionnaire-of-univ-of-western-australia/ and another one (or possibly the same one) was mentioned by junkscience. Clearly, several different surveys have been or are being conducted. (-Snip-)Moderator Response: [DB] References to stolen intellectual property snipped. -
philipm at 23:40 PM on 1 September 2012Why Arctic sea ice shouldn't leave anyone cold
It's interesting to line this development up against natural influences. While we are higher in the solar cycle than in 2007, the current solar cycle is still one of the lowest on record. 2007 was a cooling year in the ENSO cycle, whereas this year we're had a bit of El Niño phase of the cycle, but not a strong one. There isn't anything to suggest from this that any natural influence should be causing unusual warming. Next time the solar cycle goes back to its more usual maximum or next time we have a strong El Niño 1998-style, we could see a very rapid loss of sea ice extent. What we are seeing this time is most likely the effect of long-term loss of multi-season ice depth that doesn't in the short term decrease sea ice extent, but results in needing a year that's not exceptionally above the norm to drive back ice area a long way, once the multi-season ice has thinned enough. GISS shows northern hemisphere summer is one of the warmest on record, but not the warmest. -
curiousd at 22:04 PM on 1 September 2012Will the Wet Get Wetter and the Dry Drier?
Question: The"denial machine" now seems to be reduced to trying to prove the C.S. is small. I do not believe it is small, I think there is now good experimental evidence that the fast feedback CS is 3 deg C. BUT say the CS WAS at the lowest possible end, which we might take as 1.5 deg C. Why would this be an excuse for doing nothing about AGW? Does anyone have any crystal ball into denier logic that would help me out here? -
Rob Painting at 21:23 PM on 1 September 2012Will the Wet Get Wetter and the Dry Drier?
JoeT - Sorry, I don't know the details of how these two models differ. What I can tell you is that the 19 model ensemble used in Seager (2011), linked to above, did not find a change over the Sahel that was statistically significant. -
John Brookes at 18:35 PM on 1 September 2012Arctic Sea Ice Extent: We're gonna need a bigger graph
Yes, no one really predicted it. Maybe we weren't being "alarmist" enough? -
Estiben at 18:33 PM on 1 September 2012Realistically What Might the Future Climate Look Like?
garethman @42 It's great that you are taking these steps. Every little bit helps, but I'm sure you realize that not everyone can do the same. I suppose if everyone became a back-to-the-lander, our emissions would drop to near zero, but there isn't enough arable land to go around. Minifarms are not as efficient, for one thing, and then there is the problem of distribution. If everyone is a farmer, who is going to deliver food to where it can't be grown? Who is going to make new vaccines? I'm afraid we can't return to primitive agriculture without a massive loss of population. -
Estiben at 18:23 PM on 1 September 2012Realistically What Might the Future Climate Look Like?
Tom @39, I googled "Antarctic Heat Island" and nearly choked. You should post an absurdity factor warning. -
Glenn Tamblyn at 17:47 PM on 1 September 2012Arctic Sea Ice Extent: We're gonna need a bigger graph
shoyemore "Means the re-freezing will be almost as interesting as the melting." Never a truer word spoken. This years refreeze pattern is next years melt pattern. If refreeze starts later because the water is still warmer, their is less time for that ice to thicken over the winter and next year it melts out even quicker, more open water, more warming of the water more ... you get the idea. heijdensejan Yep, PIOMas really is following that exponential curve. However I think there will be some aspects of the Gompertz curve will happen as well. Exponential trend till it is 'virtually ice free' then leveling out like the gompertz curve before the last remnant goes. This isn't some weird math's. Its just that the last remnant is the ice along the north shore of Greenland & Ellesmere island. Weather patterns aren't usually conducive to that being cleared out easily and that is where the last remnant of the thicker ice remains. So it might hang around a bit. What is far more likely is that over the next 1-3 years the rest of the Arctic melts out substantially and earlier and that old ice is the last bastion. And importantly, that would include an ice-free North Pole. Not the final, truely ice free point. But perhaps a far more visceral 'tipping point'. The Year Santa Drowned. Although nobody wants the Arctic collapse to be happening, it might be our best hope in the short term to wake the world up. -
Troy_CA at 16:41 PM on 1 September 2012CO2 lags temperature
David (and others), for a specific response to Humlum et al., 2012, I put up a quick demo of why their method will create misleading results: https://troyca.wordpress.com/2012/08/31/comment-on-the-phase-relation-between-atmospheric-carbon-dioxide-and-global-temperature/ -
geoffchambers at 16:17 PM on 1 September 2012AGU Fall Meeting sessions on social media, misinformation and uncertainty
JohnHartz #8 Thank you. I have already done the search. It’s not there. Neither is it on the Wayback machine, who took snapshots of SkS every week during the relevant period. (-Snip-) Lewandowsky mentions SkS in his list of eight “pro-science” ( -Snip-) sites used, and when challenged, said that perhaps Cook had deleted the link. There is no suggestion of anything underhand here. The link from the participating blogs to the commercial organisation who set up the survey was deleted once the fieldwork period was over. My interest in finding the link here was in reading the comments of bloggers. It is puzzling that Sceptical Science did NOT take part, given the great interest that Cook shows in Lewandowsky’s work. (-Snip-) ( -Snip-) (-Snip-) So it seems that Lewandowsky was mistaken when he said that SkS took part in the survey, and we’re left with the puzzle of how he obtained 1100+ responses from just six (possibly seven) blogs, given the sparse and largely negative comments from the couple of dozen bloggers who discussed the survey on the blogs concerned. ( -Snip- ).Response:[John Cook] Skeptical Science did link to the Lewandowsky survey back in
20112010 but now when I search the archives for the link, it's no longer there so the link must've been taken down once the survey was over.[DB] References to stolen intellectual property, statements about religions & ideology and general off-topic hypothesizing snipped.
-
Kevin C at 16:11 PM on 1 September 2012Matt Ridley - Wired for Lukewarm Catastrophe
Joel@66: I think that shows that intuition is untrustworthy on this subject. Read Hansens' 2011 paper here, esp. figure 4a. Rypdal's method will allow you to deduce this figure for yourself. The temperature response to a given forcing history is the convolution of the derivative of this function with the forcing. You can see that about 40% of the response comes from forcing in the most recent 10 years, and 60% for earlier forcing. However, if the forcing is much more complicated than an impulse or a step, doing this calculation in your head is impractical. You actually have to do it before drawing conclusions on the results. -
scaddenp at 15:58 PM on 1 September 2012Matt Ridley - Wired for Lukewarm Catastrophe
Joel, 628ppm would be more like B1 scenario depending on what else was going on. IPCC prediction would be 1.1 -2.9 so I suppose they are luke-warmers too. I normally think of luke-warmers as those how somehow believe that climate sensitivity is less than 2. -
davidsanger at 15:52 PM on 1 September 2012CO2 lags temperature
thanks @Rob, clearly explained and the papers were helpful. -
Tom Curtis at 12:55 PM on 1 September 2012AGU Fall Meeting sessions on social media, misinformation and uncertainty
One further comment. Geoff Chamber's wrote at Bishop Hill:" Cook is quite clear in private correspondence that Lewandowsky’s denier / conspiracy theorist survey was something separate from the schemes he was cooking up with Lew. One possibility is that he contacted the commenters directly by email. This would be better survey practice, since it prevents commenters from exchanging views, as happened at Tamino’s, and also would avoid any possible bad publicity. Would it be considered unethical?"
Clearly his questions have been answered already. Skeptical Science and John Cook are not associated with Lewandowski's study. Curiously, Geoff Chambers followed that comment by espousing his own, bizarre conspiracy theory. Given that he thinks the "... whole survey is a fuss about nothing ...", I have to wonder why he is making a fuss. -
Tom Curtis at 12:48 PM on 1 September 2012AGU Fall Meeting sessions on social media, misinformation and uncertainty
Further to my comment @12, and following up on John Hartz @13, I had a look at Lewandowski's data. Of interest to me is that 43 out of the 64 people who most strongly disagreed with global warming, as measured by their disagreement with the claim that:"I believe that the burning of fossil fuels on the scale observed over the last 50 years has increased atmospheric temperature to an appreciable degree."
also strongly agreed with the claim that:"The claim that the climate is changing due to emissions from fossil fuels is a hoax perpetrated by corrupt scientists who wish to spend more taxpayer money on climate research."
That is, 67% of the hard core "skeptics" surveyed are conspiracy theorists in the strict sense; even if their conspiracy theories are restricted to global warming. As it happens, however, 37 of those 64 had conspiracy theory ideation above average. That is, 50% of hardcore "skeptics" surveyed give significant credence to at least one, or some credence to at least 6 bona fide conspiracy theories other than those associated with climate change. Scary. -
Bernard J. at 12:35 PM on 1 September 2012Matt Ridley - Wired for Lukewarm Catastrophe
Joel Upchurch at #65:Bernard J. @60 All you seem to have done is graph the IPCC A1F1 scenario. I don't know you seem to think that corresponds to any definition to the word proof.
Really - "seem to have done"?! If you have a mathematical background you should be able to muck around and actually deduce how I arrived at the trajectory, or at least come to a pretty close approximation. I even gave you some clues. And note, I haven't at any time used the term "proof". What I did say is that:...I constructed the curve...
and that:...I used the entire Mauna Loa dataset available at the time, and I used the data itself to determine the best projection, rather than directly assuming a linear, exponential, or other fit. I did this by using a process similar to that illustrated by Dana on this very thread, and by using the most parsimonious approach in that analysis to subsequently arrive at the 21st century extrapolation.
To simplify, as it seems to escape your mathematically-trained attention, I used the entire Mauna Loa dataset, and the trend inherent in the data themselves, to arrive at the graph I displayed. And if that closely resembles the IPCC's A1F1 scenario, well, that probably reflects the underlying supposition of my analysis of a business-as-usual trend based solely on the pattern inherent in the Mauna Loa data. Call me cynical, but given your responses to me and to others here I can't help but question your argumentum ad auditorem claim to have a degree in mathematics. Are you sure that you didn't just take it as a first year subject (if that), and that you're inflating your experience in an attempt to redirect the thread?Moderator Response: [d_b] Easy there, please; no sense in being lured away from the subject at hand by irrelevancies. -
skywatcher at 11:47 AM on 1 September 2012Matt Ridley - Wired for Lukewarm Catastrophe
Composer99, nicely put. Saves me one debunking task. Joel, in #23, you asserted it was not plausible for emissions to increase at a sufficient rate to support large temperature rises. You ignored (and continue to ignore) such crucial issues as time delay to equilibrium, feedbacks, and economic/population issues that will lead to continued acceleration of both CO2 emissions and resultant warming at BAU. But in #28 you supported your assertion in #23 with the following statement:There is nothing in the actual C02 data that supports an increase to 792PPM of CO2 by 2100.
Quite apart from the other evidence presented showing that this is patently absurd, I presented evidence that the IPCC have emissions scenarios that consider this entirely plausible, with A1FI and A2 passing 800ppm by 2100. In #62, you try and divert from accepting that you were wrong in your earlier statements by suggesting that the IPCC think 628ppm is plausible [of course they do]. Which was not the question. Let's not chase blimps here. Do you accept that the evidence presented shows that it is plausible for emissions to pass 800ppm by 2100? Or do you want to continue using your extensive mathematical skills to put naive linear trends through 30 years of data, and continue to ignore all other physical factors? -
Tom Curtis at 10:59 AM on 1 September 2012AGU Fall Meeting sessions on social media, misinformation and uncertainty
geoffchambers @6, a quick google search of SkS shows no hits for "Lewandowski" plus "survey". Beyond that, any questions you have should be directed to John Cook. For those who are interested, Lewandowki's paper is available online here. I note that, having read the methodology, the claims being made about it by various deniers are entirely unwarranted. It might justly be claimed that the paper has not sampled "skeptics" in general, or "skeptics who comment on the internet", but only "skeptics who comment on science based blogs" which may not be a representative sample. It may also be suspected that the number of "skeptics" participating may be to small to draw any significant conclusions. It is not clear to me where Lewandowski reports the proportion of respondents with low scores on the Climate Science part of the survey. More importantly, in my opinion, the title of the paper is not justified by the results, and is needlessly sensationalizing and offensive. Lewandowski found a -.866 correlation between free market ideology and acceptance of climate science, but only a negative 0.197 correlation between acceptance of conspiracy theories and acceptance of climate science. Clearly the link to free market ideology is the big result, and the limited link to conspiracy theory ideation should only be a footnote in this study. Having said that, the link between a significant group of "skeptics" and conspiracy theorizing is easily established by their own words, with suggestions that climate scientist fake data either to advance the cause of one world government, or to undermine the US economy, or simply to defraud tax payers all being common and all being, in the strictest sense, conspiracy theories. Of course, this only has bearing on those "skeptics", such as Monckton, who advance such theories; and is in no way a reflection on the more rational "skeptics" such as Jeff ID and Lucia. -
John Hartz at 10:53 AM on 1 September 2012AGU Fall Meeting sessions on social media, misinformation and uncertainty
To put Geoff Chamber's posts in context, here's the text of the Aug 31 post on Bihop Hill titled,"Landowsky's Survey." "Geoff Chambers has obtained Stephan Lewandowsky's survey data which can be seen as an attachment at the bottom of this post. Of course it's anonymised, so we are not going to get to the bottom of the question of the number of sceptics he approached, but you may be interested." Geoff and his cohorts at Bishoip Hill seem to be intent on making a mountain out of a molehill. -
Daniel Bailey at 10:47 AM on 1 September 2012Matt Ridley - Wired for Lukewarm Catastrophe
Tom Curtis posted this at 9:50 am and it was unfortunatley accidentally deleted. I reproduce the text here:Joel Upchurch, I just did a few calculations based on your comment @28. Based on your projected temperature increases, I calculated that your estimate for CO2 concentration in 2100 is 490-620 ppmv. That later requires an average 2.56 ppmv CO2 groath over the remaining years of the 21st century, ie, a marginal increase over current levels. The former requires annual CO2 growth approx half that of current values for the rest of the 21st century. The median value requires no growth in emissions over current values for the remainder of the century. Your assumptions are simply absurd as a BAU model. More troubling, if you calculate the increase in temperature from the pre-industrial average using your your concentration estimates, we find an increase of 2.4 C over the preindustrial average for the lower estimate, and 3.4 C for the upper estimate. That represents a 1.7 to 2.7 C increase over current values. You only obtained lower values by ignoring the warming currently in the pipeline. (Note: The difference between my estimate and scaddenp's estimate at 58 is that I used a climate sensitivity of 3, while he used 2.8) Most importantly, the median value of 2.9 C is well above the 2 degree above pre-industrial average guardrail for "safe" global warming. Even your dubious luke warm values are way to hot.
-
Daniel Bailey at 10:44 AM on 1 September 2012AGU Fall Meeting sessions on social media, misinformation and uncertainty
Sorry, JH. Only JC can do that. -
Composer99 at 10:30 AM on 1 September 2012Matt Ridley - Wired for Lukewarm Catastrophe
Joel Upchurch @ 62: You claim of Tamino in one of his posts linked to upthread:He is actually demonstrating that Monckton's assertion of linear C02 growth is absurd. He wasn't trying to prove that CO2 accumulation is super-exponential. You are using what he posted out of context.
However, over the course of his debunk of Monckton, Tamino concludes the post with the graph shared here before and some additional comments: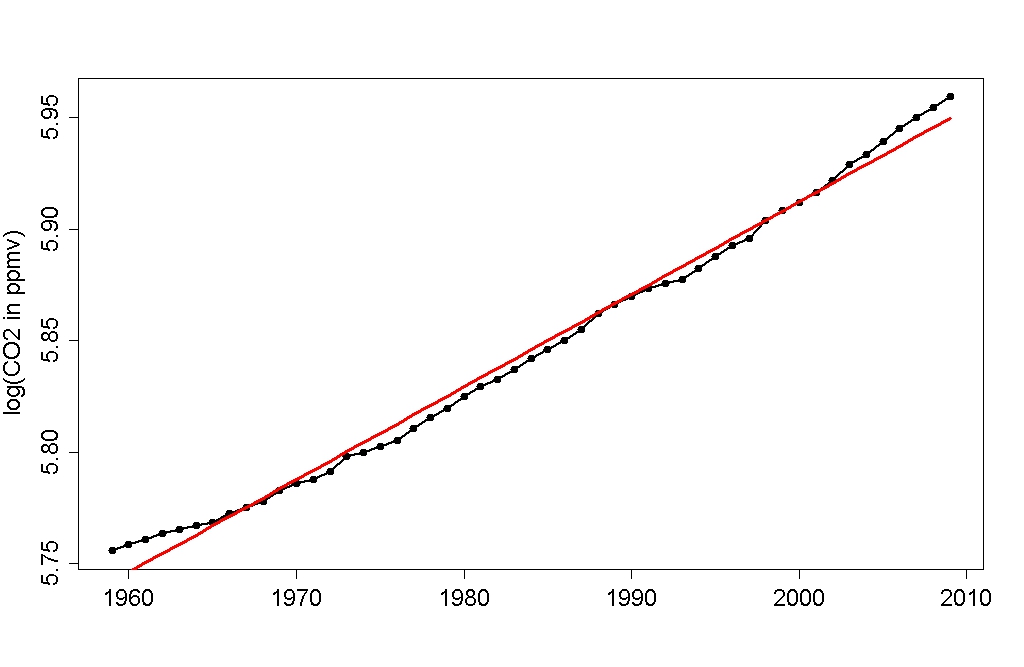
It sure looks like log(CO2) has increased faster than linear, i.e., that CO2 concentration has increased faster than exponential. We can test this by fitting a quadratic curve to the residuals from our linear fit:
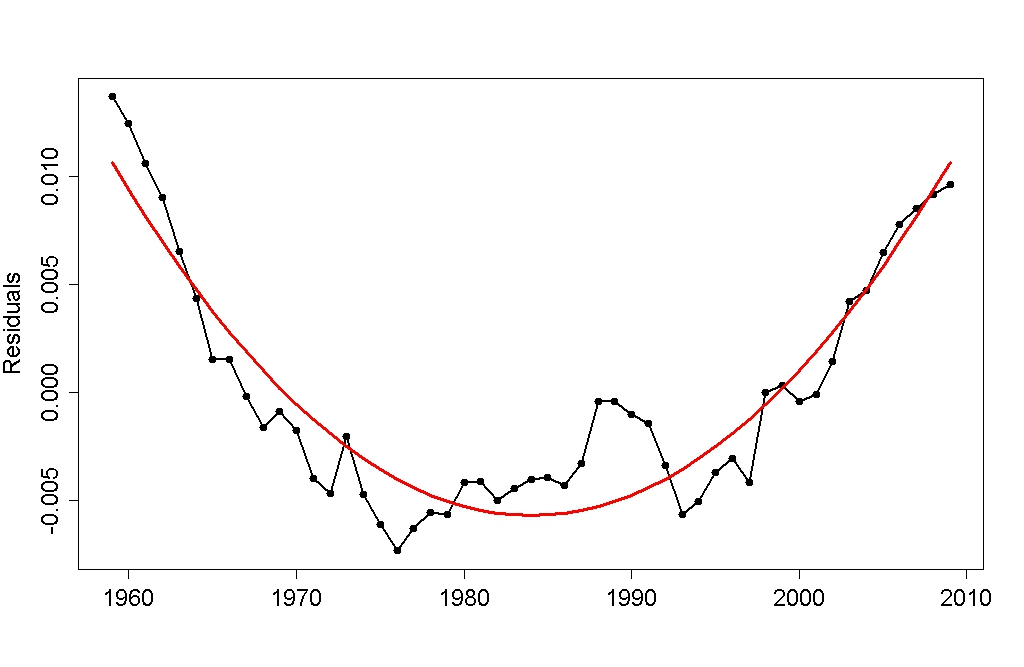
Sho’nuff. CO2 has increased faster than exponential. Even using the shorter NOAA global dataset. And yes, the result is statisically significant. [Emphasis mine.]
Suffice it to say that, while demonstrating CO2 concentration is increasing faster than exponentially was not the express purpose of Tamino's post, in direct contradiction to your assertion, he nevertheless does so. Colour me unimpressed, Joel. -
John Hartz at 10:29 AM on 1 September 2012AGU Fall Meeting sessions on social media, misinformation and uncertainty
@geoffchambers #6 I inadvertendly deleted your second post. I'm hoping that Daniel Bailey can restore it. -
John Hartz at 10:27 AM on 1 September 2012AGU Fall Meeting sessions on social media, misinformation and uncertainty
@geoffchambers #6: If you want to determine whether SkS posted a link to Lewandowsky's survey between Aug and Oct 2010, you can use the site's archive to access all of the articles posted during this time-frame. It is not incumbent on volunteer SkS authors to do this research for you. If you want to know how John Cook interacted with Stephan Lewandowsky on his survey, you best send a querry to John via email. He's a very busy person and no longer has time to read all of the comments posted on SkS. -
Daniel Bailey at 09:53 AM on 1 September 2012AGU Fall Meeting sessions on social media, misinformation and uncertainty
I guess I'd have to ask, Geoff: Who's speculating, where are they speculating, who wants to know and why?Moderator Response: TC: The following is the text of Geoff Chamber's post, accidentally deleted by John Hart. I am posting it here as the natural response to Daniel's question:"Daniel Bailey Just about everyone at Lucia's blackboard, Bishop Hill, and Joanna Nova's. I've seen the names of Mosher, McIntyre Jeff Id, Andrew Montford, Anthony Watts, among others. Some of the speculation is about the identity of the sceptical blogs which Stephan contacted and which refused to cooperate. Some is about the data itself, which is now available at Bishop HillL My question is on the specific point as to whether Skeptical Science participated in the survey in any way. A simple yes or no answer will do."
-
Tom Curtis at 09:16 AM on 1 September 2012Matt Ridley - Wired for Lukewarm Catastrophe
Joel Upchurch @63, I doubt very much that you have been told that discussing the IPCC's economic projections is of limits. You may have been told they are of topic on a particular thread - but that is not the same as saying they are of limits per se. In any event, I am not asking you to discuss the IPCC's economic projections. I am asking you to identify what you believe will happen so that you can be confident that CO2 emissions will not compound at greater than 3% annually over the next 90 odd years: a) Will economic growth be significantly less than 3%, and why? b) Or will the human population essentially plateau at current levels, and why? c) Or will carbon intensity decrease by 3% per annum compounding over the next 90 years without government regulation or a price on carbon? And if so, why? -
geoffchambers at 09:14 AM on 1 September 2012AGU Fall Meeting sessions on social media, misinformation and uncertainty
I see John and Stephan are going to be convening a meeting together on Understanding & Responding to Misinformation in December 2012 There's a lot of speculation on the net at the moment about the Lewandowsky paper which has been announced about scepticism and belief in conspiracy theories. (-Snip-) Could you, John Cook, please clarify whether SkS posted a link to Lewandowsky's survey between Aug and Oct 2010, or helped in any other way, eg by providing email addresses of potential respondents? many thanks Geoff ChambersModerator Response:[DB] References to stolen intellectual property snipped.
-
Tom Curtis at 09:08 AM on 1 September 2012Matt Ridley - Wired for Lukewarm Catastrophe
Joel Upchurch @66, why can we ignore it? Does the world end in 2100? Or is this just purely an intellectual exercise for you? More importantly, as is evident from your comment @28, you have been calculating the expected temperature increase from (approx) 2010 levels. In doing so you want to ignore the heat currently in the pipeline, and that in the pipeline at 2100, which is double dipping. -
Joel Upchurch at 08:02 AM on 1 September 2012Matt Ridley - Wired for Lukewarm Catastrophe
Kevin C @ 61 As far as forecasting the temperature in 2100, then it seems to me that a pipeline cuts both ways. If there is 10 years of heat in the pipeline, then that means that we can ignore what we emit after 2090. I would like to discuss the Chinese situation. They are forecasting that their greenhouse gas emissions will peak around 2050 and start decreasing because of their switch to nuclear power. -
Joel Upchurch at 07:46 AM on 1 September 2012Matt Ridley - Wired for Lukewarm Catastrophe
Bernard J. @60 All you seem to have done is graph the IPCC A1F1 scenario. I don't know you seem to think that corresponds to any definition to the word proof. -
Joel Upchurch at 07:20 AM on 1 September 2012Matt Ridley - Wired for Lukewarm Catastrophe
scaddenp @58 Since the lukewarming argument is 2 degrees or less, 2.2 degrees as roughly consistent. I'm certainly not going to argue about 10%. -
Joel Upchurch at 07:14 AM on 1 September 2012Matt Ridley - Wired for Lukewarm Catastrophe
Tom Curtis @ 59 I have been told in the past that questioning the economic models that the IPCC uses is off limits. If that is not longer the case, then I would love to discuss it. I find the economic models far more questionable than the science. -
Joel Upchurch at 07:02 AM on 1 September 2012Matt Ridley - Wired for Lukewarm Catastrophe
skywatcher @57 I read Tamino's post again. He is actually demonstrating that Monckton's assertion of linear C02 growth is absurd. He wasn't trying to prove that CO2 accumulation is super-exponential. You are using what he posted out of context. I reviewed the IPCC scenarios and 628PPM by 2100 seems to fall between the A1B and B2 scenario, so I don't know why you think it is manifestly wrong. -
David Lewis at 06:07 AM on 1 September 2012Realistically What Might the Future Climate Look Like?
re: obese people and their carbon footprint department the Royal Society just published a special Geoengineering issue which contained an article on summarizing work studying which crops would reflect most sunlight back out to space. There are differences between different crops and between different strains of each crop when you examine the effect they have on local albedo. When civilization gets serious everything is going to be thrown at the problem. The issue contains an article on if it is possible for the planet to experience what specialists call a "runaway greenhouse effect", i.e. turning Earth into something like Venus by elevating the temperature so much the oceans boil away, which Jim Hansen said in a Bjerknes Lecture at the AGU that he thinks is a "dead certainty" if all fossil fuels are burned. The authors examined the issue, and the Royal Society publishers published the research because Hansen took a position. What a relief to discover that if you accept that the simple models employed are right, all that can happen and this is said to be a remote possibility by the modellers, is a "moist greenhouse", that wouldn't boil the oceans away. I think that event ends civilization and all or most all of life I'm still studying.... Schellnhuber says PIK examined the issue a bit as well and he also said, at the Australian 4 degrees conference in one of his speeches that what can happen is you heat the planet up slowly in human terms rapidly in geological terms and once you cross a line somewhere around 4-6 degrees I seem to remember the system takes off and doesn't stabilize until the temperature is far higher. -
M Tucker at 05:41 AM on 1 September 2012Realistically What Might the Future Climate Look Like?
Caldeira, and others, have pointed out many times that human engineered modifications to the atmosphere to cool the earth could cause unintended consequences. A severe drought or heat wave occurring after a nation, or group of nations, embarks on a modification program might be taken as an act of aggression by the suffering party. With conflicts due to unwelcome immigrations already taking place due to climate disruptions, and considering many well respected organizations predict these will only intensify as the climate becomes more unstable, this will only add another layer that could easily lead to catastrophic wars. Schellnhuber’s comment is surprisingly narrow-minded. Acidification of the oceans is not just a threat to corals but to the base of the food chain that most fish and all apex predators depend. These bureaucrats remind me of the discussions held by the collection of middle managers, phone sanitizers, and hairdressers as described by Douglas Adams. -
David Lewis at 04:47 AM on 1 September 2012Realistically What Might the Future Climate Look Like?
The "4 degrees" conference held in Australia was devoted to exploring what happens as climate warms beyond the 2 degree target adopted in climate negotiations. The conference was inspired by the Royal Society "4 degrees" conference held in the UK. Conference organizers mentioned that when they attended the UK conference 4 degrees of warming was regarded as something civilization could not allow to happen and hence was unlikely. By the time the follow up Australian conference was held the idea of 4 degrees or more was, incredibly, becoming far more credible. The conference has a website where many presentations are available in audio. This page contains links to the audios. John Schellnhuber's keynote speech Climate Change: The Critical Decade is particularly recommended. Schellnhuber gave another speech:Strange Encounters behind the 2 degrees C Firewall which is also very good. I've been studying both speeches and forget what is covered best in which. He was part of the group that came up with the original idea for the IPCC "burning embers" charts shown updated by Smith et.al. in the above post. one of his specialties is tipping points. In the "Strange Encounters..." speech he explains very well what the 2 degrees target meant. For one thing, although 2 degrees was declared in political negotiations to be "safe" according to Schellnhuber, it means the end for coral reefs worldwide. "But who needs coral reefs anyway?" He sadly joked. He offers the best explanation I have heard for why using the analogy that there is a limit in billions of tonnes of carbon that can be added in total to the atmosphere when talking about the solution to climate, as opposed to talking about restricting emissions to "x"% by some date in a given country. The prior Royal Society 4 degrees conference is well worth studying as well. This Wikipedia page contains links to the conference video presentation page as well as much other useful info. I'm travelling and don't have access to my home computer which has better links to all presentations of this conference but you can find everything with a tiny bit of work. Once people realize that 2 degrees was never "safe", and that the 2 degree target could well be out of our hands now, some minds turn from despair to geoengineering. I monitor a geoengineering group that is an exchange of views between some of the top researchers, i.e. Keith, Caldeira, etc., and this is what I feel. they aren't profit seeking cowboys- they are deeply concerned about what happens if say the Republicans suddenly wake up to the facts and immediately want to apply some wacked out scheme touted by such as Lomborg. They want to be able to say something about what scientific investigation of various techniques has shown might happen as civilization finds itself unable to face its present and becomes ready to try anything. Kevin Anderson's views are also worth study. Anderson is associated with the Tyndall Centre in the UK, which is sometimes billed as the UK's premier climate research institution. He feels climate scientists, and anyone who has been in any way minimizing how serious the problem we now face is need to be more explicit about what they know and feel in the future. an example of what he's critiquing: the Stern report he says contains fudged date and impossible assumptions as it concludes climate could be solved at reasonable cost, and he states categorically that most of his colleagues understand this but have been rather quiet.Moderator Response: [DB] The Royal Society 4 Degrees issue can be found here (many articles are open-access). -
garethman at 04:16 AM on 1 September 2012Realistically What Might the Future Climate Look Like?
We made a conscious decision a few years ago to act ourselves. I do not believe anyone has the political power or will to to anything, so action must come locally. We installed solar energy panels, switched to wood fired stoves, we grow our own veg and try and work from home as much as possible. I know this sounds smug, and I'm aware not everyone has the opportunity to change. But the financial benefit has been great. It helped put a child through University which was a major unpredicted benefit. Even if we just start with switching to LED lighting it will help, but one of the things that prevent people acting is that the problem is so huge, and that they expect the government or IPCC to act on their behalf. It's not going to happen, we have to pursuade everyone that they have the power to change things and every little helps. Measures to address climate change start at home, we must act locally. -
Kevin C at 03:47 AM on 1 September 2012Matt Ridley - Wired for Lukewarm Catastrophe
Joel: If you want to project a realistic temperature rise from CO2 emissions including warming in the pipeline from CO2 we have already emitted, there is a simple method of doing do. I did it <20 lines of R code. The method is spelled out in detail in this paper: Rypdal 2012 (open access). For a realistic future projection, you'll need to take into account that we probably can't maintain an increasing output of cooling aerosols, and China are working to reduce their aerosol output because of the health issues.
Prev 1086 1087 1088 1089 1090 1091 1092 1093 1094 1095 1096 1097 1098 1099 1100 1101 Next


