


 Arguments


Recent Comments
Prev 1093 1094 1095 1096 1097 1098 1099 1100 1101 1102 1103 1104 1105 1106 1107 1108 Next
Comments 55001 to 55050:
-
Daniel J. Andrews at 00:36 AM on 29 August 2012Matt Ridley - Wired for Lukewarm Catastrophe
His part on acid rain effects on forests and lakes had me wondering what studies he was cherry-picking. I suspect he was looking at forests and lakes on more alkaline soils which neutralized some of the effects of rain. Up in Canada on the Canadian shield in the east, our soils are already naturally acidic with very little buffering capacity. They did sustain damage, and a large number of our lakes died. Plus the extra acidity leached mercury from the rocks/soil into the lakes so any fish still in the lakes were high in mercury content. Some of our most heavily effected lakes still haven't recovered. And in extreme cases where localized pollution made the rain even more acidic (Sudbury, for e.g.) the vegetation disappeared. Even with the regreening effort, you can still tell this area has been heavily effected (small stunted trees, small birch trees with many dying limbs). -
vrooomie at 00:07 AM on 29 August 2012Matt Ridley - Wired for Lukewarm Catastrophe
MOTS. All we can hope is, this recent uptick in desperate dispersion of lies, half-truths, and logical fallacies in the denialosphere (aided and abetted by the near-worthless media) is a sign that recent climate events, plus the ever-growing support of climate change viz. AGW, is driving the denialists into ever-increasingly weird and tin foil-hatted tomfoolery. Give'em the rope with which to hoist themselves. Science moves forward....let's hope that rate of increase is ever slightly greater than the increase of folks like Ridley. -
vrooomie at 23:25 PM on 28 August 2012The New Climate Dice: Public Perception of Climate Change
Michael sweet@11: my suggestion for 8 sigma? KYAG. Said in other words, we're *done,* as in, stick a fork in humanity. -
vrooomie at 23:11 PM on 28 August 2012Why Arctic sea ice shouldn't leave anyone cold
DB@62.....*yikes*. -
johnm33 at 23:07 PM on 28 August 2012Why Arctic sea ice shouldn't leave anyone cold
Bob Loblaw That's a great graph look forward to the update. -
Bob Lacatena at 23:03 PM on 28 August 2012Why Arctic sea ice shouldn't leave anyone cold
Excellent response, Daniel. That's what people need to see. Not graphs that they need to abstractly interpret, but images like these that make the truth of the matter fairly plain. Really? Christy was comparing (in words) 1938 to 2012? Really? -
Daniel Bailey at 22:31 PM on 28 August 2012Why Arctic sea ice shouldn't leave anyone cold
The head-to-head comparative: Arctic Sea Ice Extent August 1938: [Source]
Arctic Sea Ice Extent August 2012:
[Source]
Arctic Sea Ice Extent August 2012:
 [Source]
Comparable?
[Source]
Comparable?
-
FrankD at 21:56 PM on 28 August 2012Why Arctic sea ice shouldn't leave anyone cold
Dave123 @ 21, Danske Meteorologiske Institut published a series of annual reports on arctic sea ice covering most years from 1893 to 1956. The link has one folder per year, with each containing individual pages (month identified by the trailing digit) and the whole annual report (about 5 meg each). Just referring to August extent... Its true that ice extent was lower in the 1930s than it had been in the preceding 30 years. In particular, 1938 saw a dramatic reduction from the previous years - it was probably 1.4 M km^2 below the then long term average and maybe 0.6 M km^2 below the already low years in the late 30's (carefully measured using Eyeball, Mk I). But then we see something of a recovery, with extent returning to close to climatology in 1939 and 1946. Unfortunately we don't have measurements for 1940 to 1945, due to the Second Great Unpleasantness. So, it is fair to say there were some big melts in the 30's. But Christy's false equivalence is an epic fail - "similar melts" is pretty nice weasel-wording for mine. 1.4 M km^2 below recent climatology? Considered like that, 1938 was like 2010, I guess. But in absolute terms, August 1938 extent was much greater (4 M km^2?) than today. So any attempt to conflate the two is...well...I can['t think of an adjective suitable for polite company. Taking the Kinnard graphic - the 1930's "similar melt" is the second last dip on the graph, the first decline with modern observational data. This saw a return to "normal" after a peak that had seen the greatest extents in 500 years. Compared to the current decline on Kinnard (even without "enhancement")? Well, even on Sesame Street they could tell you when one of these things was not like the other... -
CBDunkerson at 21:51 PM on 28 August 2012Why Arctic sea ice shouldn't leave anyone cold
Eric wrote: "Your first link is the most meaty. implicating AA, not low sea ice per se." Erm... arctic amplification (presumably what your 'AA' refers to) is caused by low sea ice. Temperatures increase... ice melts... water absorbs more sunlight... temperatures increase more. Arctic amplification. Ditto the polar vortex... which is caused by the low temperature at the pole. Arctic temperatures increasing at a faster rate than the rest of the planet (from Arctic amplification... from low sea ice... from AGW) means a lower temperature differential and therefor weaker polar vortex. In short, you are drawing 'distinctions' between things which are all intimately related. -
CBDunkerson at 21:41 PM on 28 August 2012Arctic sea ice breaks lowest extent on record
I assumed the area shown in the photo was the mass of ice which got separated from the main pack. Traces of that are actually still showing up on the satellite maps, and back on the 20th it was still fairly substantial. Most of the continued decline has been due to this large area of widely scattered ice continuing to melt out. Which is an important thing to consider about the ongoing declines... the lower the ice concentration the faster the ice melts. This is why the ice pack usually only has a low concentration around the edges. Once the concentration drops below a certain level the ice quickly melts and the solid pack behind it becomes the new edge... until that spreads out enough to melt down. There is thus a 'buffering' effect which protects the core ice pack. The storm at the beginning of the month scattered ice far and wide and thus removed this buffering effect for a large portion of the ice pack... allowing remarkably fast melt for August. As we see more storms and greater wave action from a more ice free Arctic this process will just continue to accelerate. Another note... the maps show that essentially 100% of the first year ice melted out this year. I don't know if that has ever happened before, but it certainly isn't common. Indeed, almost all of the second year ice is gone too... and a good portion of the remainder is very thin and broken up. This means that the multi-year ice is nearly the only ice which survived this year... and not all of that either. Further, even though the remaining mutli-year ice has been largely protected from being broken up by wave and storm action by the 'buffer' of younger ice around it this year... it is still thinning from warmer air and water temperatures. We can see this in the ongoing decline of ice volume. PIOMAS shows that maximum ice volume at the end of Winter has declined almost as much as minimum ice volume (despite area/extent being little changed). This suggests the possibility of a continuing trend leading to no ice year round in future decades as Steve L alluded to. -
Bob Lacatena at 21:38 PM on 28 August 2012Why Arctic sea ice shouldn't leave anyone cold
Eric, Here's a link to 1,390 papers containing "arctic" and "jet stream" published since 2009. -
Eric (skeptic) at 20:36 PM on 28 August 2012Why Arctic sea ice shouldn't leave anyone cold
Sphaerica, I just added to this thread /weird-weather-march-madness.html where I addressed the topic of causes of blocking events. -
Eric (skeptic) at 20:31 PM on 28 August 2012Weird Winter - March Madness
I'm adding a little to this thread and a pointer from another thread, not to suggest that I have all the answers of what causes "weird" weather, more specifically high amplitude patterns in winter, but to show that there are more substantial theories than "low sea ice". Here's a description on the phenomenon: Breaking Planetary Waves in the Stratosphere One possible explanation: Effects of Solar UV Variability on the Stratosphere which I must again stress is not the explanation. At best it is part of an explanation. -
Eric (skeptic) at 19:39 PM on 28 August 2012Why Arctic sea ice shouldn't leave anyone cold
Thanks for the links Sphaerica. I had read a few papers over the last few years about the potential link between low sea ice and blocking. They mostly seemed to derive from a paper around 2006 describing some simulation results. I don't think those results are well established even now, a few years later. Your comment that my paper is dated is true, and it is also true that there was more sea ice back then so some effects may not have been present. However it is also true that the low sea ice to blocking link was not anticipated or predicted before around 2005/6. As a relatively new concept, it must be treated with skepticism particularly since it coincides with a very low solar minimum which is another possible source for blocking patterns. Your first link is the most meaty. implicating AA, not low sea ice per se. AA may well reduce the polar jet since it reduces the N-S temperature contrast. I think that is a pretty well supported theory but I'm not sure of the magnitude of the linkage. Your second link is less supportive of the low sea ice theory. It describes the relationship between the polar vortex and the Rossby waves, not relating them to other factors like low sea ice. Essentially the breaking of the waves can but not always lead to blocking and the subsequent effects described in the OP. Your third link is too short to evaluate. I'll look for a better and more recent paper to support my view of the RW breaking and their causes. -
Dave123 at 15:56 PM on 28 August 2012Why Arctic sea ice shouldn't leave anyone cold
Here is another paper cited by a denialist to mean that we saw current levels of ice free from 1920-1940. I supposed I could look up the routes indicated and show this was all bunk....but I thought I'd ask if anyone had seen it before: http://mclean.ch/climate/Arctic_1920_40.htm -
Bob Lacatena at 13:56 PM on 28 August 2012CO2 effect is saturated
176, desertphile,Is there any scientist out there who believes Earth's atmosphere is CO2 saturated?
Climate scientist? No. I'm sure you'll be able to find some physicists and such, even ones of great stature in their own fields, who will subscribe to such insanity, but not any climate scientists. Not even the likes of Roy Spencer, Richard Lindzen or Roger Pielke, Sr. [I won't link to discussions proving that Lindzen or Pielke believe in the greenhouse effect, because [snip] Suffice to say, no, not even serious deniers like Spencer, Lindzen or Pielke will destroy their own reputations that completely by ascribing to "CO2 is saturated"[snip] People who buy into lame points of view like that are either in serious denial or so thoroughly lost in the depth of the science that you can't possibly educate them.]Moderator Response: TC: Inflammatory snipped. -
Bob Lacatena at 13:45 PM on 28 August 2012Why Arctic sea ice shouldn't leave anyone cold
54, Eric, No, it's not speculative. The paper you link to, while not at all invalid, is somewhat old (11 years). There has been considerably more work done in the field. In particular, it is less speculative because the changes to the Arctic are actually happening now, so they can study what is happening versus what they project will happen. Here are just three from 2012: Evidence Linking Arctic Amplification to Extreme Weather in Mid-Latitudes Dynamical Evolution of North Atlantic Ridges and Poleward Jet Stream Displacements Arctic melt leads to weather extremes -
Bob Lacatena at 13:33 PM on 28 August 2012Arctic sea ice breaks lowest extent on record
Steve L, It's hard to get a clear satellite shot, because there are always a lot of clouds, but the most recent clear shot I found of Barrow was 8/13, and it shows a ton of ice. This less clear but more recent shot from 8/23 has a lot of clouds but you can see the area around Barrow, and a whole lot of ice at sea there. The thing is, from the satellite images you can clearly see that this is below 15%, and yet it is still a lot of ice from a navigation point of view (and possibly/probably exemplary of the picture in the post above. from the deck of the Coast Guard ship -- but it's hard to say exactly where that ship was when the picture was taken). This year is a little unusual because ice has been hanging around the coast of Alaska, despite the extreme melt. This in turn has been messing up Shell Oil's plans to do exploratory drilling there. Whatever the cause, it may be an anomaly associated with this year, or one that will become a recurring pattern as part of "today's Arctic" (at least for a few years, since I think the Arctic is going to keep changing at warp speed until it reaches a bizarre, stable, ice-free state). -
Eric (skeptic) at 12:09 PM on 28 August 2012Why Arctic sea ice shouldn't leave anyone cold
This part The heat and moisture that are then released to the atmosphere in fall and winter could be leading to disturbances of the jet stream, the high-altitude wind that separates warm air to its south from cold air to the north. A destabilized jet stream becomes more 'wavy', allowing frigid air to plunge farther south... is very speculative. The jet has an effect on ice, for example described here Response of Sea Ice to the Arctic Oscillation. They note an effect in both directions, from thin ice to AO and vice versa, but mostly the latter. According to the paper, we should see thin and decreased ice this year after a relatively positive AO last winter. That's the same result as after the winter of 2006/7 with similarly positive AO. -
desertphile at 11:06 AM on 28 August 2012CO2 effect is saturated
For the past six days I have seen a few denialists on alt.global-warming insisting atmospheric CO2 has reached saturation point 12 years ago. At least one denialist has shown signs of hysteria over the issue, when his cherished "smoking gun" assertion gets corrected and evidence is given to him that his assertion is false. (It's like a Scientology customer learning L. Ron Hubbard's real biography; or like a Christian Scientist, who believes his legs don't really exist, trying to walk on a broken ankle.) Is there any scientist out there who believes Earth's atmosphere is CO2 saturated? -
Bob Loblaw at 10:55 AM on 28 August 2012Why Arctic sea ice shouldn't leave anyone cold
ranyl: I'll be wondering what the graph looks like in a week, too. If I get a chance, I'll update it as time goes on. -
Daniel Bailey at 10:52 AM on 28 August 2012Arctic sea ice breaks lowest extent on record
I believe I understood what SW was referring to. But perhaps my unfinished thought didn't fully come across. If the summer ice is disappearing per Maslowski's model, then what is the likelihood that seasonal ice would still persist until another 8-9 decades? Eisenman & Wettlauffer, 2008: Non-linear Arctic Ice Threshold Behavior examined the non-linear dynamics of the Arctic in the presence of seasonal ice. What they found is that the ice, once seasonal ice is lost and heating continues, behaves in a nonlinear fashion with a bifurcation state existing. Translated, this means that the Arctic system either supports a full-ice, or a no-ice, solution as a stable state. If what we are witnessing is indeed the loss of the full-ice stable state, then Eisenman & Wettlauffer come into play. Given that we are in the presence of an energy imbalance at the TOA that is ongoing (plus we continue to make this imbalance worse with continuing CO2 releases) then the transition to a no-ice stable state may be swifter than any current model (even Maslowski's) can represent. -
Steve L at 10:17 AM on 28 August 2012Arctic sea ice breaks lowest extent on record
DB: I believe SW was referring to year-round ice free rather than just at Summer minimum. I have a question about the photo for the blog post -- I would have expected (from looking at the summaries of satellite data)there to be pretty much zero sea ice Northwest of Barrow on Aug 20. Sailboats zipped through both Arctic passages in 2010, I think, and I would expect ice like that in the picture to potentially impede them. I guess I'm wondering if there's a good source of images that allow one to learn to interpret satellite data (e.g. <15% sea ice) in terms of what it actually looks like when you're there. -
Riduna at 09:53 AM on 28 August 2012Arctic sea ice breaks lowest extent on record
It will be interesting to see trends in the level of decline in the volume of sea ice and growth in the area covered by 1 year ice. These measures could provide an indication of the speed and magnitude of future sea ice loss. Present indications are that by mid-September 2012 the extent of sea-ice could be below 4 million sq.km. which would certainly be food for thought, particularly for those “skeptics” who deny sea ice loss. Of immediate concern is growth in the area of the Arctic Ocean exposed to and absorbing, rather than reflecting solar energy. It seems likely that this could contribute to warming of sea water and troposphere which reduces the period when sea ice is formed and the Greenland Ice Sheet remains stable. -
Daniel Bailey at 09:44 AM on 28 August 2012Arctic sea ice breaks lowest extent on record
Hi, SW!"If the modellers are right - and so far they have consistently underestimated the rate of melt - this will mean that by the end of the century we will have moved from a permanently ice covered ocean to one which is permanently ice free."
Well, that's not exactly right. Based on data through 2005, Wieslaw Maslowski predicted in March of 2006 that the Arctic sea ice could essentially by ice-free (less than 1 million square kilometers) by 2016 ± 3 years (Slide 6, here). A more topical discussion of his model can be found here. This model prediction is still on-target, as events we witness today attest. -
Sceptical Wombat at 09:05 AM on 28 August 2012Arctic sea ice breaks lowest extent on record
Oops - I got confused between the area that Hudson Bay drains and the area of the Bay itself. So I rather overstated the case. Nonetheless the reduction in Sea Ice is massive. -
ranyl at 08:59 AM on 28 August 2012Why Arctic sea ice shouldn't leave anyone cold
Bob Loblaw, Thanks for that worrying but really good graphic of what seems to be a clear change. And 2012 hasn't been an optimal melt year either in terms of weather patterns. Wonder what this graph will look like in a week's time? There still seems to be a lot of warm water arround and the ice is very thin apparently. Wonder what this will do to the weather in the months to come? -
Sceptical Wombat at 08:31 AM on 28 August 2012Arctic sea ice breaks lowest extent on record
When looking at ice cover during the satellite period I think we miss the big picture. Whaling records since 1880 together with aircraft and submarine records during the cold war make it pretty clear that prior to 1960 arctic sea ice extent never got below 8 million square km. The area of the Arctic Ocean including Hudson Bay is 14 million square km. Hudson bay accounts for about 4 million of these and has (at least since Europeans have been observing it) always been seasonally ice free. This implies that the vast majority of the rest of the Arctic Ocean was permanently ice covered We are rapidly moving to a situation where this will only be true for parts of the Canadian Archipelago and the North coast of Greenland. If the modellers are right - and so far they have consistently underestimated the rate of melt - this will mean that by the end of the century we will have moved from a permanently ice covered ocean to one which is permanently ice free. The mind boggles at what this may mean for NH weather. -
Tom Curtis at 08:22 AM on 28 August 2012Why Arctic sea ice shouldn't leave anyone cold
kar @36, thank you for the corrected graph. Unfortunately, I have been made aware in discussion elsewhere that even as amended it still requires a caveat. The original graph from Kinnard et al, 2011 shows 40 year mean values, and hence is up to date to 2010. Consequently an apples to apples comparison would only extend the original instrumental average to (approx)just below the "2000" figure on the graph. Having said that, while it is generally very bad practice to compare annual to multi-annual mean data, because of the extraordinary rapid decline in sea ice over the last decade, using multi-annual means conceals far more than it reveals. The 2012 melt is startling and concerning in a way that even that of 2007 was not. How much so is revealed by the graph displayed by Bob Loblaw @49. Give that that is over the fold, and how important that graph is given our current state of knowledge, I shall display it again below: Based on that graph, it is not at all clear that the rapid trend to increased daily melt had ended, even though it has already continued four weeks beyond the normal inflection point. As it is, a sea ice extent minimum under 4 million km^2 looks a dead certainty, and minimum sea ice extents of 3.5 million km^2 or less are well on the cards.
In any event, caution should be used in using your graph; and if used, the difference between 40 year mean and annual data is clearly mentioned as a caveat so that we do not accidentally mislead. (Note, if you are inclined to amend the graph to reflect my "more accurate" position mentioned above, don't. That position was worked out from a back of the envelope calculation, and is indicative only.)
Based on that graph, it is not at all clear that the rapid trend to increased daily melt had ended, even though it has already continued four weeks beyond the normal inflection point. As it is, a sea ice extent minimum under 4 million km^2 looks a dead certainty, and minimum sea ice extents of 3.5 million km^2 or less are well on the cards.
In any event, caution should be used in using your graph; and if used, the difference between 40 year mean and annual data is clearly mentioned as a caveat so that we do not accidentally mislead. (Note, if you are inclined to amend the graph to reflect my "more accurate" position mentioned above, don't. That position was worked out from a back of the envelope calculation, and is indicative only.)
-
dana1981 at 07:51 AM on 28 August 2012Why Arctic sea ice shouldn't leave anyone cold
A point of clarification on the Kinnard graphic. It extends to 2008, thus including the 2007 minimum, and thus does not need to be extended much further down to incorporate data up to present. The values are not as low as one might expect, no doubt because of the 40-year lowpass filter being applied. I'd say the unedited version of the graphic is a pretty reasonable representation even up to present. -
Bob Loblaw at 07:02 AM on 28 August 2012Why Arctic sea ice shouldn't leave anyone cold
Much discussion about this year's trends in sea ice extent and area on line. I've seen several comments mentioning how the extent continues to drop, even though by this time of year we usually start to see a reversal (or at least a slowing of melt). I followed the links on Neven's blog to grab the data from IARC-JAXA, and created the following graph. It shows the daily change in sea ice extent. I've smoothed it with a five-day running mean, but a couple of caveats: - I didn't bother dealing with the end-of-year wrap, so days 1-5 and 360-365 aren't quite right - I didn't bother accounting for Feb. 29 in leap years - nothing special was done to the last few days of 2012, so the running mean actually runs on past today (August 27) because the means for August 28-31 already have one value that they will need. Thus, the last few points for 2012 actually are for fewer than 5 days, and devolve into a single day's value, with the last one being the real value for today (plotted as it if is the August 27-31 running mean). This tends to accentuate the current decrease. Anyway, here is the graph:
All I can say is that the current melt pattern (over the past week) certainly seems to be outside the bounds of experience. "Normal" doesn't live here any more.
-
Daniel Bailey at 05:02 AM on 28 August 2012Why Arctic sea ice shouldn't leave anyone cold
Anytime you're ready we can do a standalone post on the ZIS, Mauri. The big league hitters like Zacharaiae deserve some attention all their own. -
mspelto at 04:32 AM on 28 August 2012Why Arctic sea ice shouldn't leave anyone cold
Zachariae Ice Stream is one place that needs much more cold. Dan Bailey, our prediction is still valid. -
shoyemore at 01:37 AM on 28 August 2012Between St. Roch and a cold place
I recall that recently both the North West and North East passages have been traversed in the same season. Surely unique, and should be added to the post. -
kar at 01:22 AM on 28 August 2012Why Arctic sea ice shouldn't leave anyone cold
curtis@4 commenting sout@2 are suggesting that the curve should be more like this: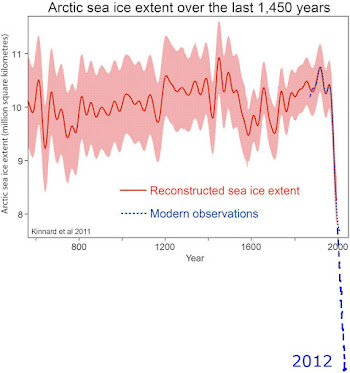 Still clear, bad and not a trend anyone would like.
Moderator Response: TC: Concern has been expressed privately among SkS authors about the potential for this graph to mislead the unwary. The key concern is that the original graph shows a 40 year running average of mean August extents, which the amended graph compares with the estimated 2012 August mean extent. That is not an apples to apples comparison. Further discussion can be found below by Dana, and myself. This comment should not be interpreted as indicating we do not appreciate the efforts of Alex, Sou or Kar in preparing and displaying the graphs.
Still clear, bad and not a trend anyone would like.
Moderator Response: TC: Concern has been expressed privately among SkS authors about the potential for this graph to mislead the unwary. The key concern is that the original graph shows a 40 year running average of mean August extents, which the amended graph compares with the estimated 2012 August mean extent. That is not an apples to apples comparison. Further discussion can be found below by Dana, and myself. This comment should not be interpreted as indicating we do not appreciate the efforts of Alex, Sou or Kar in preparing and displaying the graphs. -
Daniel Bailey at 01:15 AM on 28 August 2012Why Arctic sea ice shouldn't leave anyone cold
John while there is reason to believe that circulation changes may result in a slowing of the AMOC (of which the Gulf Stream is a part), there doesn't appear to be enough evidence to show that a shutdown is in order. For a detailed discussion of this, see here: The Last Interglacial Part Four - Oceanic Influences -
John Chapman at 00:54 AM on 28 August 2012Why Arctic sea ice shouldn't leave anyone cold
What about the Gulf Stream? I understand that it would be in danger of collapsing if there is too much fresh water introduced into the Atlantic. The consequences to European agriculture would be immense if the Gulf Stream no longer brought warm water to the north of Europe. -
Bob Lacatena at 00:40 AM on 28 August 2012Teaching Climate Change in Schools
26, Phil, I have noticed that there are certain people -- a fairly large population of them, in fact -- who view everything in terms of money and making money. This is their only motivation for doing things, and as such this is their main criteria for evaluating any scenario, no matter what its nature. Everything boils down to money. And for these people, they seem to be incapable of recognizing any other motivation or primary factor in others' decisions. Research is done for money, not the sake of research, interest in the work, or the reward of discovering something new. One gets into climate science and climbs on the AGW wagon to make an easy buck. The IPCC effort is done for money, not for the sake of helping to coordinate the efforts of world governments in addresses a common, scientific problem. It's a way for poor nations to squeeze money out of rich nations, or for scientists and rich green-energy investors to squeeze money out of world governments. Carbon taxes and funding for green-energy or promotion of reasons to pursue green-energy are done as a backhanded way to make money without doing any actual work (like those nose-to-the-grindstone Koch brothers). For those people everything in the world is viewed through the money lens, and there's no way to convince them otherwise, just as it is impossible to truly describe color to a person who has been blind from birth. -
EliRabett at 23:01 PM on 27 August 2012Patrick Michaels' 1992 claims versus the 2012 reality
Not to defend Michaels in general, but to defend him on this point, 4.2 was the number used in Hansen, et al 1988. It was wrong, but coupled with a bit too low estimates of the forcing scenario B, it kept the forecast on track for more than 20 years. Hansen himself said in 1998 "Close agreement of observed temperature change with simulations for the most realistic climate forcing (scenario B) is accidental, given the large unforced variability in both model and real world. Indeed, moderate overestimate of global warming is likely because the sensitivity of the model used (12), 4.2°C for doubled CO2, is larger than our current estimate for actual climate sensitivity, which is 3 1°C for doubledCO2, based mainly on paleoclimate data (17). More complete analyses should include other climate forcings and cover longer periods. Nevertheless, it is apparent that the first transient climate simulations (12) proved to be quite accurate, certainly not ‘‘wrong by 300%’’ (14). The assertion of 300% error may have been based on an earlier arbitrary comparison of 1988– 1997 observed temperature change with only scenario A (18). Observed warming was slight in that 9-year period, which is too brief for meaningful comparison. -
Phil at 20:59 PM on 27 August 2012Teaching Climate Change in Schools
With regard to the Grant Money argument there are the following rebuttals (bear in mind this is written from a UK perspective and same may not be true elsewhere) 1. Grant Money does not pay the salary of the person applying. Typically an academic will be salaried by the institution at which they teach/lecture. A grant may allow them to employ post-doctoral or technical workers (for relatively short periods of time) but does not go to "line the pocket" of those applying. 2. How come this fraudulent activity is restricted to Climate science ? Or is the implication that all academic research (including that which medical treatments are based) is flawed due to this practise ? If that is so, why is it that grant awarding bodies have not "wised up" to this practise, why are there no whistleblowers from inside the grant awarding bodies complaining about the waste of tax-payers money ? 3. To claim that academics would deliberately fabricate research results for financial gain misunderstands the motivation for entering academic research in the first place. People are drawn to academia because they have a strong motivation to investigate and understand their subject - not to make money or build a research "empire". There are a few isolated cases of scientific fraud - Cyril Burt and Gregor Mendel spring to mind - but these seem to have been motivated by a desire to be bolster their particular theory, not to make money. -
John Russell at 20:35 PM on 27 August 2012Climate Change, Irreversibility, and Urgency
Like other people on this thread I'm becoming increasingly worried. What makes it more difficult is that as I carry on my day to day living I have nobody to talk to who really gets the urgency. The general attitude of those who at least accept the science seems to be, oh they'll do something about it, they won't let the worst happen. But it's clear to me that they will -- humans don't react until their backs are unequivocally against the wall. I mean; even the rapid Arctic ice loss seems to be being cast as an opportunity. They see the silver lining, not the black cloud. It seems clear to me that, in the natural world, change tends not to happen in a smooth progression; it happens in fits and starts as various tipping points, large and small, occur. It's like a dam slowly filling to the point it gives way, or a river overflowing and breaking its banks, or the tension building up in tectonic plates until an earthquake occurs. Anyone who expects climate change to occur in a steady and manageable progression, giving time to adapt, is deluded and, frankly, dangerous. Frighteningly, it seems that everyone with money and power is in that category. It's psychiatry we need, even more than climate science. -
Bart Verheggen at 18:54 PM on 27 August 2012Why Arctic sea ice shouldn't leave anyone cold
"Can someone please translate this into a few key languages and get this spread to as many blogs around the web as possible!? " A Dutch version is on my blog: http://klimaatverandering.wordpress.com/2012/08/26/waarom-arctisch-zee-ijs-niemand-koud-zou-moeten-laten/ -
johnm33 at 18:21 PM on 27 August 2012Why Arctic sea ice shouldn't leave anyone cold
Tom Curtis @37 I dont' find your comment very reassuring, if the equilibrium is re-established over the time period you claim how do they 'breathe' in the meantime? https://sites.google.com/site/apocalypse4realmethane2012/home/2012-vs-2011-airs-ch4-359-hpa and clearly the [arctic] oceans warming is provoking a vast increase in methane release.[and not just in the ocean] If you have the time you should read the whole post i took the extract from and linked to, it raises many issues, has been recently added to, and assuming his profile is true has much relevent expertise. -
sandysandy at 16:51 PM on 27 August 2012Why Arctic sea ice shouldn't leave anyone cold
BTW I don't understand the abbreviations and therefore can't follow the threads properly. Please enlighten me and refer to the whole words initially at least, TYVM. -
sandysandy at 16:26 PM on 27 August 2012Why Arctic sea ice shouldn't leave anyone cold
If I get banned I will assume you're all climate change deniers! Joke. It's bank holiday here in the UK and it's 7.20 am. I fink the admins have gone to sleep so I will copy n paste ur comments and read them when I'm sober, I love all the viewpoints. Is there a page on 'ere where u can discuss general interaction of ecosystem in one place? -
Miriam O'Brien (Sou) at 14:52 PM on 27 August 2012Why Arctic sea ice shouldn't leave anyone cold
In response to suggestions that 'we' don't know about the arctic sea ice before satellites, it's pointed out that there were ships. Ships keep logs - and very good logs. NSIDC has some good compilations of Nordic ice edge from March through August for the period 1750-2002. It's not complete for obvious reasons, but if there is impenetrable ice down to a certain latitude then there's likely to be ice north of that latitude. Files are in different formats, even jpeg so you can visualise the edge. http://nsidc.org/data/docs/noaa/g02169_nordic_sea_ice/ -
empirical_bayes at 12:29 PM on 27 August 2012Climate Change, Irreversibility, and Urgency
I am more pessimistic than ever that events, science, or argument will convince people to change. I think the best we can do is point out to The Patient, that they are Overweight, that they need to cut out the cigarette smoking and whiskey drinking, and they need more exercise. If they choose not to do so, it is Their Choice. The Hard Part is that Our Own Kids will suffer the consequences, too. I have no realistic answers. All human systems have limitations. The United States Constitution is ingenious, but why should we expect it itself hasn't limits? Maybe global challenges like climate change are just too tough for it to successfully solve. I am less concerned about predictions like extreme storms and droughts than I am about the nonlinear bifurcations in the climate system which may be possible, because we are operating in paleo-historically unprecedented parts of the state space. Basis? See http://thinkprogress.org/politics/2009/05/19/41233/barton-carbon-god/ -
Pete Dunkelberg at 11:43 AM on 27 August 2012Teaching Climate Change in Schools
Michael, thanks for this additional information. Of course I don't know anything about your students. It is almost routine though that people who try to present reality to those who don't want to hear it become frustrated by the hardcases - the ones who just smart off against science. Remember they aren't the whole class. Anyone who might be going into science needs badly to be disabused of the vile "grant $" argument. For their sake and for the bystanders I think I would respond quite firmly to this argument, and brush off persistence as absurd. How can anyone believing that also think she or he is learning science, or indeed that there is any science to be learned? What was that Latin phrase? Don't let the hardcases get you down. -
villabolo at 11:40 AM on 27 August 2012Why Arctic sea ice shouldn't leave anyone cold
"A 2008 study found that a period of abrupt sea-ice loss could lead to rapid soil thaw, as far as 900 miles inland." Has anyone taken into consideration the fact that the quicker the permafrost warms, the higher the metabolic rate of the Methanogens becomes? With a higher metabolism there will be a higher rate of methane production. Would anyone know how much of an increase in methane production we'd get per degree of increasing soil temperature? Due to the lethargy of micro-organisms in the cold there should be an enormous increase in metabolism from, let's say, 40F soil to 60F soil. Another positive feedback loop? -
Riduna at 11:27 AM on 27 August 2012Global Warming - A Health Warning
Old Mole @86 My comments on over-pumping of ground water in the Central Valley is based on a report in Geophysical Research Letters (1), a report by the University of California-Irvine (2) and related links as well as an article in New Scientist (3). I note that your comment refers to the San Joaquin Valley only and, while I am not familiar with geography of the area, my understanding is that this constitutes only a part of the Central Valley. (1) http://www.agu.org/pubs/crossref/2011/2010GL046442.shtml (2) http://www.uci.edu/features/2009/12/feature_centralvalleywater_091214.php (3) http://www.newscientist.com/article/mg20927993.300-lettuce-is-sucking-californias-fruit-basket-dry.htmlModerator Response: [Sph] Hot-linked links.
Prev 1093 1094 1095 1096 1097 1098 1099 1100 1101 1102 1103 1104 1105 1106 1107 1108 Next


